Author: pebblewriter

  • On the Brink…Again

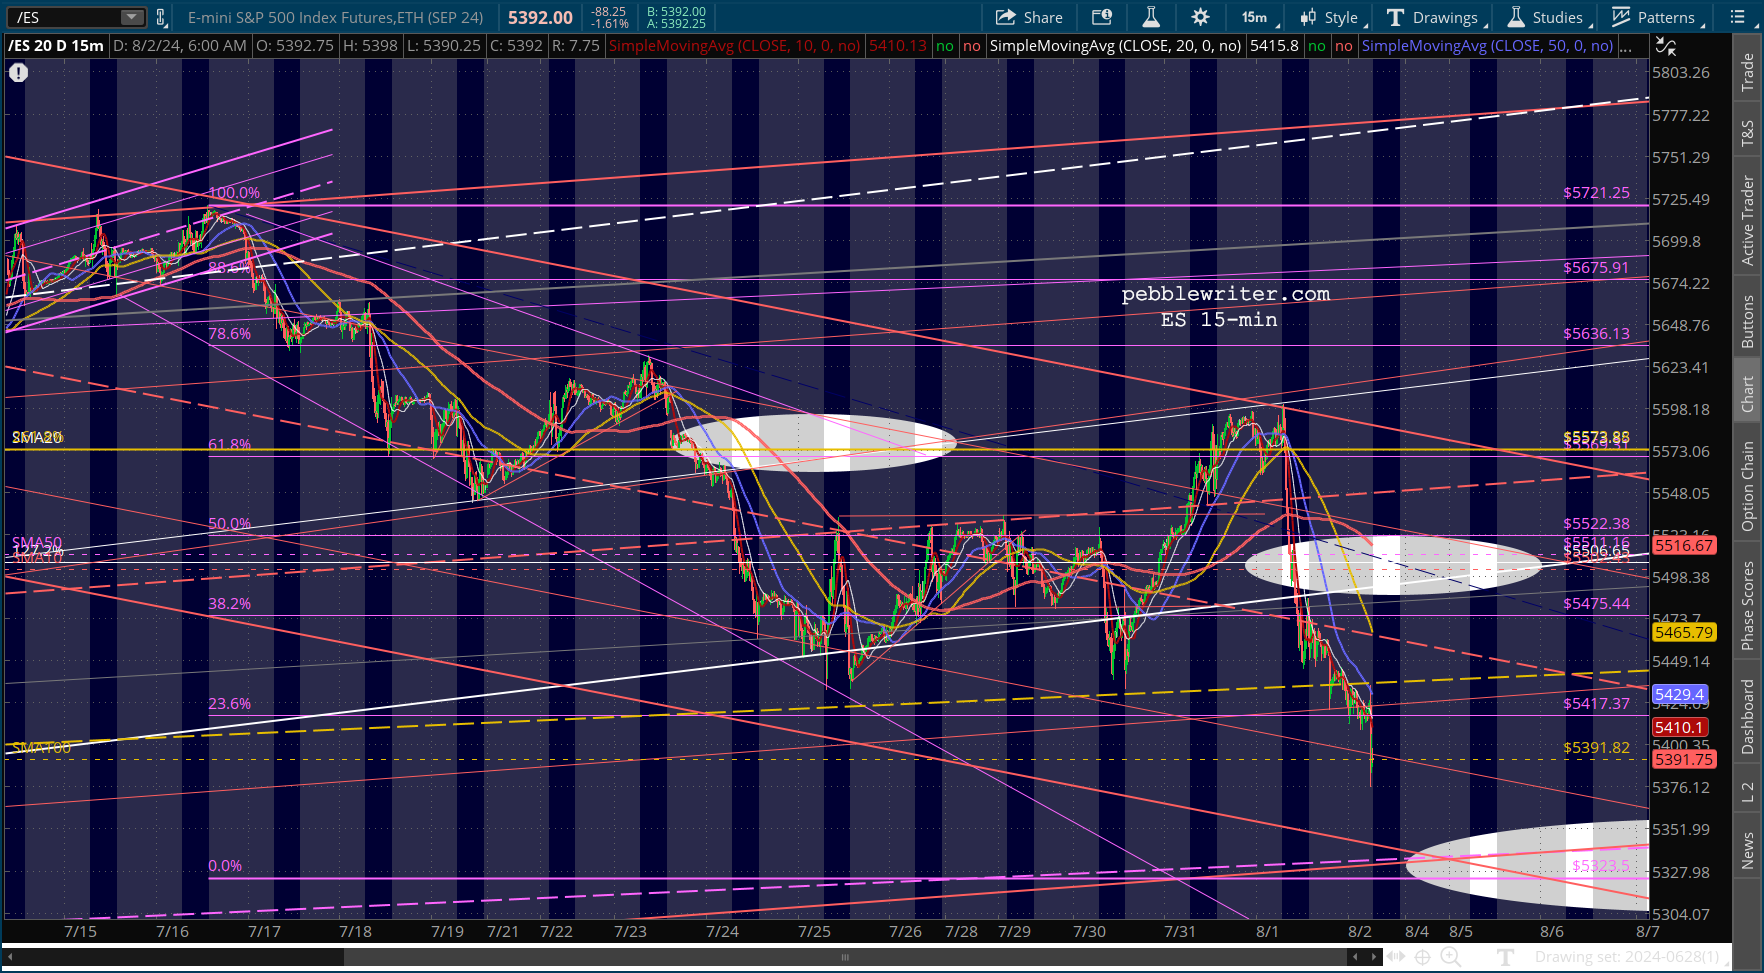
    It was only 3 weeks ago, July 16.  In that day’s post [see: On the Brink] we noted that the equity meltup was at risk from the bond market.

    A rather worrisome development in the bond market is threatening equities’ meltup. We’ve discussed this many, many times in the past. A breakdown in the 2s10s leads to corrections, while a breakout leads to crashes.

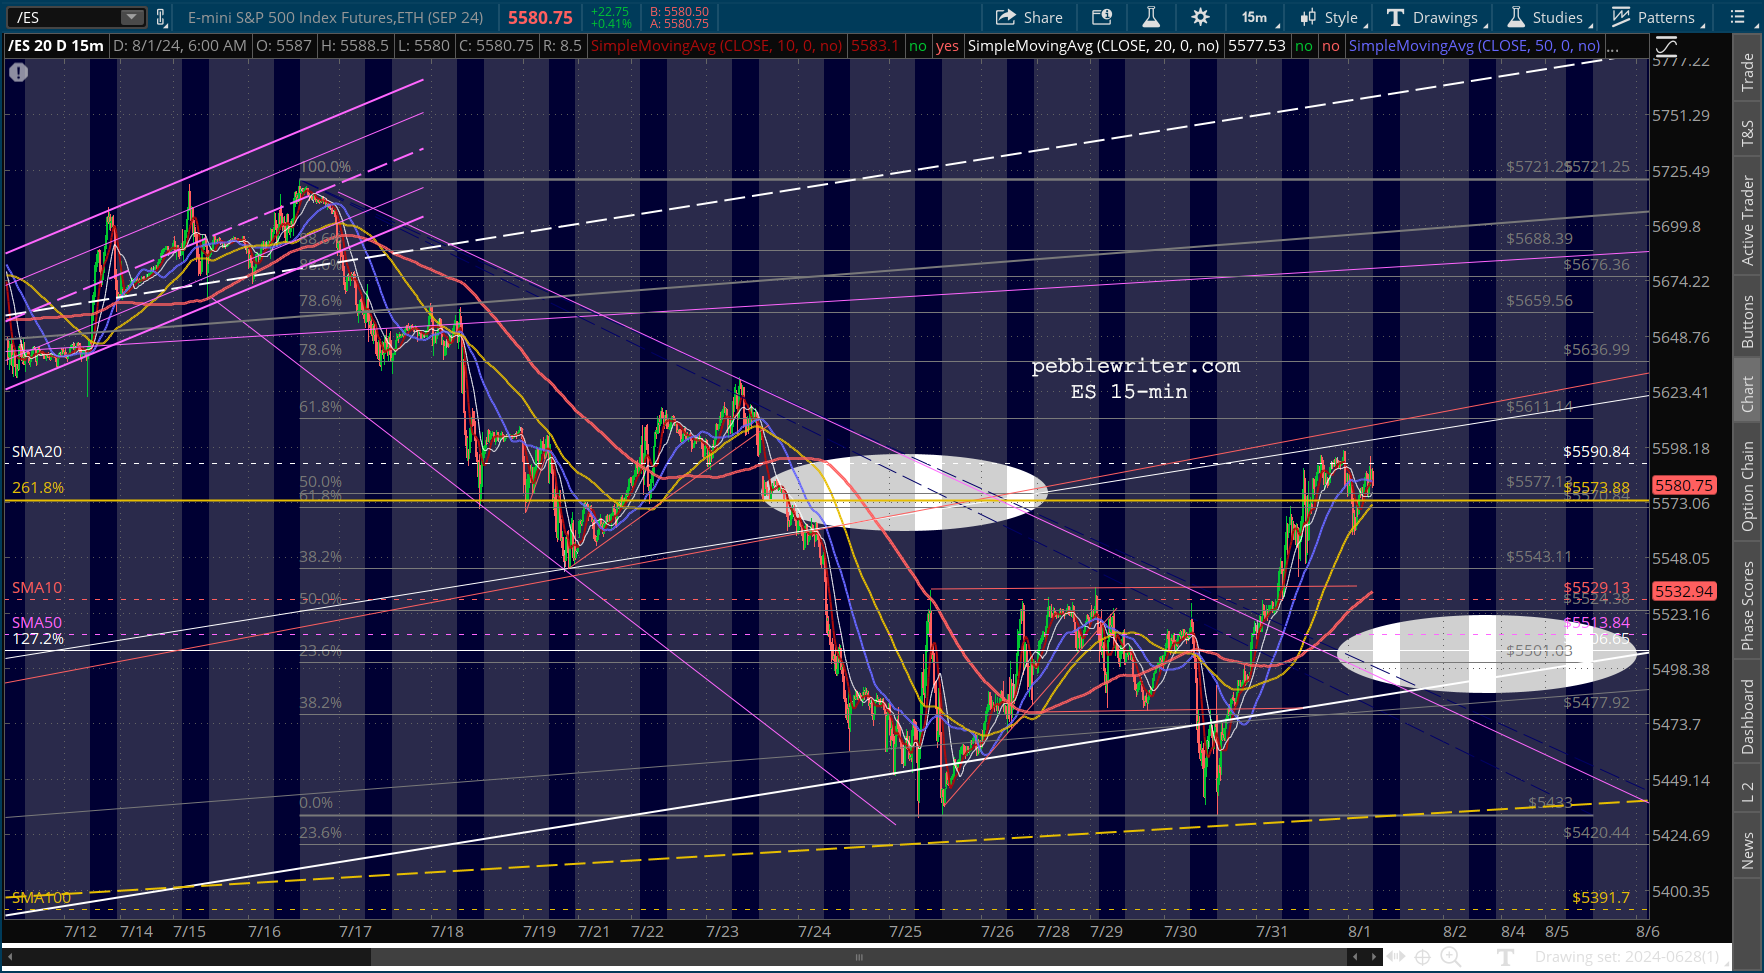
    It’s always a bit unnerving to publicly utter the “c” word in the midst of a market meltup. At the open that day, S&P 500 was up over 19% ytd.  In fact, it closed at an all-time high that day.

    In hindsight, with SPX 10% now lower (Nikkei futures off 28%) and futures nailing our next downside target, it seems pretty obvious.
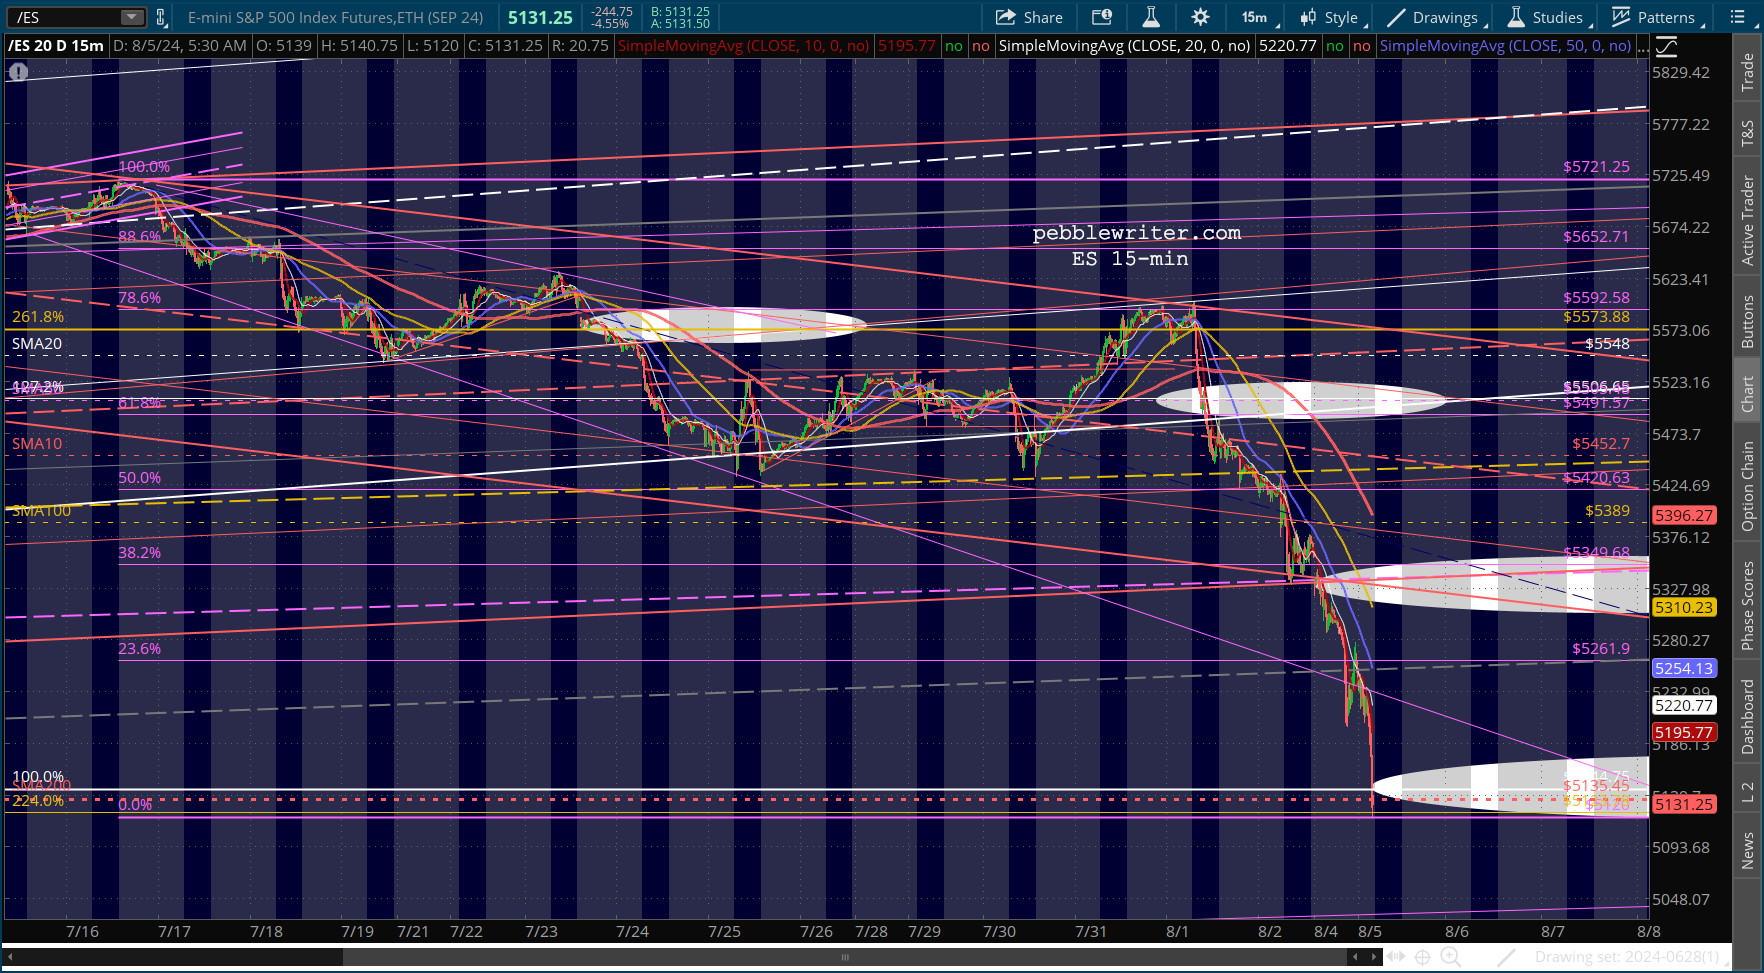
Don’t look now, but the bond market is on the brink yet again – an even more important brink. And, the yen carry trade is fast unwinding.

    continued for members

    (more…)

  • The Breakdown

    We’re seeing spectacular moves in the bond market this morning with the 10Y, which reached our 3.99 target yesterday, plunging as low as 3.79% and the 2s10s reaching -10 bps.

    Equities are taking it on the chin, with ES nearing our next downside target.

    continued for members(more…)

  • Charts I’m Watching: Aug 1, 2024

    That was quite a bounce yesterday, especially considering that nothing new was learned from the FOMC and we still have the very real threat of a broader war in the Middle East which threatens the entire lower inflation/rate cut narrative.

    continued for members(more…)

  • FOMC Day: Jul 31, 2024

    While the FOMC is not expected to rock the market’s boat today, a spectacular 11% rise in NVDA and another wrinkle in the Middle East conflict are certain to induce volatility.

    continued for members(more…)

  • Charts I’m Watching: Jul 30, 2024

    Futures are up slightly as the FOMC begins its July meeting. But, it’s a continuation of the consolidation that began last week.

    continued for members(more…)

  • Charts I’m Watching: Jul 29, 2024

    Futures are moderately higher after rising as much as 35 points overnight.

    Wednesday’s FOMC rate decision will dominate the financial news this week.

    continued for members(more…)

  • PCE in Line

    PCE came in as expected, 0.1% MoM for headline and 0.2% for core. Personal income and spending, however, showed a slowdown. Income was 0.2% versus 0.4% expected and prior, and personal spending was 0.3% versus 0.4% expected and prior.

    The mixed picture took a little steam off the futures, which had been up as much as 50 points overnight. Still, ES managed to hold important support as we approach the open.

    continued for members(more…)

  • Worst Day Since 2022

    It was a horrid day for the market, but a very good day for chartists.

    We got a taste yesterday of the power of our yield curve model, with SPX dropping by the largest percentage since October 2022 to nail our next downside target.

    continued for members(more…)

  • Yield Curve Cautions

    As we’ve discussed every day for the past week, the 2s10s is sounding an alarm that should have equities very concerned.

    continued for members(more…)

  • Update on RUT: Jul 23, 2024

    A lot has happened for RUT in the past week. It was only 11 days ago that we updated its chart, suggesting RUT would reach 2282 by the end of the year.

    RUT’s reversal at its .618 in April set up either a Gartley or Bat pattern, meaning a move to its .786 at 2282.27 or its .886 at 2364.78.  If we extend the dashed red trend line to the right, we get an intersection with the .786 at the end of the year – a very common scenario. While the .786 in December is a logical next target, an equally compelling case can be made for the .886 in September or October.

    Don’t look now, but RUT pushed past the red TL we discussed, allowing RUT to tag 2282 (well, 2278) late last week.

    continued for members(more…)