Author: pebblewriter

  • Oil to the Rescue, Again

    Yesterday’s meltdown made perfect sense — up to a point.  As USDJPY broke down through support level after support level, it was finally clear it was heading for 116.50 — the bottom of the red channel dating back to Nov 2014.

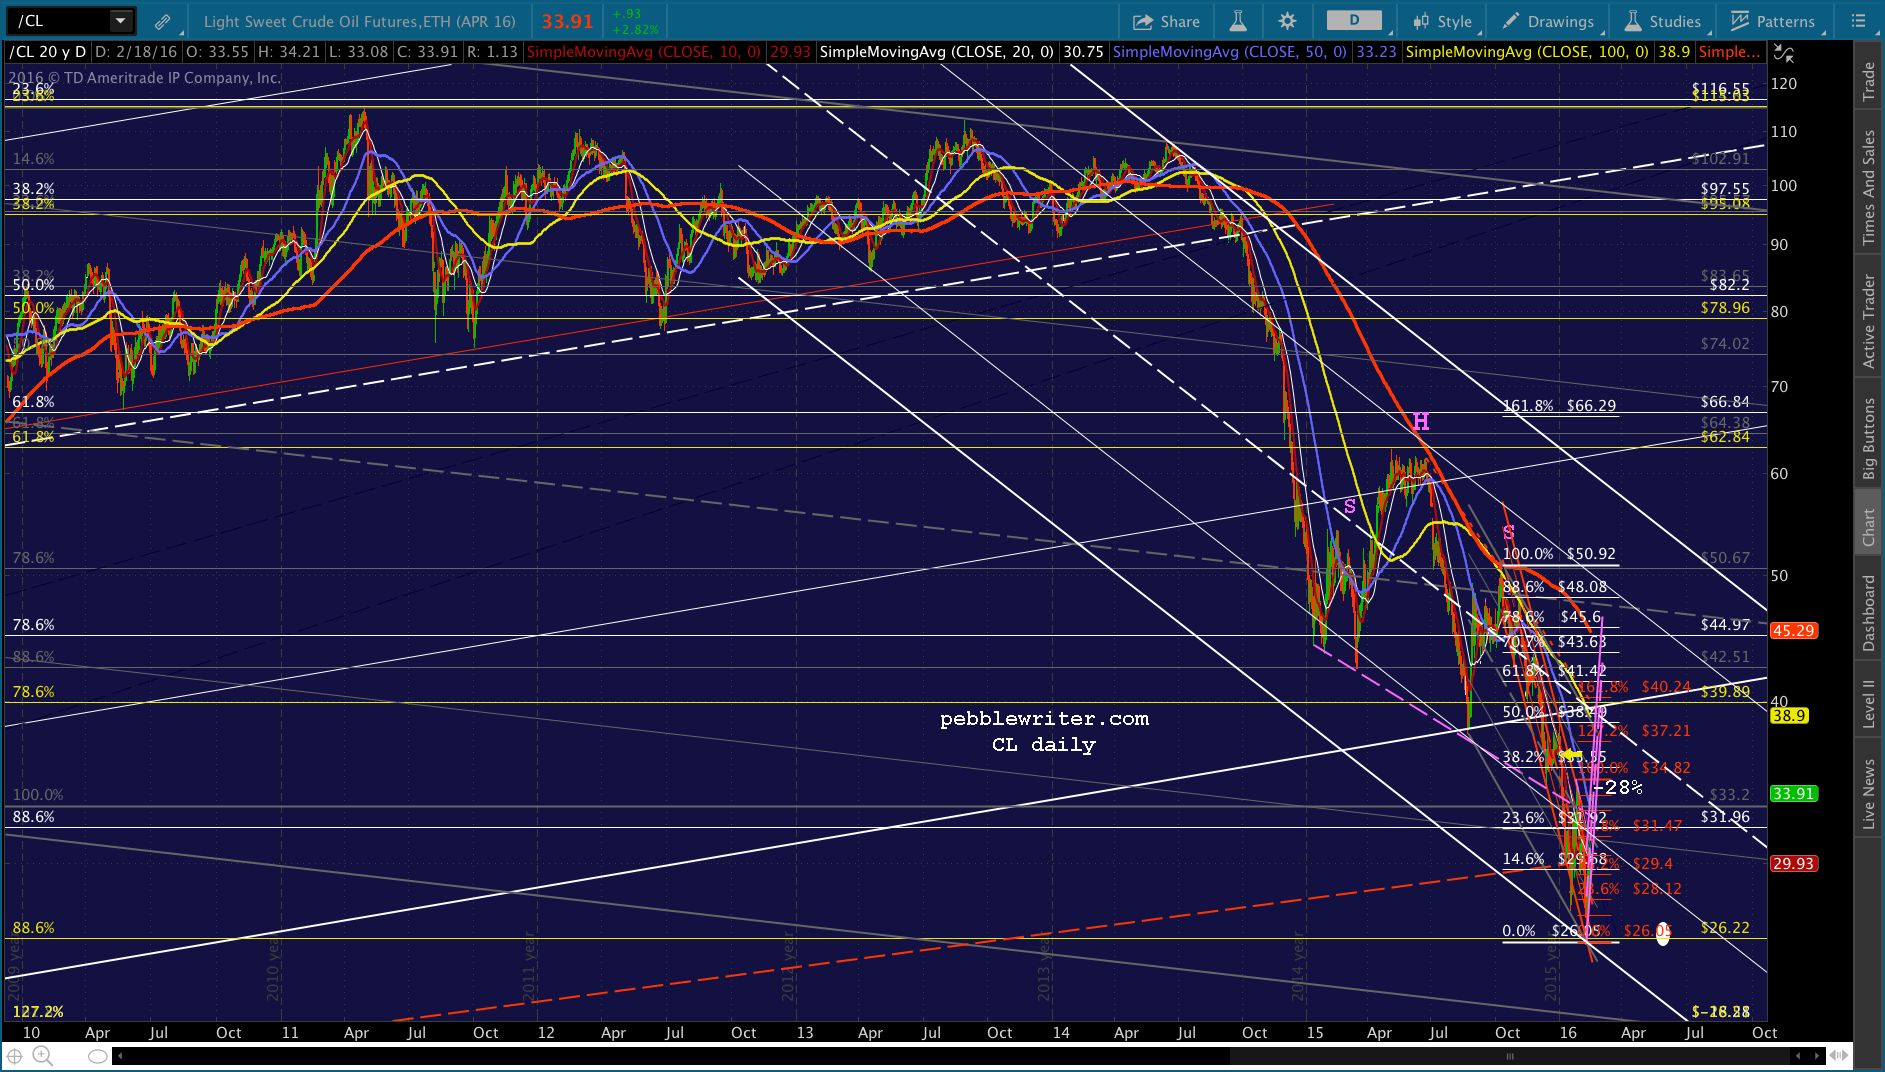
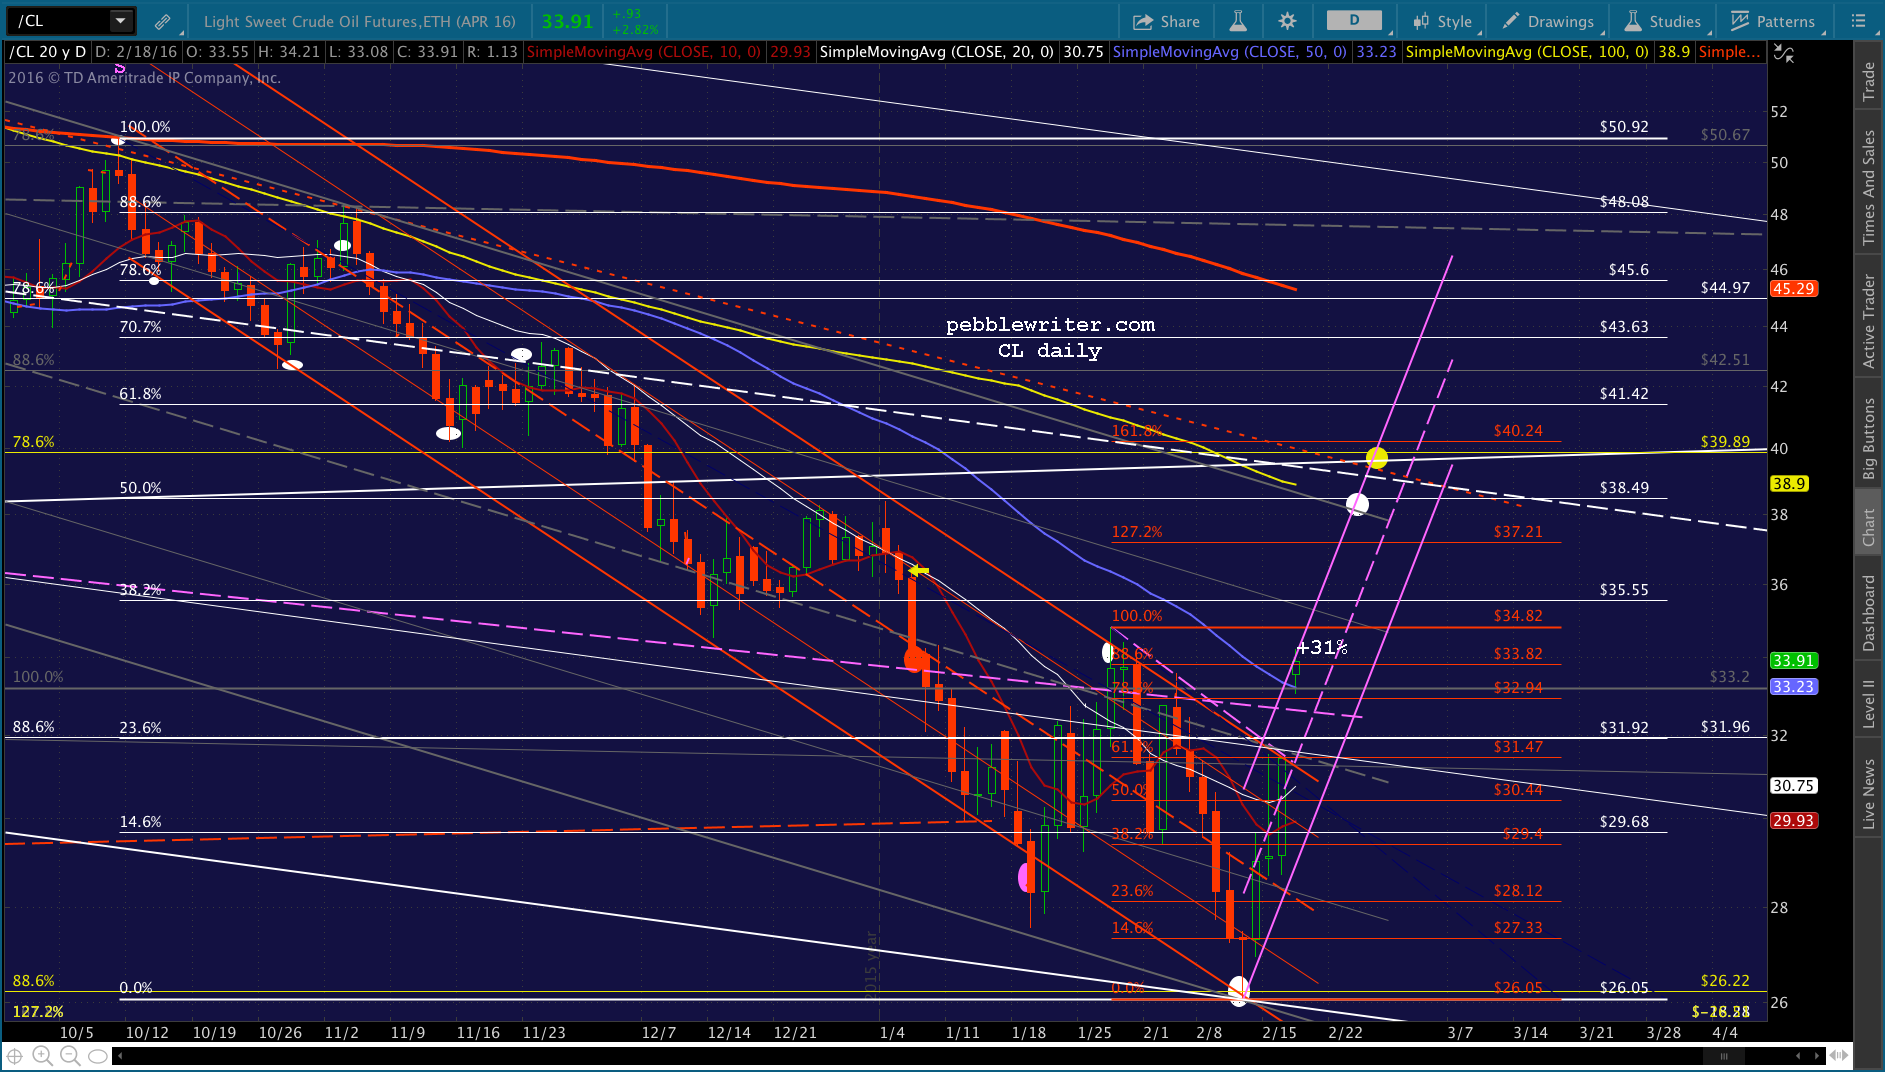
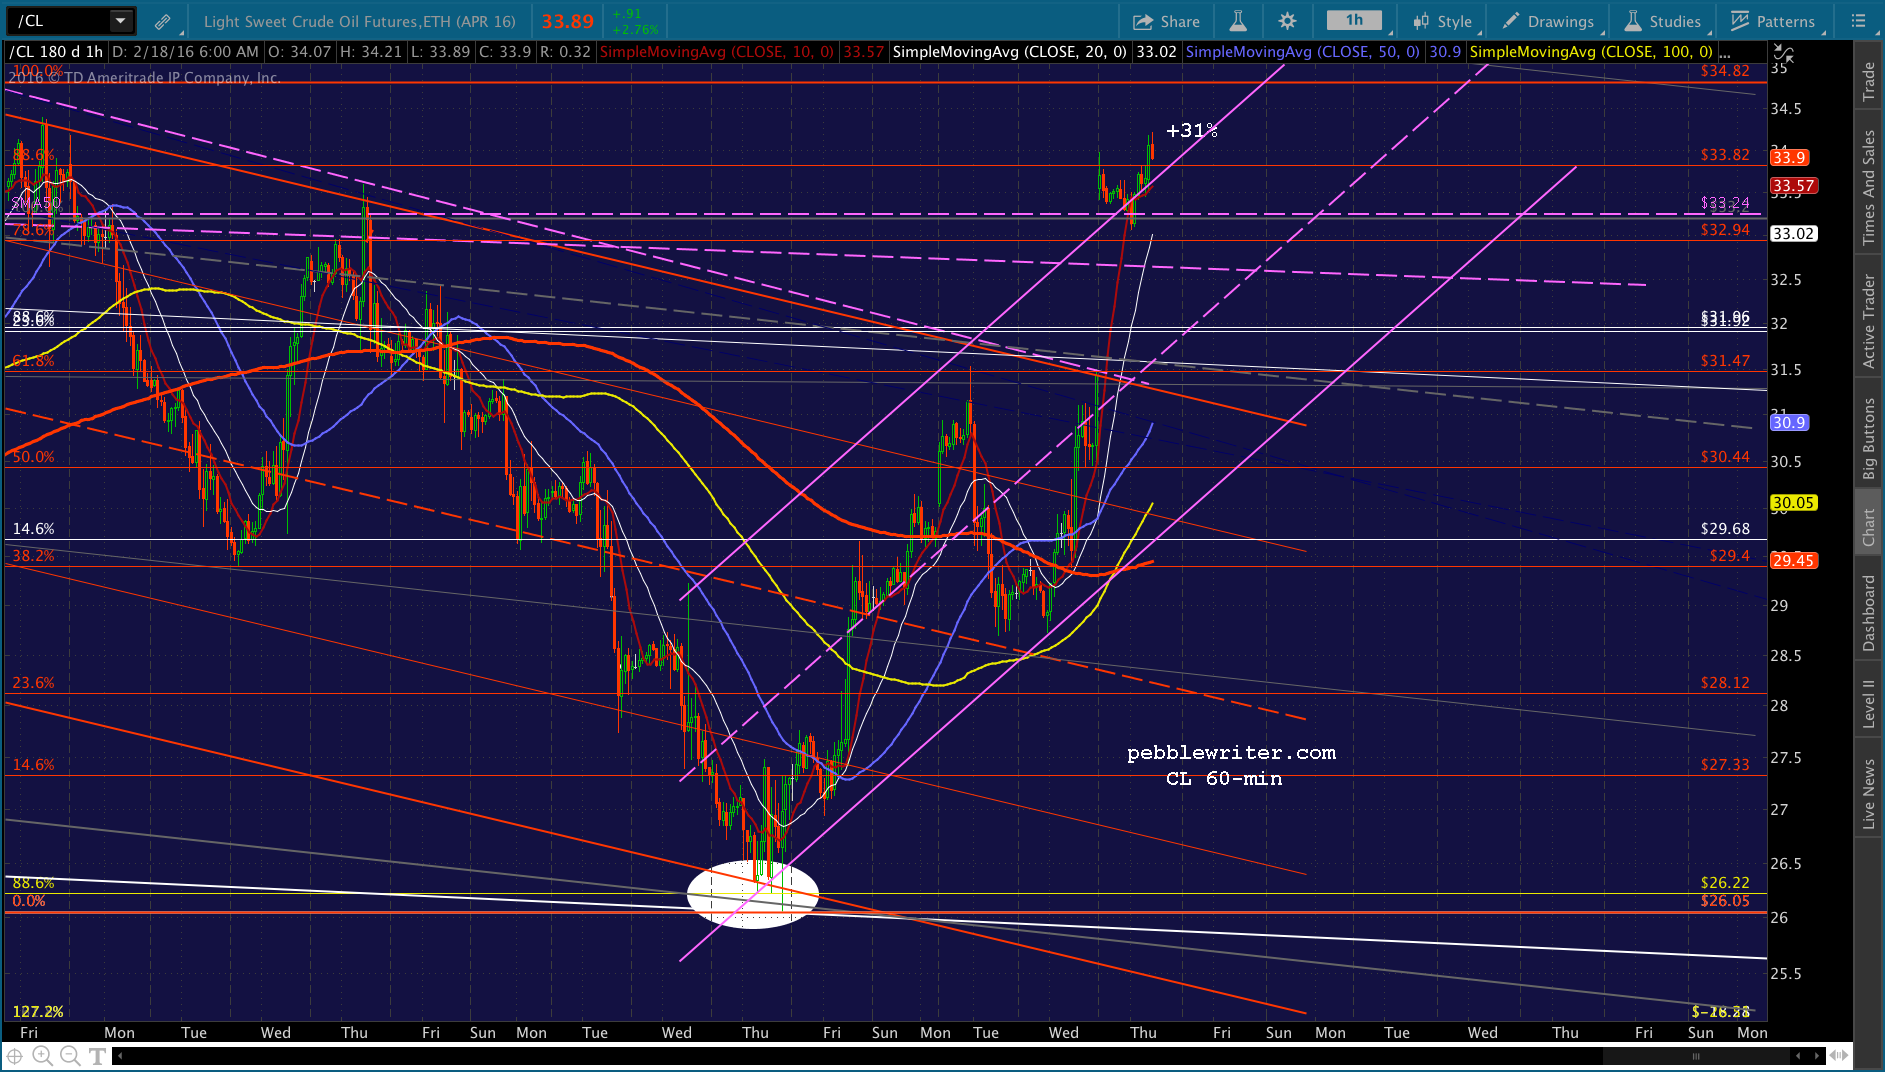
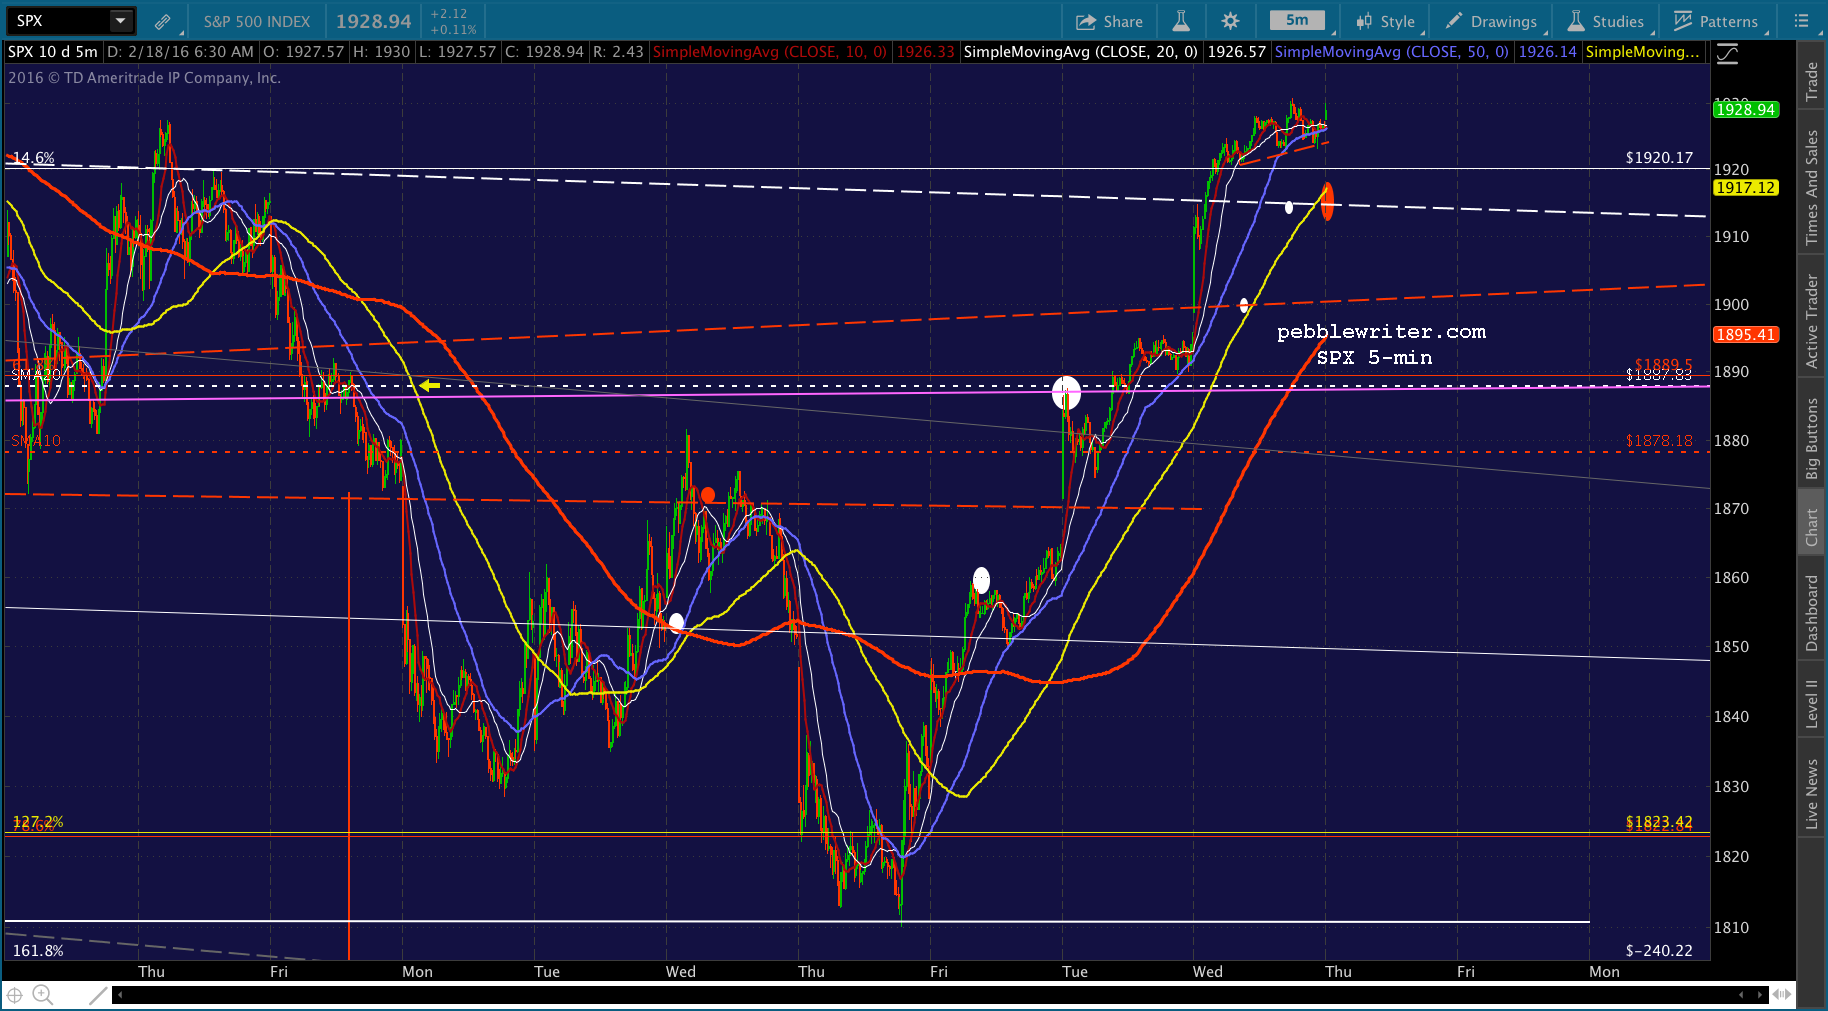
    We’ve written about this channel extensively, as it represents the line in the sand for USDJPY and, more importantly, for global equities [see: The Only Charts That Matter.] Quite simply, a drop through 116.50 means no more upside for stocks.  From Jan 19:2016-01-19 USDJPY daily HSEverything was progressing according to plan when TPTB panicked and booted CL out of its thrice-failed trajectory into the stratosphere.  2016-02-04 CL 60 0600The impact on stocks is perfectly illustrated by NKD, which was only 10 points away from its obvious .618 target when the excitement began.  See if you can spot the moment.2016-02-04 NKD 15 0600CL continues ramping this morning.  How high will they push it?  As high as they need to in order to distract carry trade investors from the USDJPY debacle going on.

    continued for members… (more…)

  • Wait for It…

    I was a bit chagrined when, after posting BoJ Underwhelms last Friday, a 47-pt meltup followed the initial ho-hum reaction.  My point then was that the BoJ had:

    1.  managed to ramp USDJPY directly to overhead resistance; and,
    2.  it wouldn’t matter unless yen carry trade investors believed it would continue higher.

    I’m chagrined no more.  Not only did the pair reverse at that resistance (a major channel midline and the SMA 200), but the subsequent reversal plunged right through the biggest, most important line of support in the most important instrument that affects the “market” — the USDJPY’s 61.8% Fib at 120.11.  It erased over 80% of USDJPY’s post-Kuroda gains, and 88.6% of SPX’s gains.

    2016-02-03 USDJPY 60 0600continued for members… (more…)

  • Letting Us Down Easy

    If yesterday was your idea of fun, you’ll probably love today.  When USDJPY tested the red channel midline and SMA200 after the BoJ’s underwhelming NIRP action, we forecast the next move would be lower.  And, it has been.  Last night, it dropped back below the SMA100, too.

    There are numerous fundamental reasons why this might be the case.  But, since the USDJPY usually trades where the BoJ wants it to, the real reason is because they want to backtest the critical Fib at 120.11 (dashed, yellow line.)  Any potential decline should be defended there.  And, any further advance should be launched by one last backtest.2016-02-02 USDJPY 60 0600The key, for the bulls, is accomplishing the 1.57 decline without too much disruption to the equity markets. Yesterday, it meant an inexplicable rally after the initial sell-off in the opening hour.  Will they permit the rest of the decline today?

    continued for members... (more…)

  • Will it Stick?

    Friday’s runaway meltup was seemingly driven entirely by USDJPY.  On the daily chart, the 47-pt gain seems clearly correlated to the USDJPY rebound (that we had forecast several weeks ago.)

    In reality, the initial USDJPY spike was responsible for only the first 20-25 points.  After that, it was all CL, which moved in tandem with USDJPY as it tried to regain its overnight highs.

    So, what might it mean now that CL and USDJPY both just ran into heavy overhead resistance?2016-02-01 USDJPY v ES 60 0600continued for members… (more…)

  • BoJ Underwhelms

    Ten days ago, we outlined the predicament the market masters were in as a result of the yen’s strength [see: The Only Charts That Matter.]  We maintained, then, that the BoJ needed to get USDJPY back above the bottom of the red channel bottom dating back to 2014 in order to save stocks.

    Last night’s venture into NIRP for a very small portion of Japan’s debt burden managed to get USDJPY up off the channel bottom.  But, gauging from the futures’ lethargic reaction, investors are underwhelmed.2016-01-29 USDJPY v ES dailyNote that the last time Kuroda et al levitated USDJPY, ES rebounded by 161 points, 117 of it in the first 24 hours.  This time — an unimpressive 52 points.

    Yes, USDJPY is back above the critical .618 Fib at 120.11.  But, note that it stopped at the red channel midline, right where we can expect it to reverse.  While TPTB are certain to pile into stocks today to endorse Kuroda’s brilliance, the reality is that we’ve seen this movie before.  And, we didn’t like the ending.

    The reality it that the yen carry trade [what’s this?] is fueled by the prospect of a continually cheapening yen — not one that flip flops about 120.11 for years on end.

    If yen carry trade investors aren’t convinced that the USDJPY is ultimately headed higher, they won’t pile back into stocks.  They’ll play the bounce, for sure.

    But, a sustained rally isn’t in the cards unless Kuroda & Co. do something more dramatic than follow the ECB down the path of failed central planning policies.

    continued for members… (more…)

  • Oil Rumors to the Rescue

    A reminder to our new members…follow @pebbletrades to get updates of intraday position changes.  Subscribers only — you must be approved.  So, if your twitter handle doesn’t clearly identify you, drop me an email to identify yourself.

    *  *  *  *  *

    In the continuing farce saga that is the oil “market” rally, CL has now spiked 23% since Jan 20 — the equivalent of over 3,600 DJIA or 435 SPX points in a little more than a week — all on unconfirmed rumors of a 5% production cutback by OPEC members.

    CL, which is pushing back above the falling white channel midline, should push back above the bottom of the falling purple channel by the time it’s all over.2016-01-28 CL daily CU 0600Needless to say, ES is off yesterday’s lows to the tune of 30 points or so and will at least test, if not push back into, the broken rising white channel.  You can’t make this stuff up, folks.2016-01-28 ES 15 0600Where does this leave SPX?

    continued for members… (more…)

  • Fed Following for Fun and Profit

    If the Fed’s feeling a little sheepish about raising rates and touching off another equity meltdown last month, today’s statement should be oriented toward soothing the “markets.”

    The futures, which were off almost 1% overnight, are currently showing a 5-pt drop. Even oil, which fell apart (after the close, of course) yesterday, has regained much of its losses and has managed to maintain its upward trajectory.2016-01-27 CL 60 0614So, what could go wrong?

    continued for members… (more…)

  • Zen and the Art of Head Fakes

    Trading has been rewarding but challenging over the past few months.  Take yesterday, for example.  SPX tagged our targets pretty much as laid out in the morning:

    Look for SPX to backtest at least the SMA10 at 1899.34.  If that breaks, then the red channel midline at 1896 and the red neckline at 1880 are the next major levels of support.

    SPX fell through 1899 pretty quickly after the open, then dipped to 1895 for the midline tag.  So far, so good.  A small rebound to flesh out the falling purple channel, and it would have nailed our 1880 target around 2pm.  2016-01-26 SPX 5 0600The only hitch — need I even say it? — CL and USDJPY decided to break out above established channel lines at about 12:30.   SPX bounced 14 points, trashing the nice little falling purple channel.2016-01-26 CL 5 0600 2016-01-26 USDJPY 5 0600It worked out fine for us.  We got to participate in the bounce, and made more on our final short as it began at a higher price and dropped further.  Instead of making 20 points on the drop from 1900 to 1880, we were able to rack up 44 points (+2.3% vs SPX -1.52%.)

    But, there were several head fakes along the way as multiple intraday declines suddenly reversed for no obvious reason other than a sudden spurt higher by USDJPY or CL.

    I liken trading in this environment to driving an automobile by staring solely at the dashboard.  Stoplight up ahead?  Hairpin turn?  Remain focused on the speedometer, the tachometer and the temperature gauge.

    The tools that were once interesting indicators of how the market was doing and where it might go are now being utilized to determine its trajectory.  It worked beautifully for the bulls while CL and USDJPY were on the rise.  Lately, not so much.

    continued for members… (more…)

  • Charts I’m Watching: Jan 25, 2016

    After Friday’s algofest, futures are currently off about 8 points.  As usual, we’ll look to USDJPY and CL for clues as to today’s action.  Note that there’s a new CL update out this morning that touches on the big picture.2016-01-25 CL 60 0600continued for members… (more…)

  • Update on Oil: Jan 25, 2016

    In our last update on Jan 6, we noted that USDJPY had reached 34.17 our next downside target, commenting:

    In an unrigged market, it would suggest a possible bounce… But, the noose of USDJPY is still hanging around CL’s neck, and could easily drag it lower.

    USDJPY needed another leg lower to reach our downside target.  So, CL dropped through three additional levels of support, dipping through our 29.61 target before finally getting an unbelievable 18.8% two-day bounce — the equivalent of 3,000 points on the Dow.

    Needless to say, if the Dow had gained 3,000 points in two days, even the MSM would wonder if something fishy was going on.   But, CL’s bounce has attracted no such incredulity.

    Most observers continue to frame its moves in terms of fundamental supply and demand.  But, as we’ve noted countless times, CL has become just another tool by which stocks are manipulated higher via algorithmic trading.  But, there’s the rub.

    continued for members… (more…)