

The short answer: it depends. Ever since 1981 or so, stocks and interest rates have mostly been inversely correlated — which makes sense. There are a number of obvious ways lower rates should benefit equities.
For instance, lower interest rates mean cheap leverage, which can amplify corporate earnings and thus increase stock prices. They are also thought to divert some would-be bond investors to potentially higher-return alternatives such as stocks. And, they can benefit the general economy by reducing consumers’ interest expense, resulting in greater disposable income.
Rate declines instigated by the Fed as it attempts to stimulate the economy through quantitative easing are considered positive for stock prices. But, lower rates can also reflect increased fear in the markets — a sign that investors are pulling money from stocks and piling into bonds.
Looking at the chart below, we can see that many sharp declines in TNX (10-yr treasury yields) accompanied strong rallies in SPX (S&P 500), particularly between 1981 and 1998. But, two other sharp interest rate declines, from 1999-2003 and 2007-2008, preceded significant market crashes. Note that the two worst crashes as well as a number of significant corrections occurred when TNX dropped below trend — either the red trend line connecting the 1986, 1993 and 1998 lows or the resulting falling red channel bottom.
So, what does it mean that TNX has recently plunged below the channel bottom while stocks are on the rise — a divergence of the type that accompanied past corrections? It’s an important question, as other patterns are arising that smack of the calm before the storm.
I’ll be posting throughout this week about a new analog [what’s this?] that, while in its early stages, could portend a significant move in the markets.
continued for members…
In this close-up of TNX v SPX, I’ve eliminated many of the other chart features in order to emphasize the falling channel above (changed the color to yellow to make it easier to see.) Notice how the declines through the yellow channel bottom (yellow arrows) were universally negative for stocks. While, the rises back above the channel bottom (white arrows) produced gains.
The most fascinating feature of this chart, however, is how the last two major drops in TNX accompanied gains in SPX. The first, from Dec 2013 to Jan 2015, was the result of a big breakout in USDJPY — the yen carry trade that I’ve detailed in countless other posts.
The second, from June 2015 to July 2016, had produced a 14%+ loss in SPX through Feb 11, at which point CL began its meteoric rise, doubling over the next four months and goosing the algos in a way that erased all those losses.
In other words, big losses were averted by the use of gimmicks that offset what should have been bearish developments in the bond market. Indeed, flow of funds reports have verified that money has been flowing out of stock mutual funds during SPX’s entire rise from the Feb 11 lows.
The last thing I’d like to point out is the Brexit vote, which sent TNX tumbling almost as fast and far as the January 2016 decline, resulting in new lows for TNX. Yet, it produced a mere 23 point decline in SPX — despite the fact that it busted SPX’s rising white channel from Feb 2016.  The gimmick this time, of course, was the biggest, fastest VIX smackdown in years — perhaps ever.
 Not surprisingly, VIX continues to be quite effective in driving the algo action — even as USDJPY and especially CL continue to offer little help. I expect USDJPY to bounce at 101.618 and CL at its SMA200. So, VIX needn’t keep the rally alive all by itself. But, know that SPX’s divergence with SPX won’t last. Hence, the analog I’m working on.
Stay tuned.
* * * * *
ES gave up big overnight gains, and looks likely to backtest the white channel it broke out of on Friday. 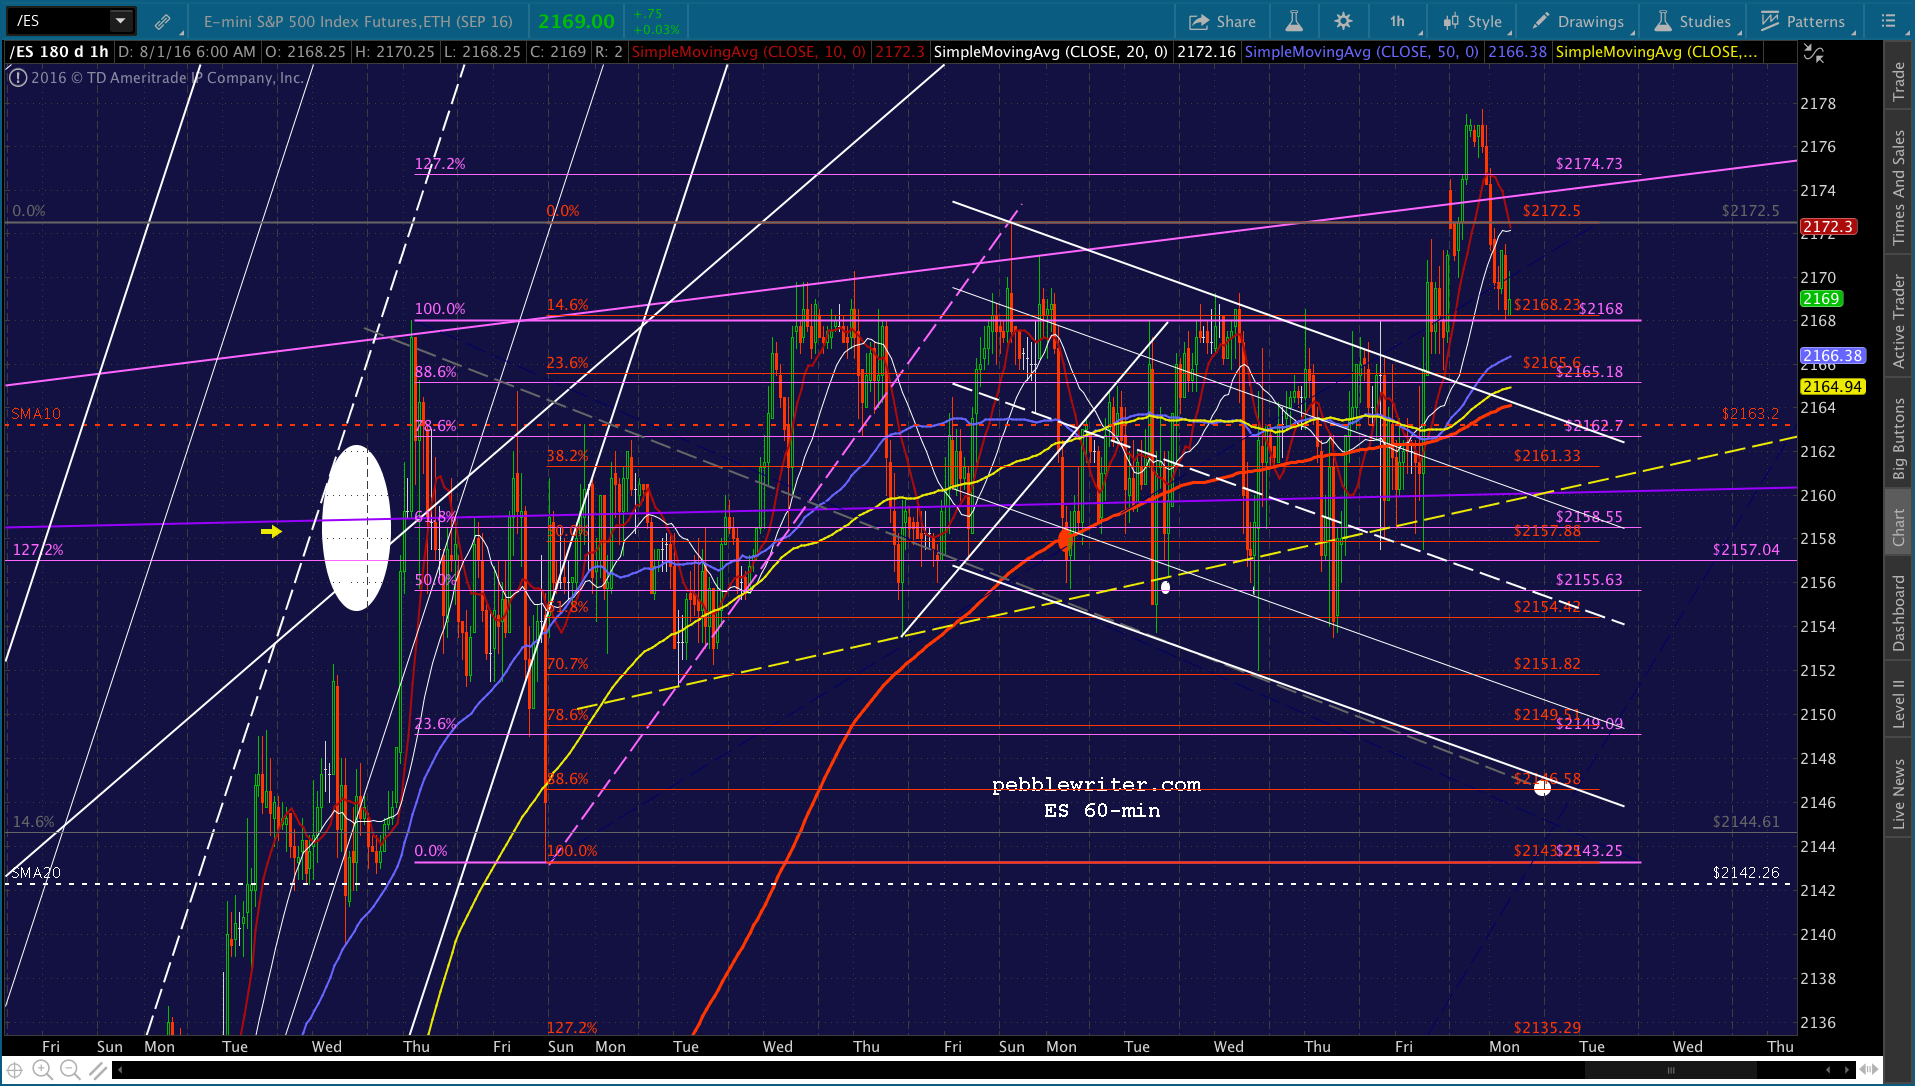 The initial target is 2164, which translates into a 2168-2169 downside for SPX. If the white channel top doesn’t hold, we might finally get some push toward a backtest of the 1.618 Fib extension at 2138.
 As usual, much of it will depend on USDJPY, which is contemplating the rest of the move to our 101.618 target seen below…
 …and, CL, which is currently pushing below its SMA200.
 UPDATE: 9:42 AM
SPX just reached 2168.48, just below the white channel top but a tag of the SMA5 200. I’d be inclined to switch to long here for a rebound. But, note that it didn’t quite reach the red TL off Thursday and Friday’s lows. I’d be cautious regarding a long position, as there could be another leg lower to 2167.66 or so. Of course, if the red TL breaks down, there are bigger losses to come.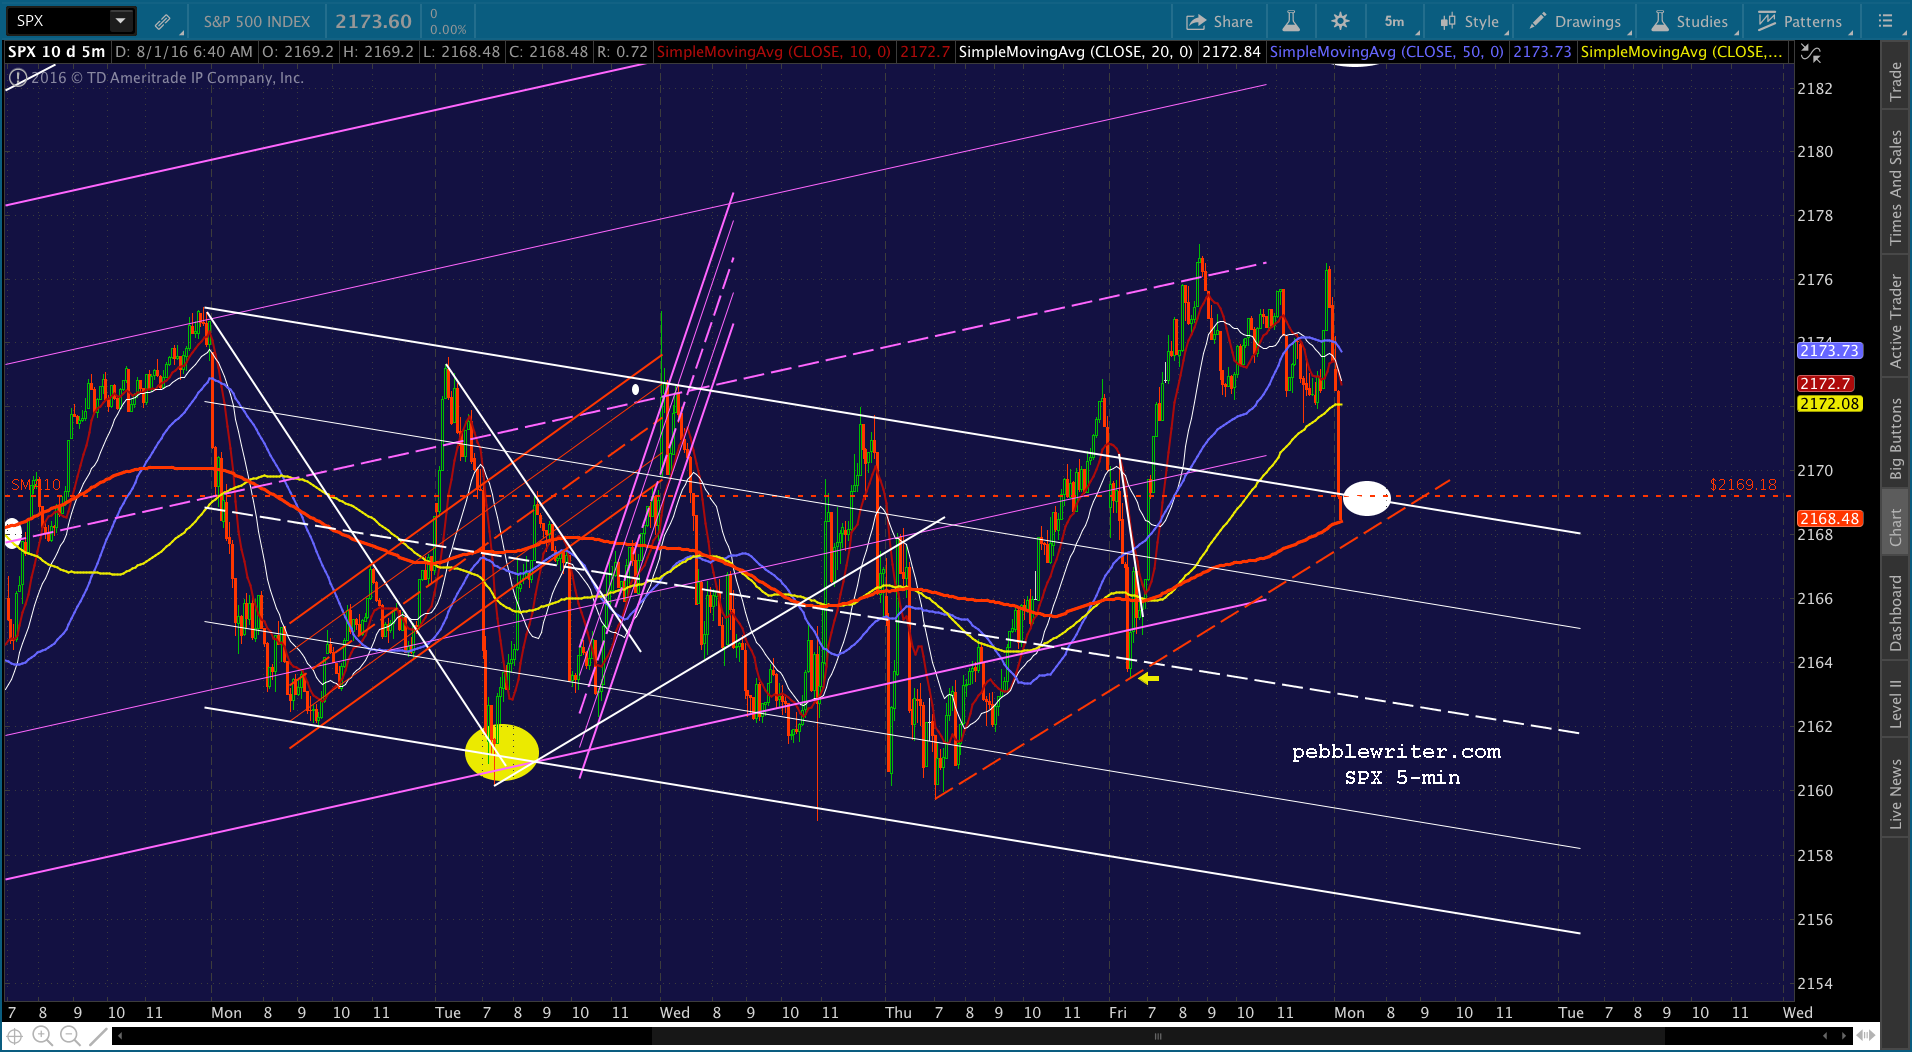 Keep an eye on CL, which hasn’t rebounded above its SMA200, and USDJPY, which has also not broken out — a sign that they support at least a lower low.
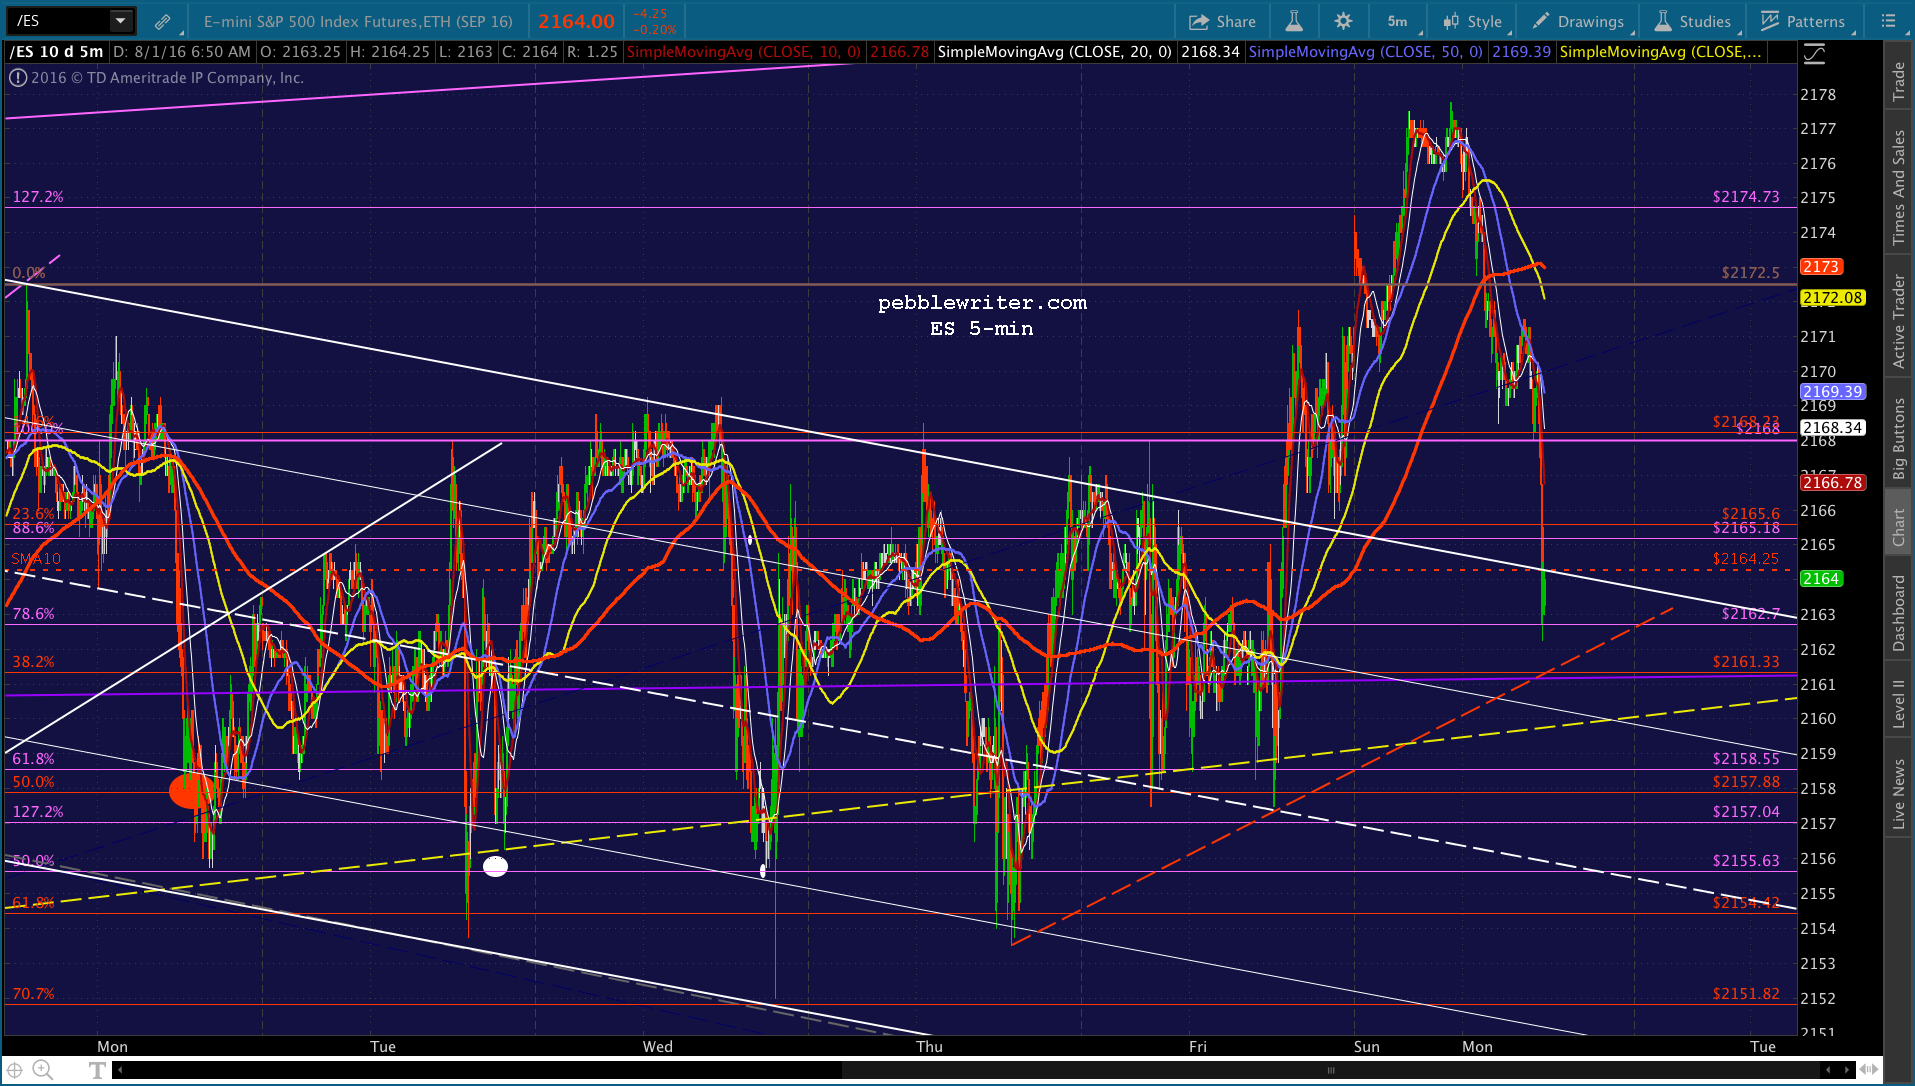
 ES also seems to have been left a little short in its initial decline.
  UPDATE: 10:10 AM
If we’re going to get another leg down, it should start from here. VIX has reached its SMA10, CL is putting in an impressive head fake, and USDJPY is pushing up against the white channel bottom. Note that the red channel bottom is now at 2168.25 — so, it might not amount to much — if it happens.
VIX has been extraordinarily active in pushing stocks around, lately. So, I’ve been paying more attention than usual — especially with USDJPY and CL being so weak.
 UPDATE: 10:17 AM
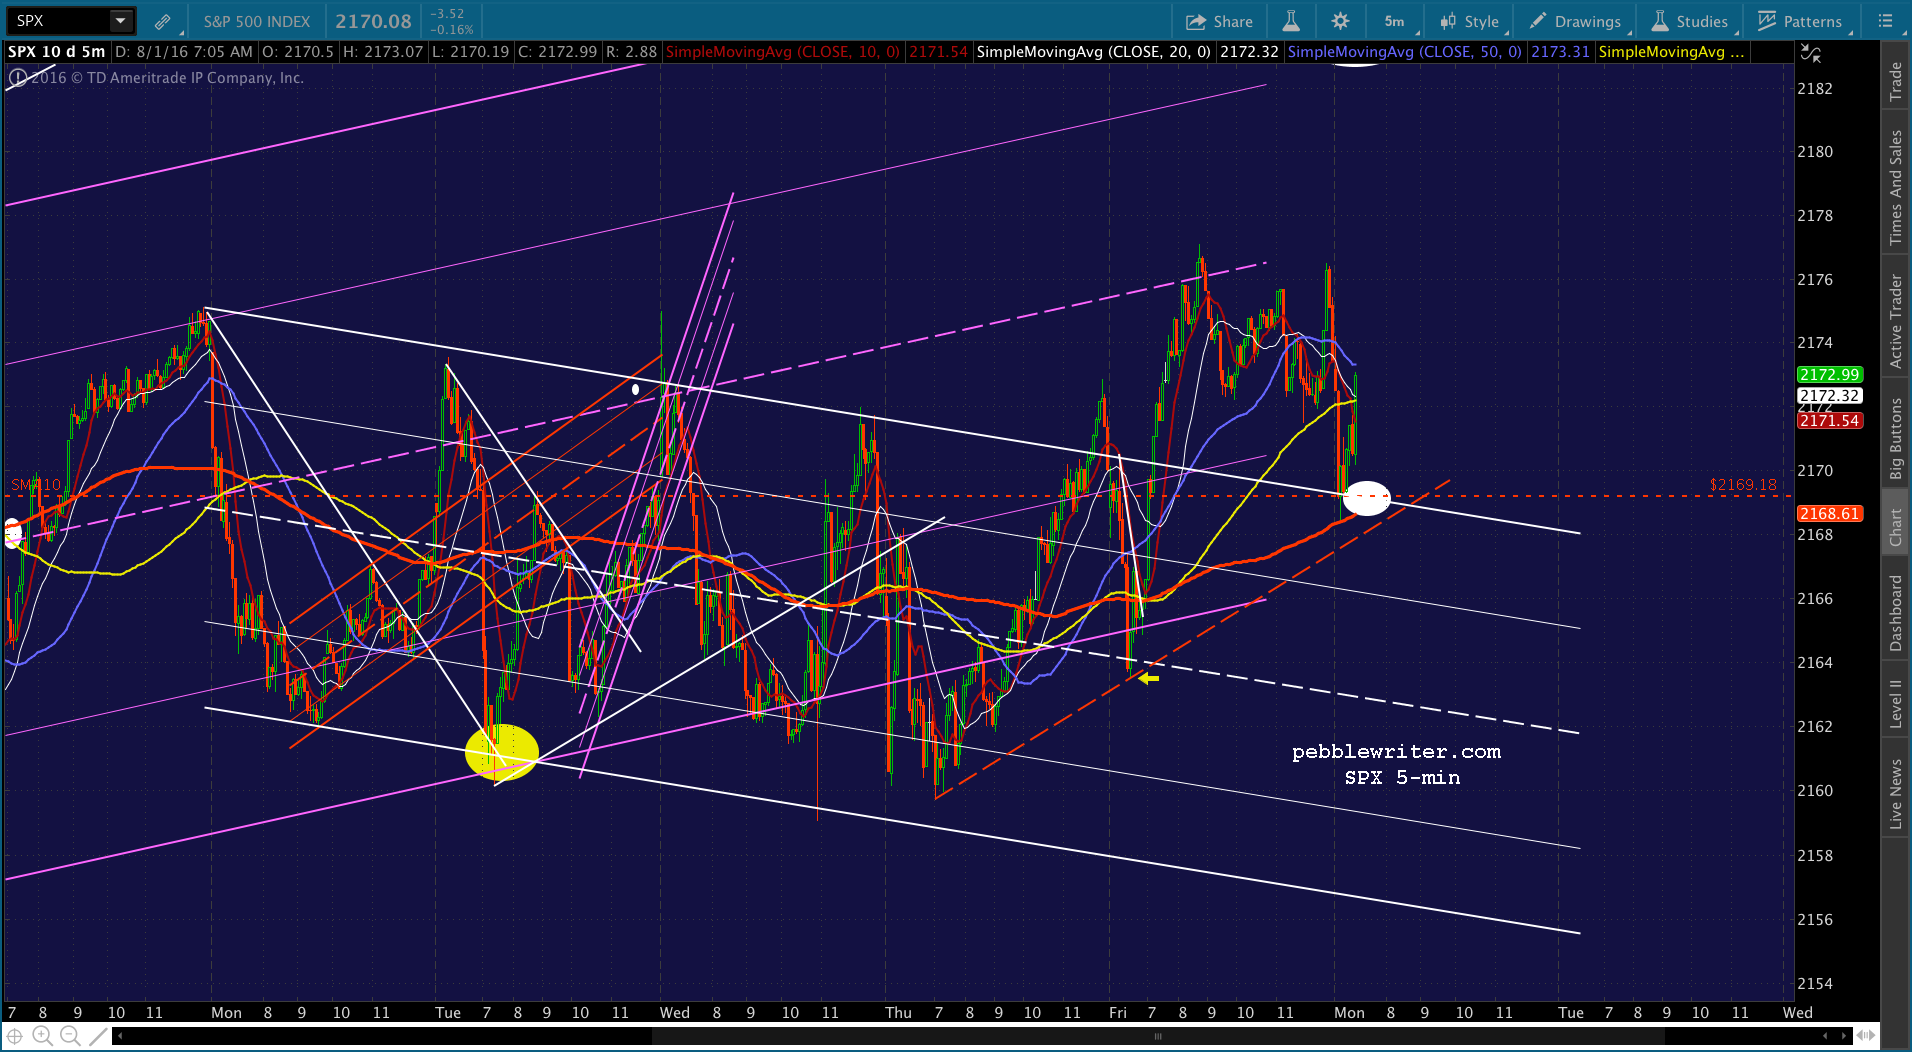
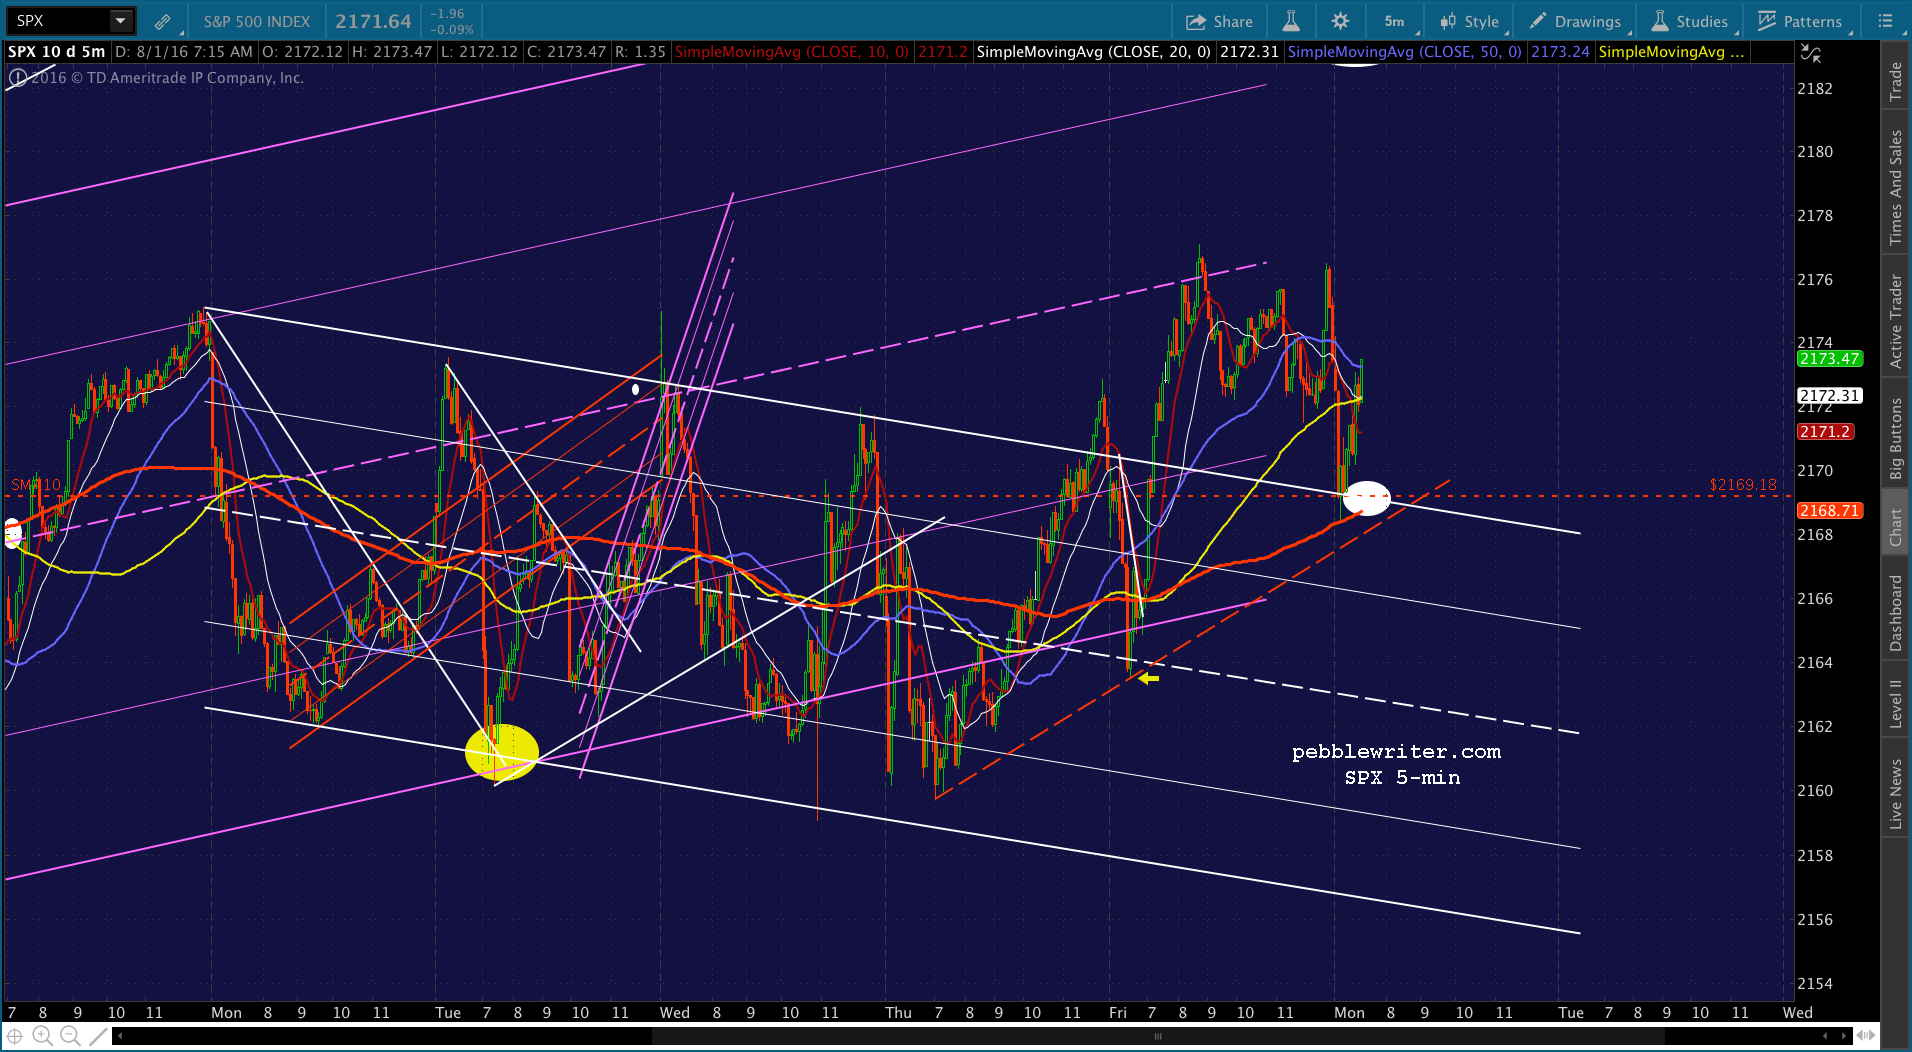
VIX just got crushed below its SMA10, which sent SPX popping up above its SMA5 50. Hard to say if this breakout will last, but VIX has ruled lately, and CL is also easing above its SMA200. Watch your stops. My hunch is that this is an exercise to tag the red TL without producing new lows, or at least lows that are very much lower than those seen just after the open. In other words, choppy sideways and then a swift decline to 2169 or so in the next hour.
 UPDATE: 11:08 AM
Stopped out on the short, thinking we’ll probably see VIX close its gap from this morning (12.05) producing new highs for SPX. I’d go long on any breakout above the white TL at 2176.19, but we have overhead resistance not much higher at 2178-2179. So, best to remain in cash until it plays out.
 UPDATE: 11:16 AM
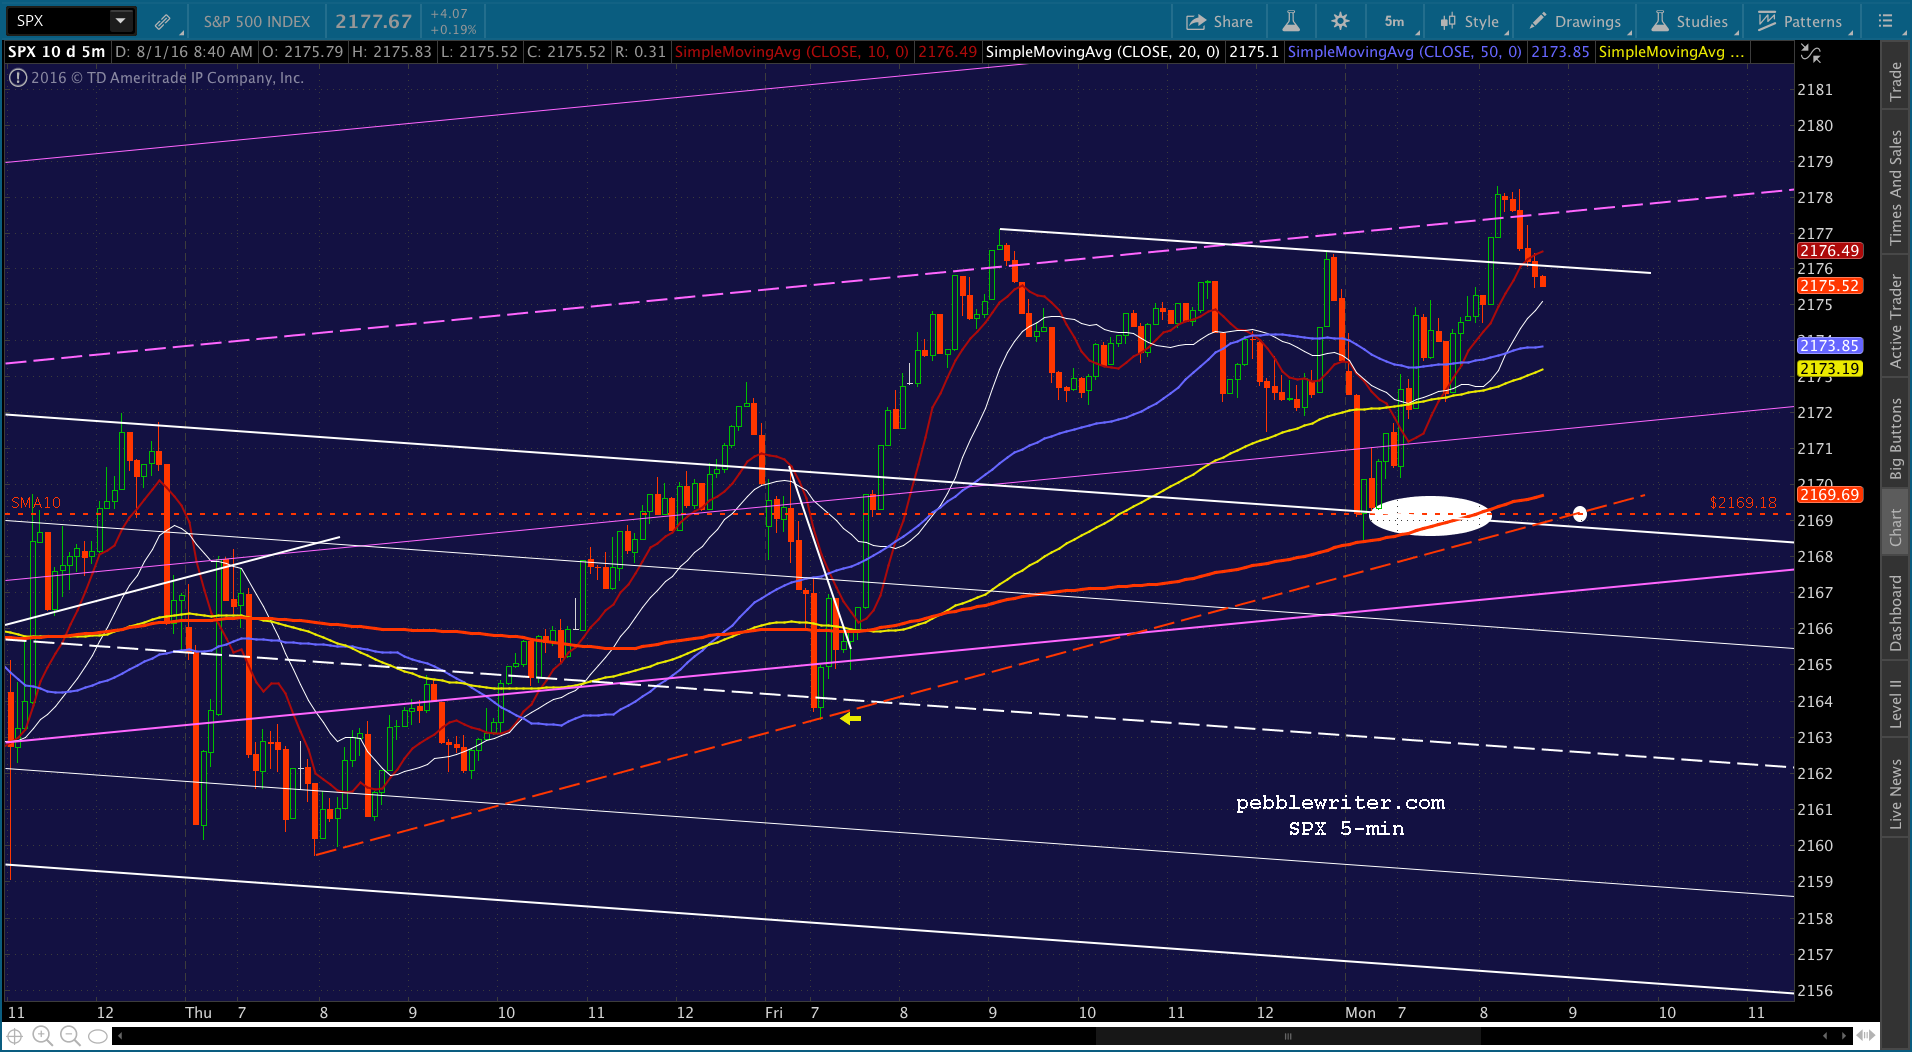
ES has reached its SMA5 200, which should see a reversal here. Back to short, but keeping a close eye on VIX, which hasn’t yet closed the gap, and NKD, which looks like it might have its SMA5 200 at 16549 in mind. Watch your stops. Should VIX decline below 12.05, I’d probably want to dump the short.
Note that at this point, SPX could drop down to tag the red TL without dipping below the white channel top. Depending on how long it took, it could even do so without dipping back below the SMA10 at 2169.18.

 UPDATE: 11:42 AM
Quick update as SPX’s SMA5 20 approaches for potential support. Note that CL has broken down, and USDJPY is even looking weak. VIX bounced off the gap close and is contemplating a push above the white midline. If it can do so, we should get that second dip to the SMA10 shortly after noon ET. If VIX reverses here instead, look for SPX’s SMA5 20 to carry it higher.


 UPDATE: 12:12 PM
SPX just reached its downside target as VIX tagged the top of its white channel and ES tagged its TL. We’ll look to see if it stops here, or tags the purple channel bottom again.
 UPDATE: 12:17 PM
Purple channel bottom, reached as USDJPY’s breakdown. I’d take profits here and see if we can’t get a bounce as occurred all last week.

 UPDATE: 12:21 PM
VIX breaking out, USDJPY breaking down, SPX has more to go? Back to short if it pushes through 2166.67.

 Note that ES is back to the neckline of a H&S Pattern that has been busted over and over again. Important support that, if broken, should mean a nice drop.
 The keys for a nice V-shaped recovery: ES bounces at the yellow neckline, USDJPY gets back above the red TL, VIX reverses at or around its SMA5 200 at 12.62, CL gets a bounce at the falling white channel top at 39.85ish.
If those things can’t happen, SPX will simply bounce up to the SMA10 where it will begin another leg down.
UPDATE: 1:17 PM
SPX pushed up to the red channel bottom as ES reached its SMA10. And, VIX is backtesting the broken white channel top. In other words, it could break out or break down here. I’d tighten up stops and watch for any breakdown in ES.
 UPDATE: 1:46 PM
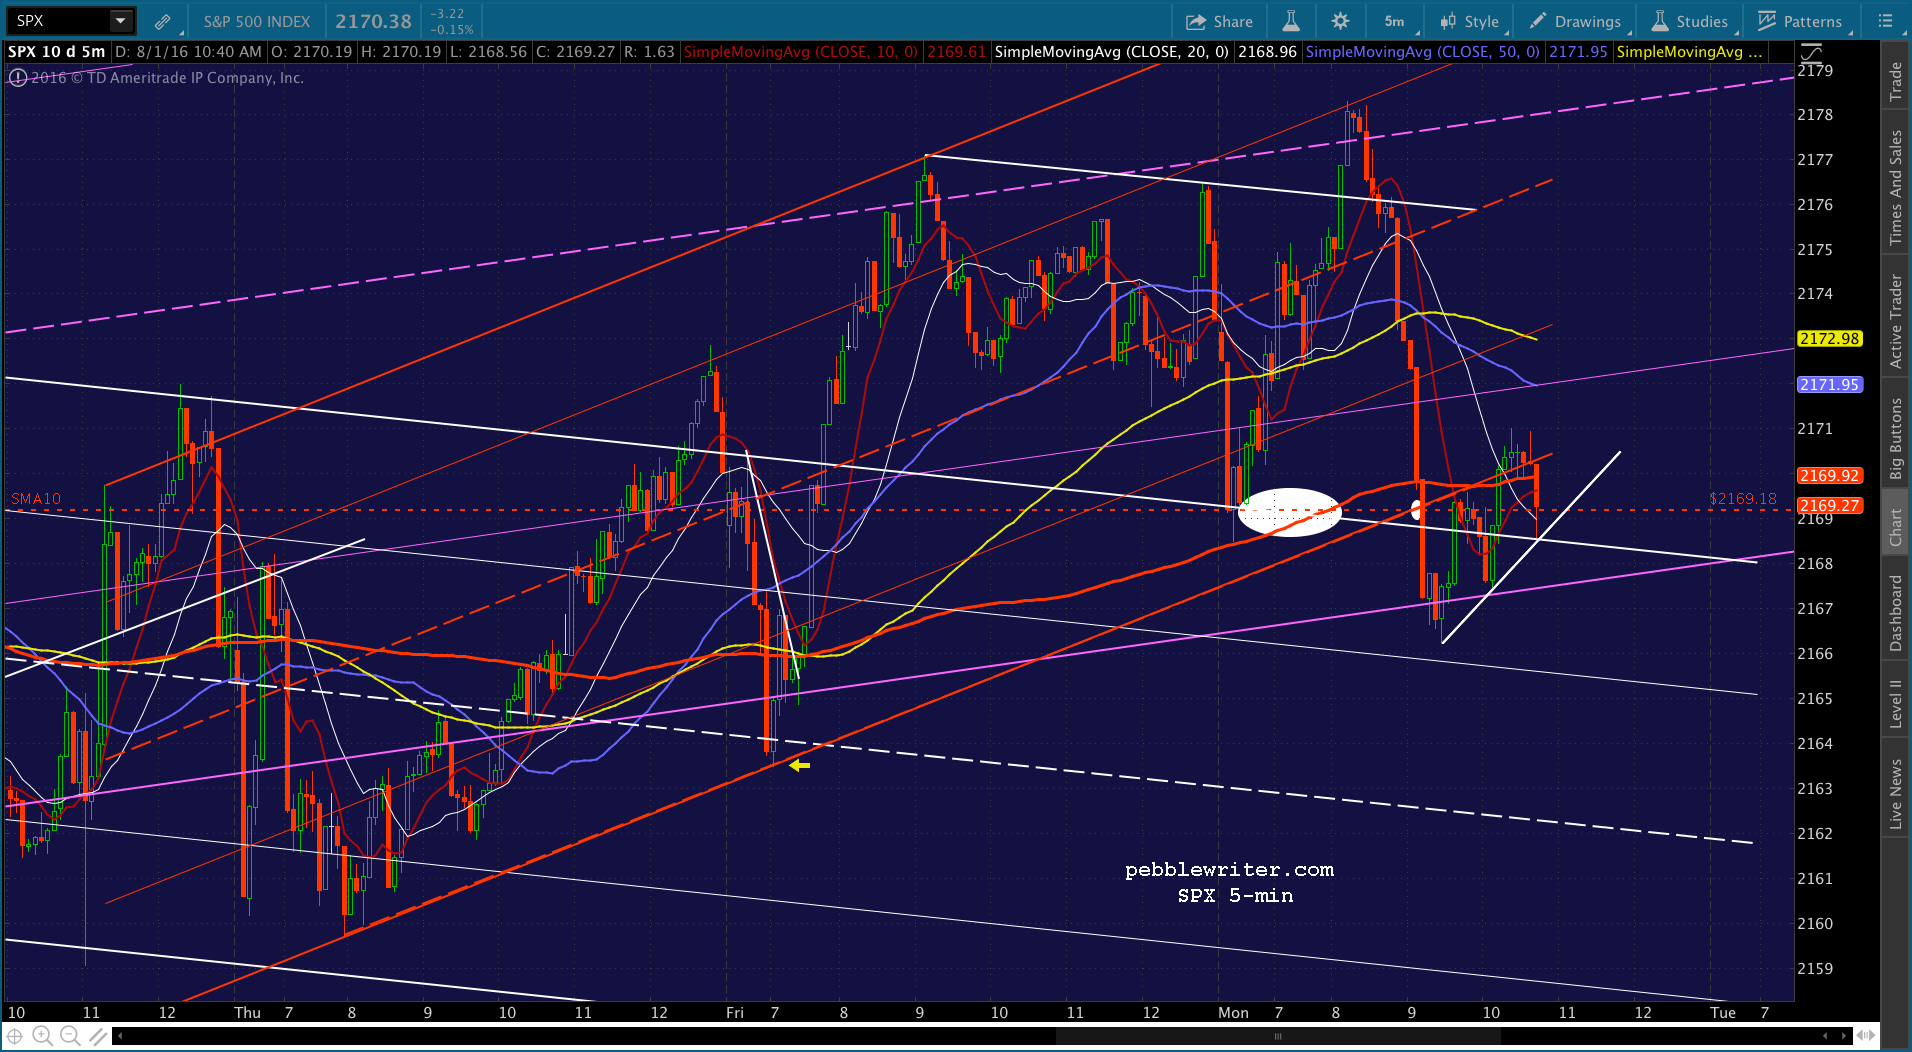
Looking pretty wobbly here. VIX seems very interested in popping up to at least the red TL. And, ES was clearly rejected at its SMA10. I believe I’d go to cash and see what develops.
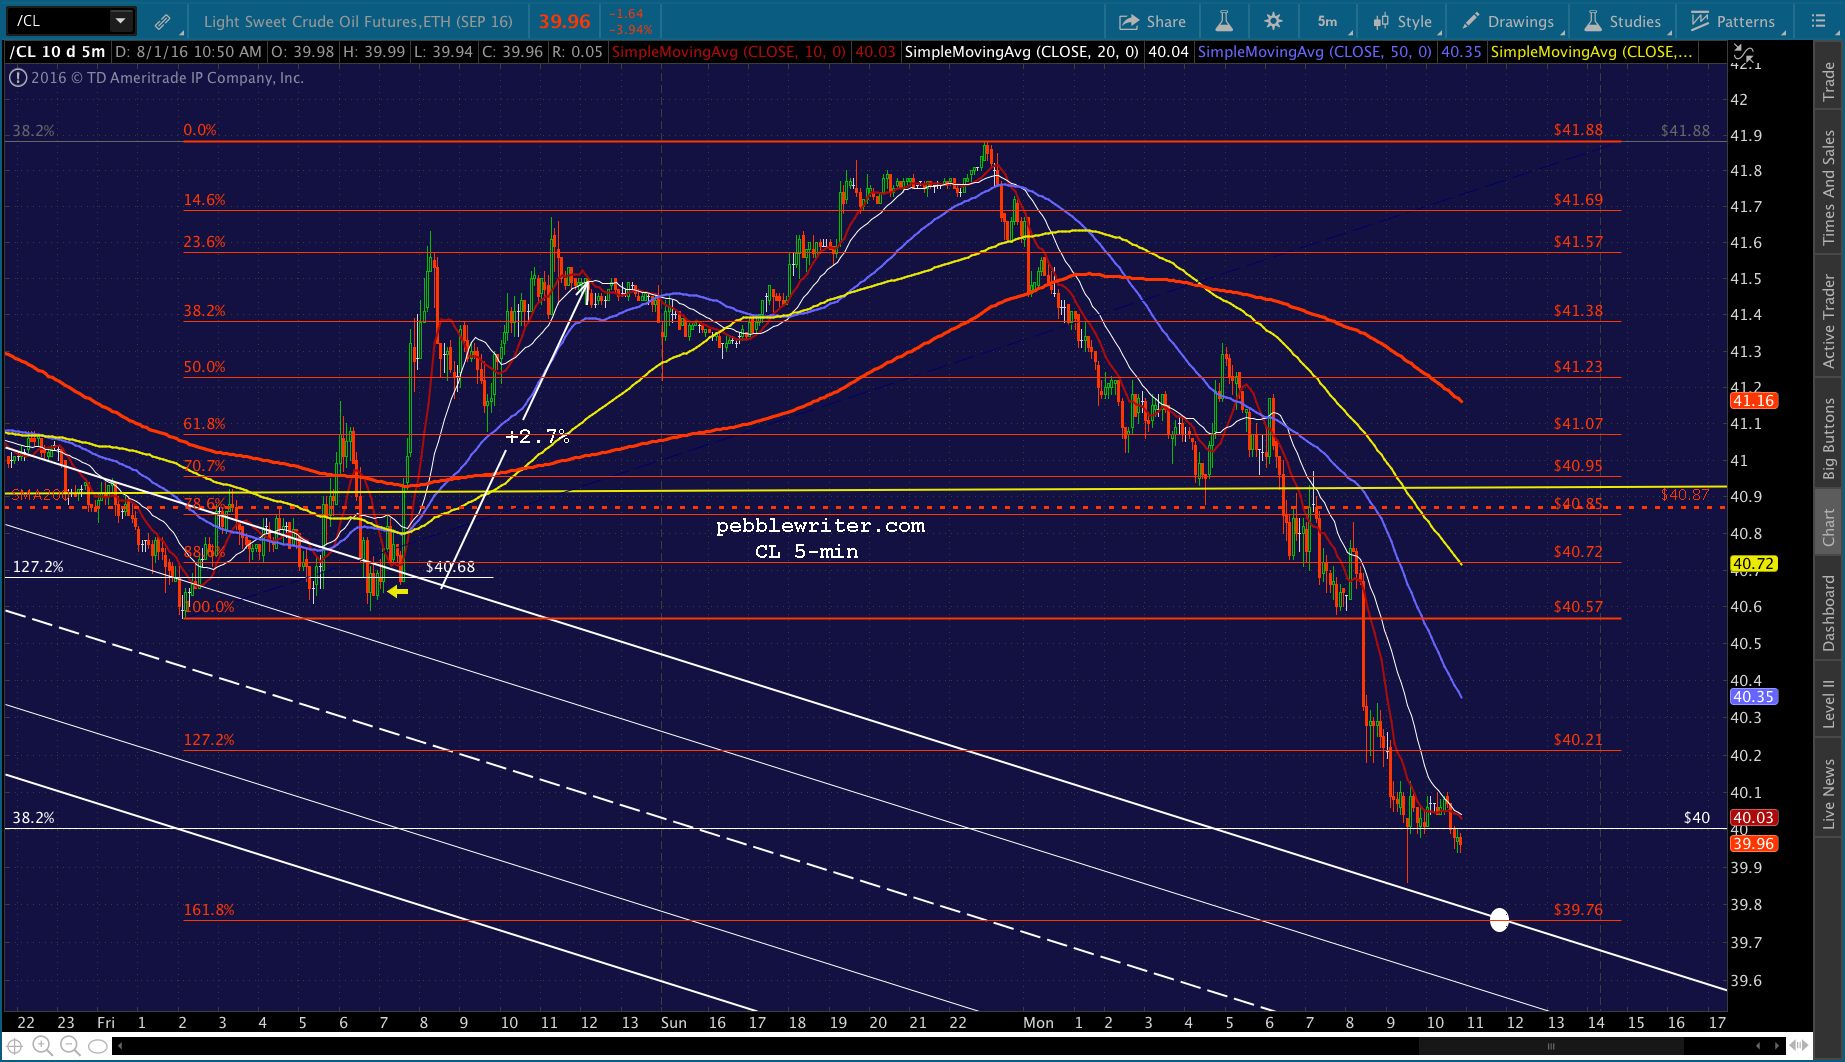
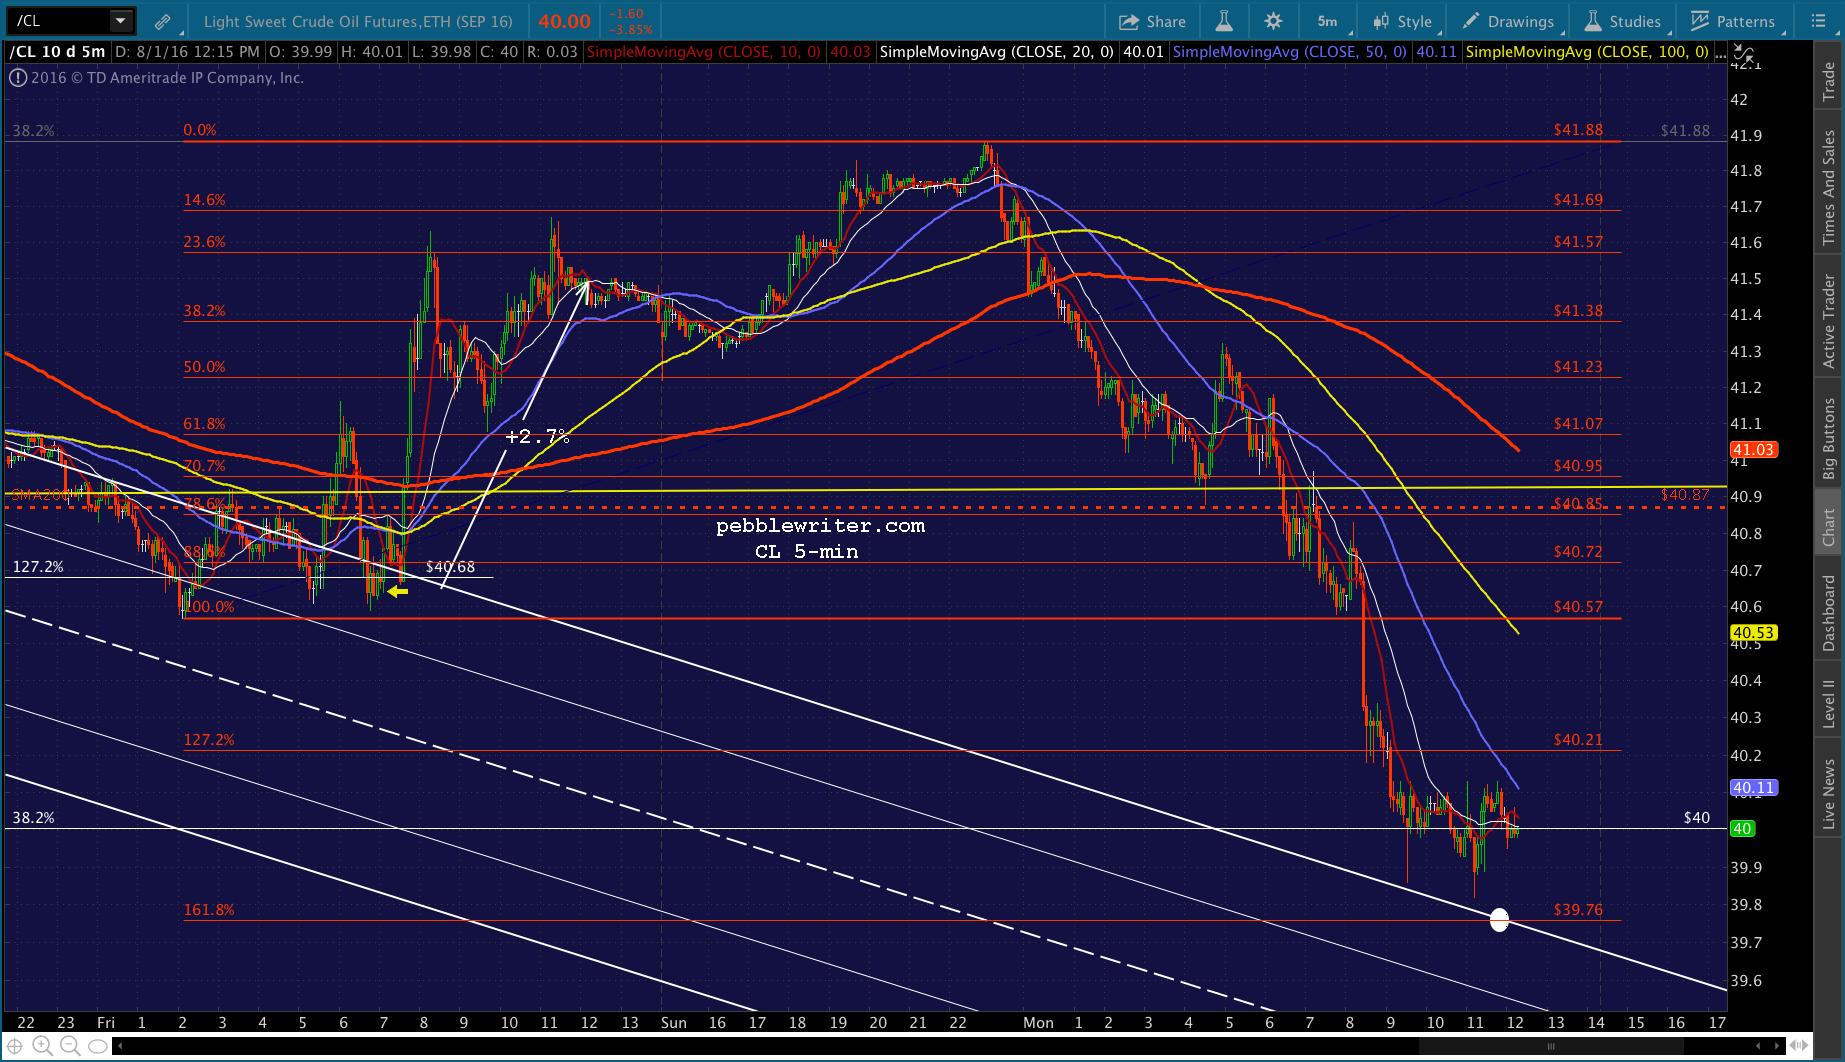
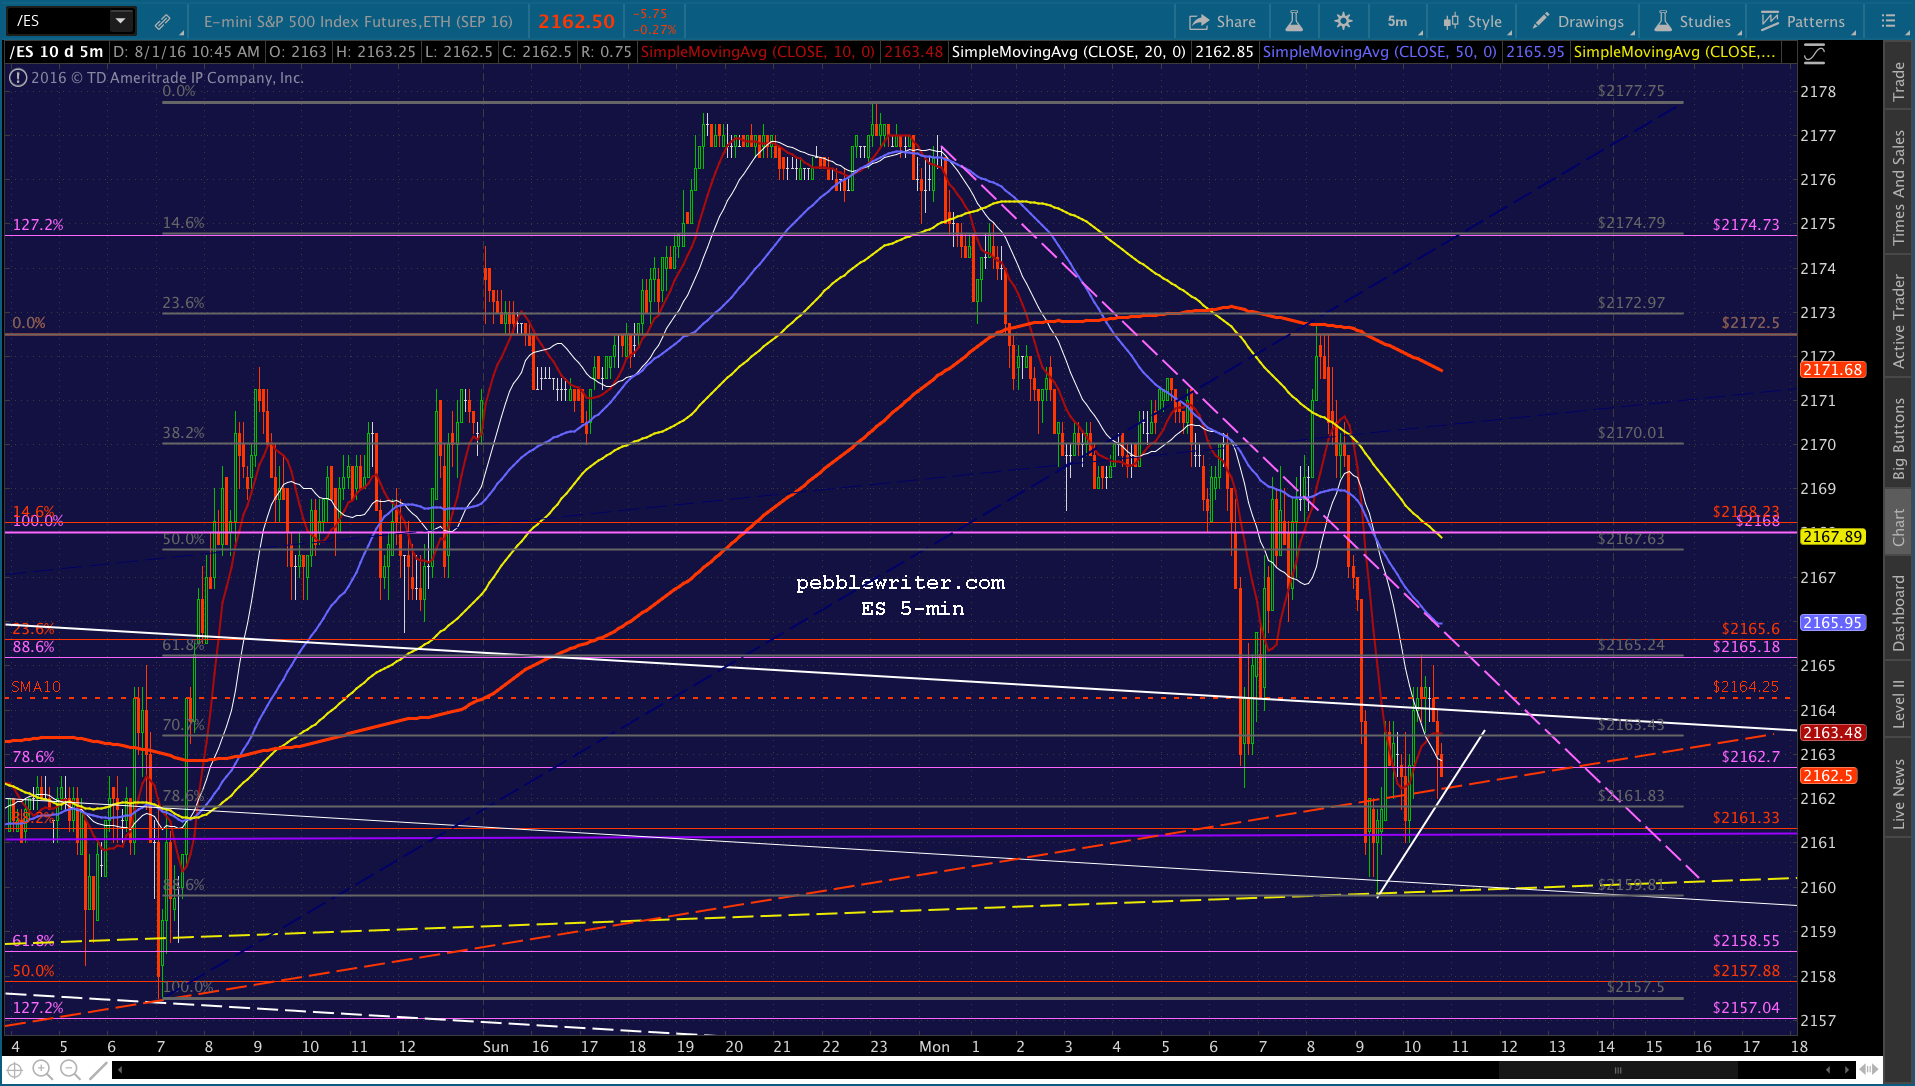 CL seems like it’s aiming for the 1.618 extension at 39.76.
 UPDATE: 1:58 PM
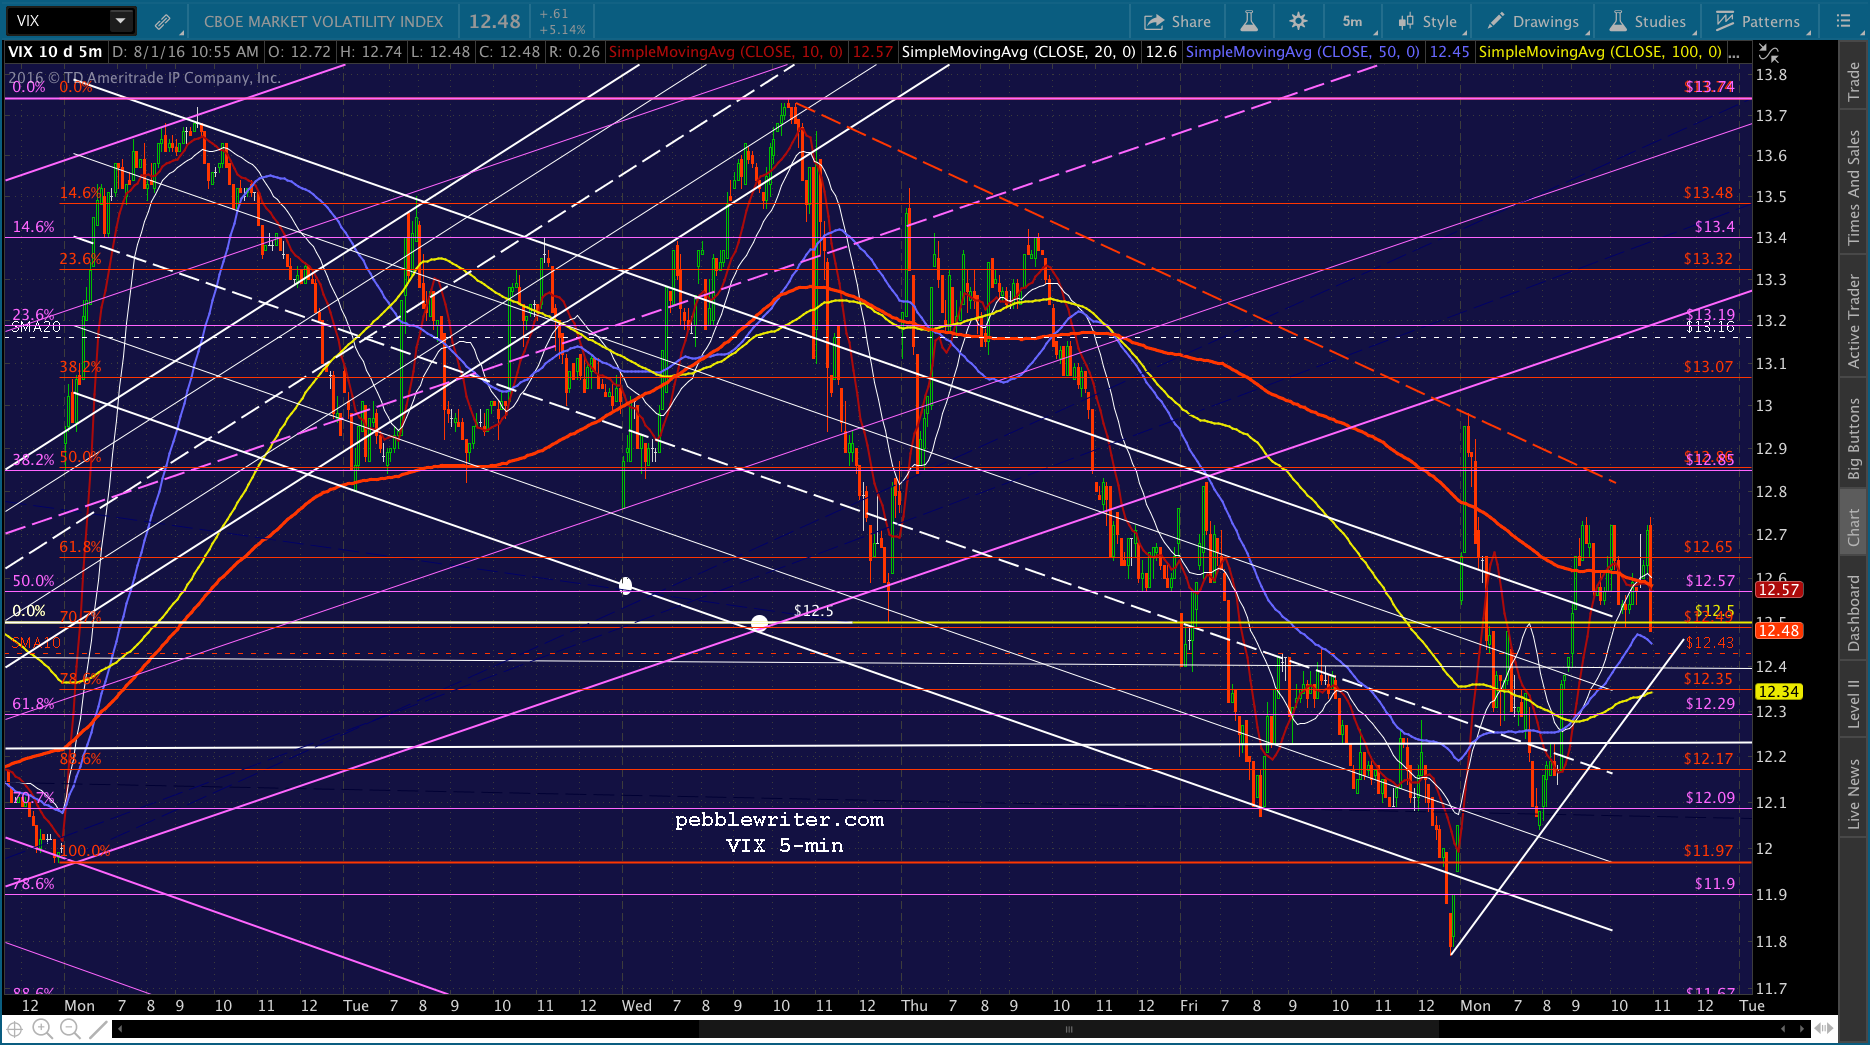
VIX smackdown going full force. Back to long.
 UPDATE: 2:09 PM
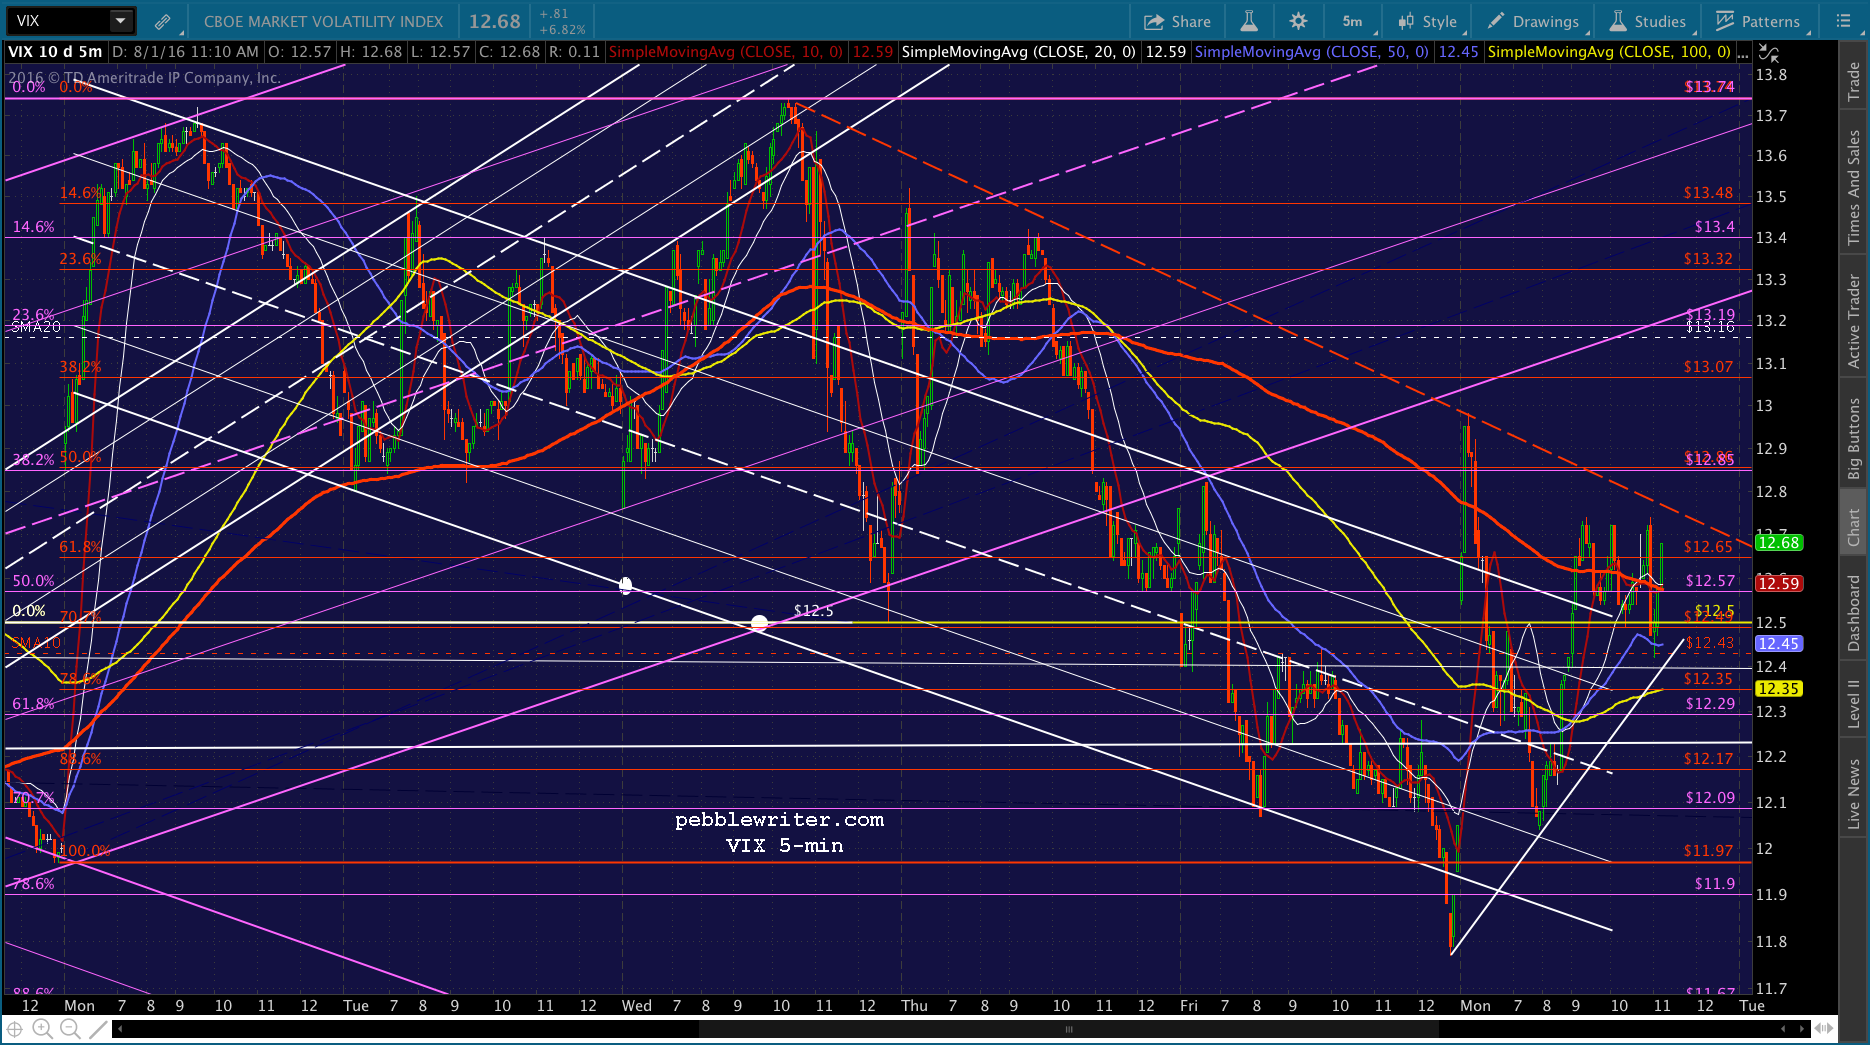
And, there it goes again. This is getting downright silly, as SPX has become hypersensitive to VIX, which is all over the map. I’d revert to cash here and find a nice comfortable place on the sidelines if it dips back below the white TL and/or SMA10. I’m going to take a short break — will be back soon. 
 UPDATE: 3:15 PM
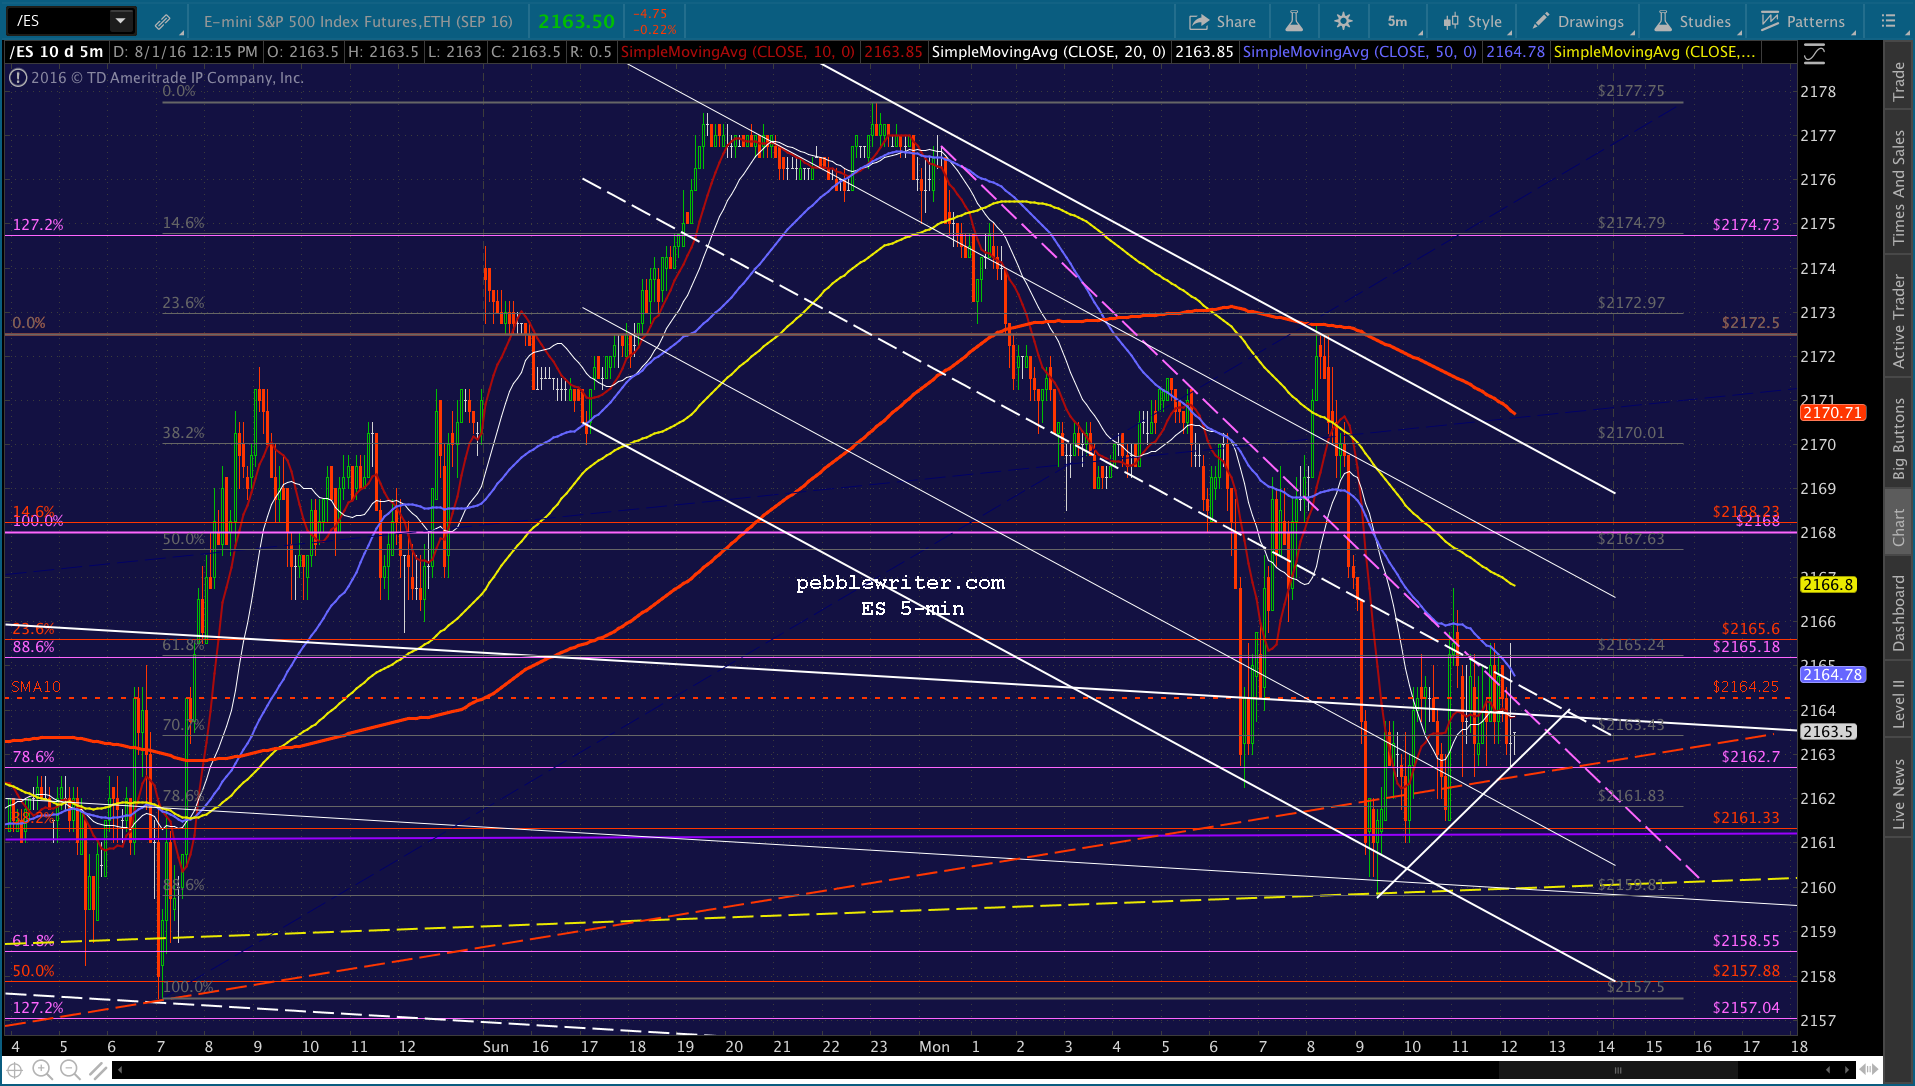
Things are a little clearer than before, but not much. I’d short here on SPX’s failure to break out and the fact that VIX is breaking out. As before, tight stops. Initial target is 2163.15, followed by 2161, 2153 and 2147.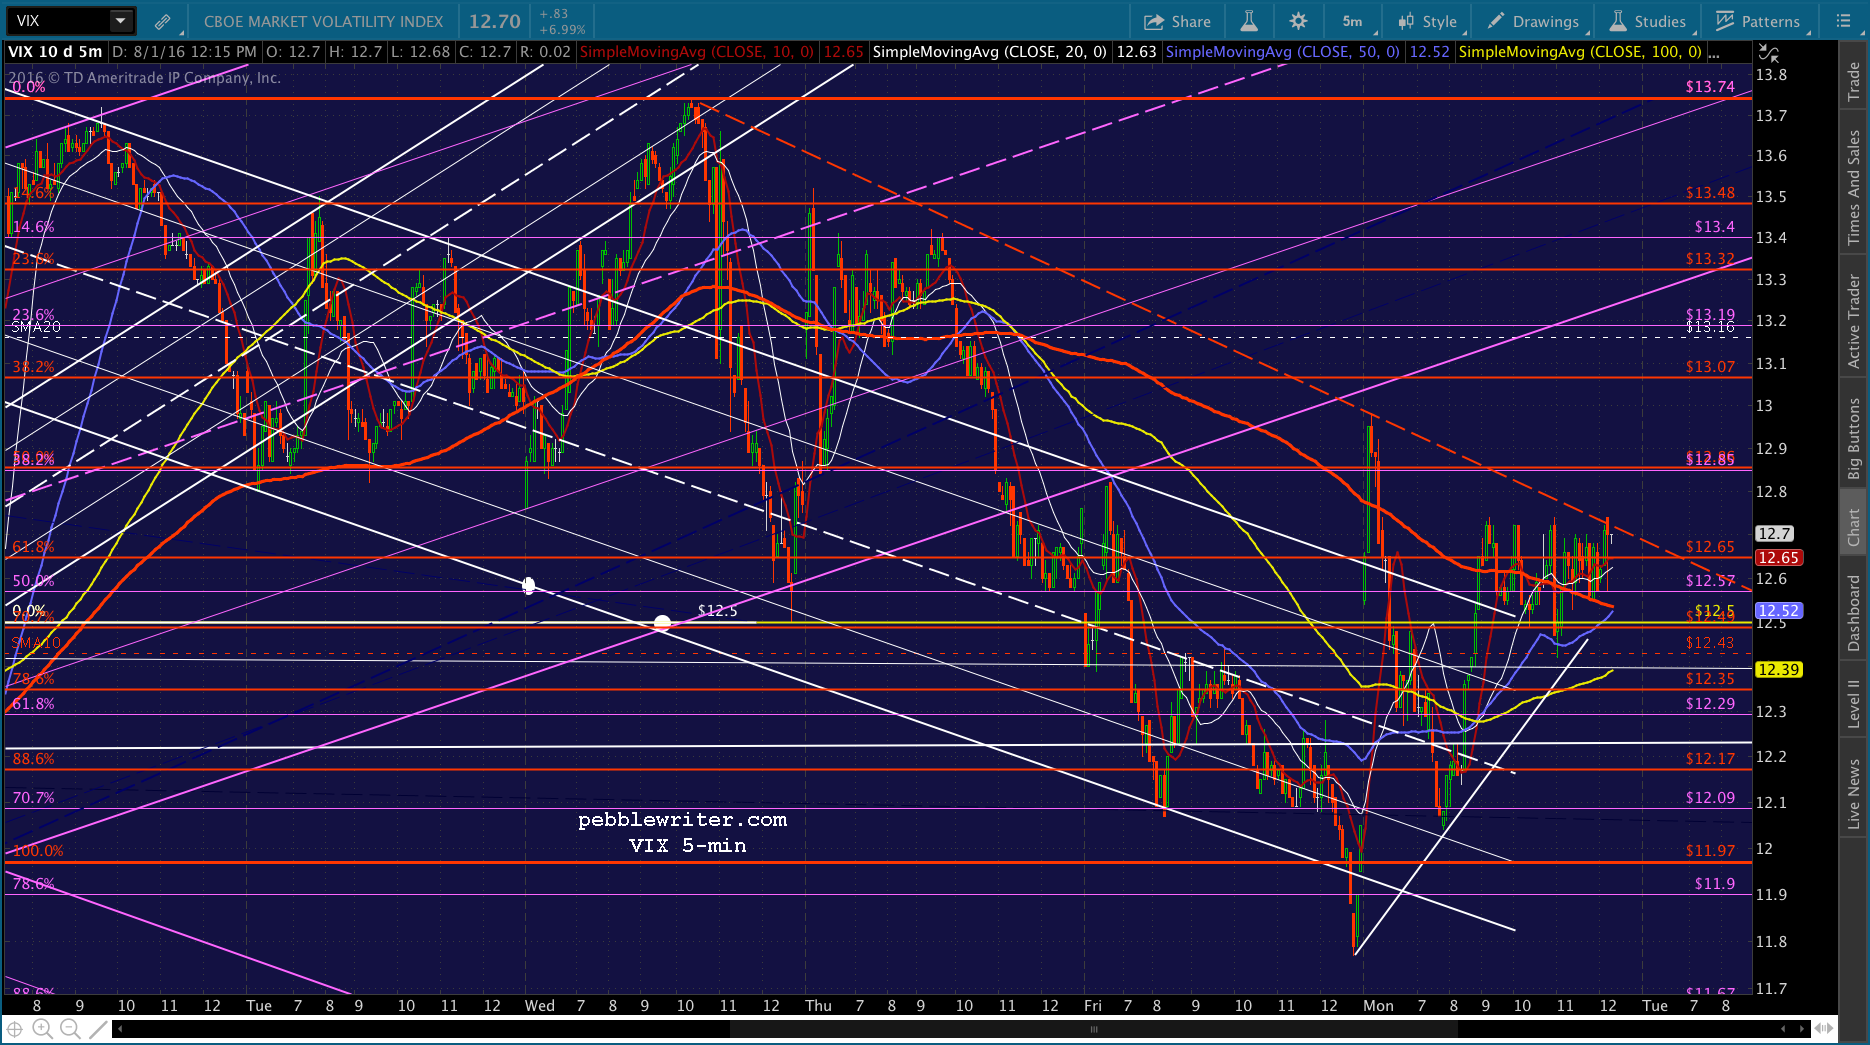

 UPDATE: 3:44 PM
I know this will come as a shock, but VIX is dropping like a rock again. I’d dump the short position here and quit while we’re ahead. 
 UPDATE: 3:51 PM
That was apparently a head fake. Back to short into the close for 2163. Very tight stops advised, as SPX is still above the white channel top and the past few weeks have seen plenty of VIX smashing in the final few minutes of the session. UPDATE: 3:59 PM
Nuts. Another VIX smack down just in time for the close. Back to cash for the night.
 UPDATE: 5:45 PM
That was a crazy, crazy day. It started off really nicely, with the white channel backtest as expected. It seemed like it could have gone a little bit lower. So, instead it popped up 10 points to new highs and then down 12 points through support — at which point it zig-zagged back and forth for the next 3 1/2 hours as VIX was all over the map.
I’m not at all happy with the chart below. The rising purple channel has tilted to the point where I think the red one shown below is more valid. Hopefully the analog I’m studying will help make sense of things. But, for now, this is the best I can offer. USDJPY has more to go, but was propped up all day, today.
 And, VIX — I’m basically hating it right now. Whichever central bank (or their proxy) is manipulating it should be beaten with a limp trend line until they’re black and blue. It has had no regard for normal behavior, let along a proper reflection of the risk present in the “markets.” It’s out of control — except that it is very much being controlled.
  More in the morning…
Comments
2 responses to “Are Lower Interest Rates Good for Stocks?”
It does seem like TPTB can keep this up indefinitely. These last two weeks have been filled with unprecedented intervention by them. Low volume has been their ally. I was wondering your thoughts PW on what it will take to move this market.
All true. Unprecedented, and they seem to have lost interest in being discreet about it. USDJPY isn’t working. CL isn’t working. VIX is just so obvious and clumsy, but — hey — what does it matter? As far as what it takes, I’m working on an analog that will hopefully answer that question.