Though we post updated CL charts every day, it’s been a while since we took a step back to examine the big picture.
* * * * *
Metaphorically speaking, CL suffered heart palpitations on Aug 24 2015, went into full-scale cardiac arrest on Dec 7, and was resuscitated this past Feb 11.
Aug 24 marked its bounce on the bottom of a very long-term price channel. Dec 7 was the day it plunged through the channel bottom. And, Feb 11 marked the bottom — the level at which we remarked, that day, that it must bounce.
 As the .886 retracement of the rise from 10.65 to 147.27 between 1998 and 2008, 26.22 was the lowest price target listed in our Jan 6 Update on Oil. As we noted that day, below 26.22, and “things could get really nasty.”
Our outlook on CL was heavily influenced by what I saw as a growing reliance on oil futures to drive stock algorithms.
CL, in itself, has become a pretty effective algo tool. That is, when USDJPY isn’t available for ramping duty, a strong spike in CL almost always works.
And, if USDJPY doesn’t start moving higher soon, we’re going to see a lot more days like today, with sub-2000 SPX [see: Yen Carry Trade.]
SPX fell 200 (about 10%) points over the next two weeks as USDJPY continued to plunge through support. An interim bounce at 27.56 helped SPX bounce 135 points. But, the subsequent drop to 26.05 on Feb 11 unwound all those gains.
Since Feb 11, CL has rebounded an astounding 80% — the biggest quarterly gain since the stock market crash was declared over in 2009. SPX has rebounded 16.6% higher after bottoming the same day.
And, CL continues to drive stocks higher — as illustrated in recent posts such as How to Engineer a Rally. Is it sustainable? Doubtful. As CL becomes more expensive, consumers slide that much further under the bus — especially the Japanese, whose currency recently resumed weakening again, a double whammy because oil is priced in US dollars.
 Then, there’s the central banker We-Need-More-Inflation! meme. For those of you who occasionally eat or drive, ever wonder why central banks exclude food and energy costs from their core CPI calculations? Ostensibly, it’s because these costs are just too darned volatile.
The reality? It’s hard to argue a pressing need for more monetary stimulus when actual inflation, if measured as it was in 1980, is closer to 9%. It also helps suppress cost of living adjustments for pensioners and their ilk. For a nice treatise on the changes and the rationale, see John Williams’ excellent Shadow Government Statistics.
When stock prices are at all-time highs, driven there by artificially low interest rates, direct central bank purchases and CL manipulation, is there any chance that oil prices will ever decline again? Actually, yes. But, it will mean finding a new (or, rather, old) catalyst for the algos.
 The yen carry trade is still an option. But, the BoJ has made it clear they don’t really want an even cheaper yen (higher USDJPY.) They simply want the higher stock prices that come from it. If CL were to dump, USDJPY would have to rally to support stocks. They’ve certainly been talking, lately, as if that’s in the cards.
With that said, our forecast includes two scenarios.
continued for members...
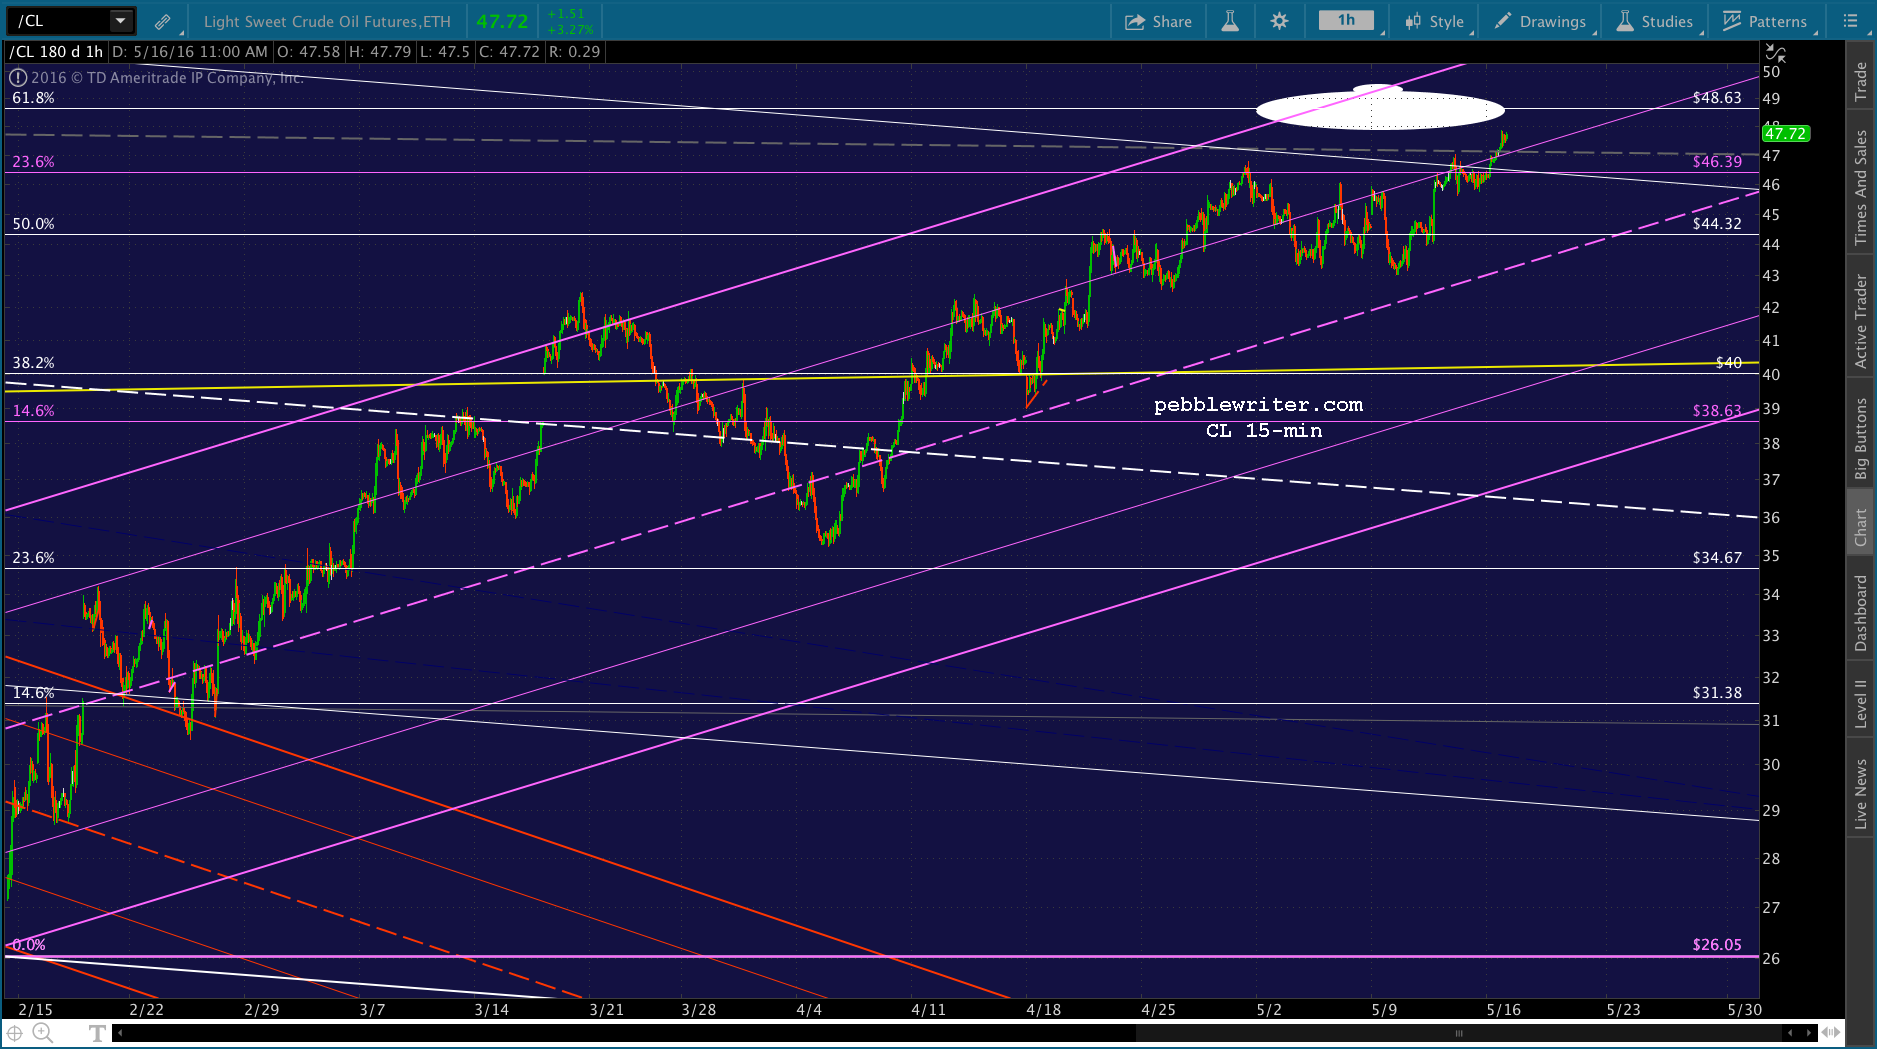
- With SPX only 3% below its all-time highs, CL pops on up to a higher Fib level before reversing. The .618 just above at 48.63 is probably not high enough, but the .white .786 at 54.76 in June might do the trick. If its still resisting, then popping out of the falling white channel should work.

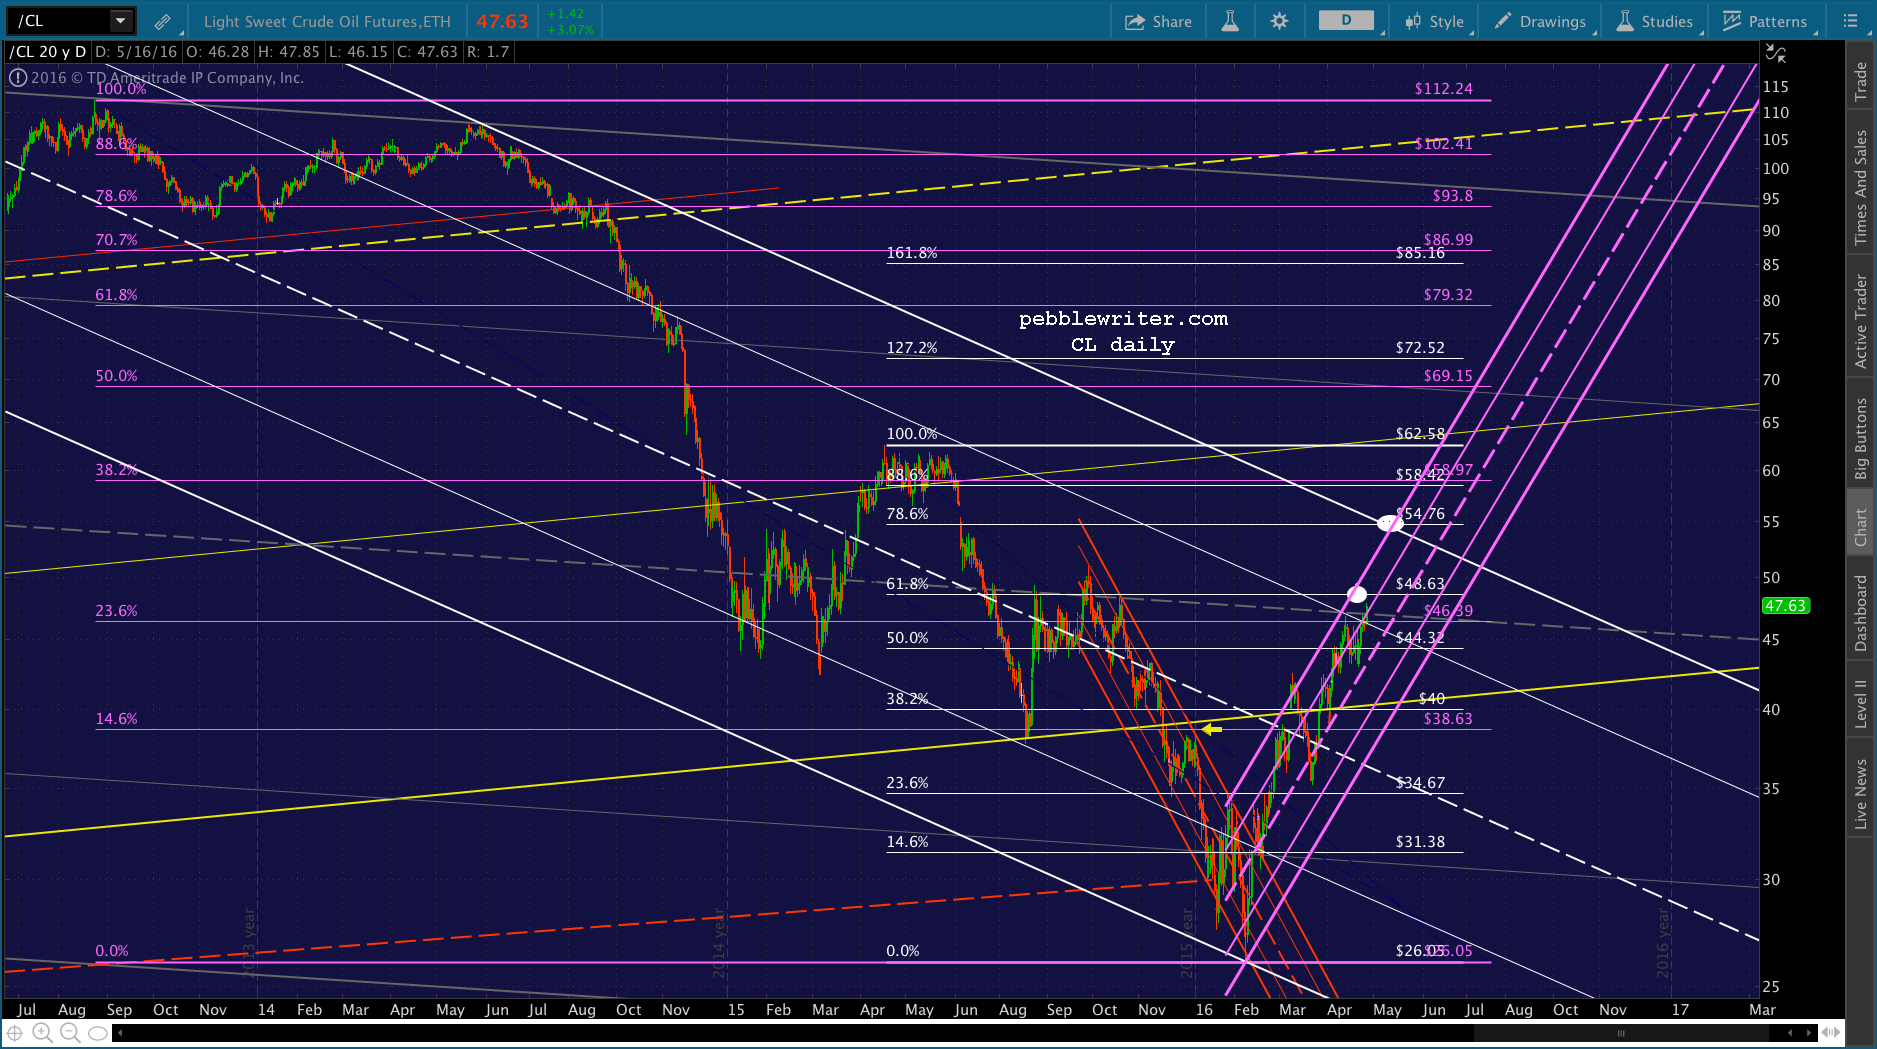
2. If CL were to reverse between here and its .618 at 48.63, USDJPY is certainly in a position to break out above the purple .618 and red channel line. CL could decline just long enough for USDJPY to finish getting SPX over 2134, then resume a slow meltup or sideways motion until SPX backtests the 1.618 Fib at 2138. Either way, I don’t see that CL needs to get much higher if all it aims to do is break SPX out of the correction it’s been in since May 2015. If it does, then it’ll likely do more damage than good to the majority of the economy which doesn’t appreciate higher oil prices.
Either way, the key price level to the upside is the white .618 at 48.63, followed by the white .786 at 54.76 and the white .886/purple .382 combo at 58.42-58.97.
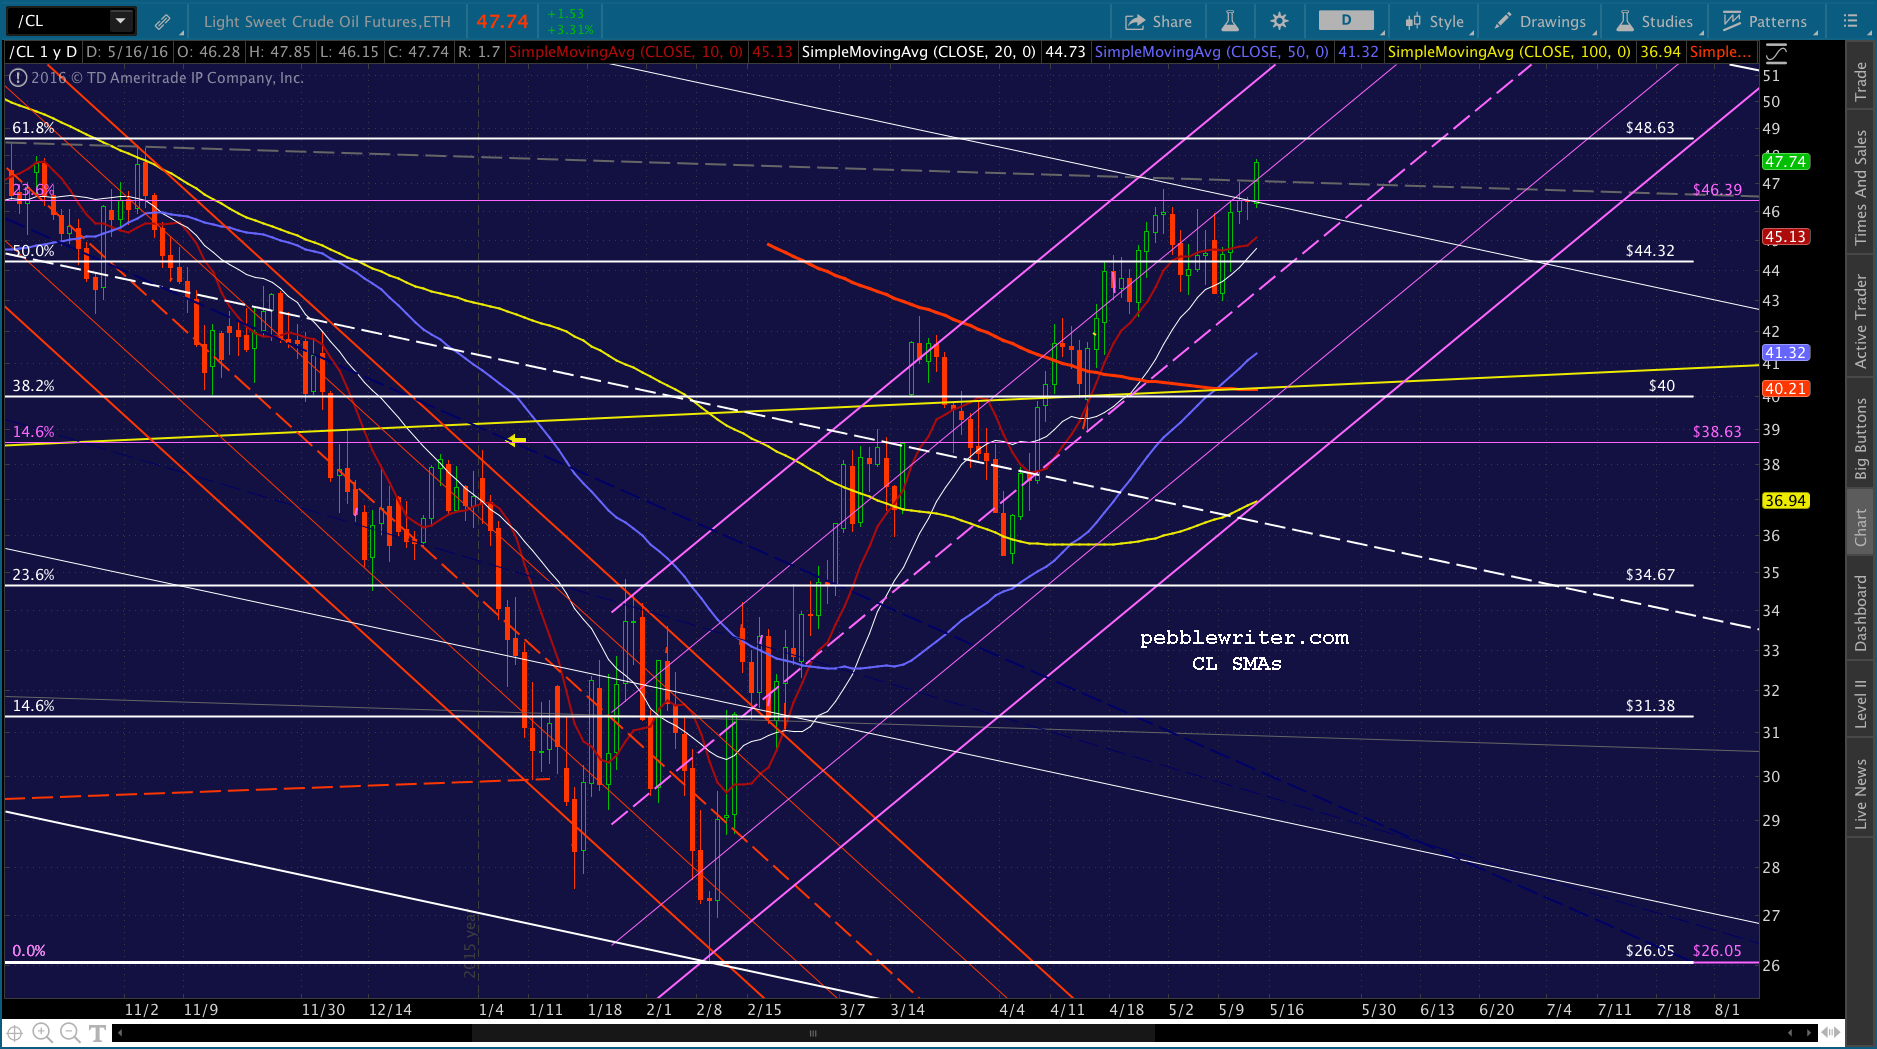
As far as downside goes, the SMA200 is now just 5.50 below current prices at 40.21. There never was a decent backtest of it, so I’d have to consider it the strongest nearby support. Though, the SMA10, 20 and 50 are higher at 45.13, 44.73 and 41.32.
 Stay tuned.
* * * * *
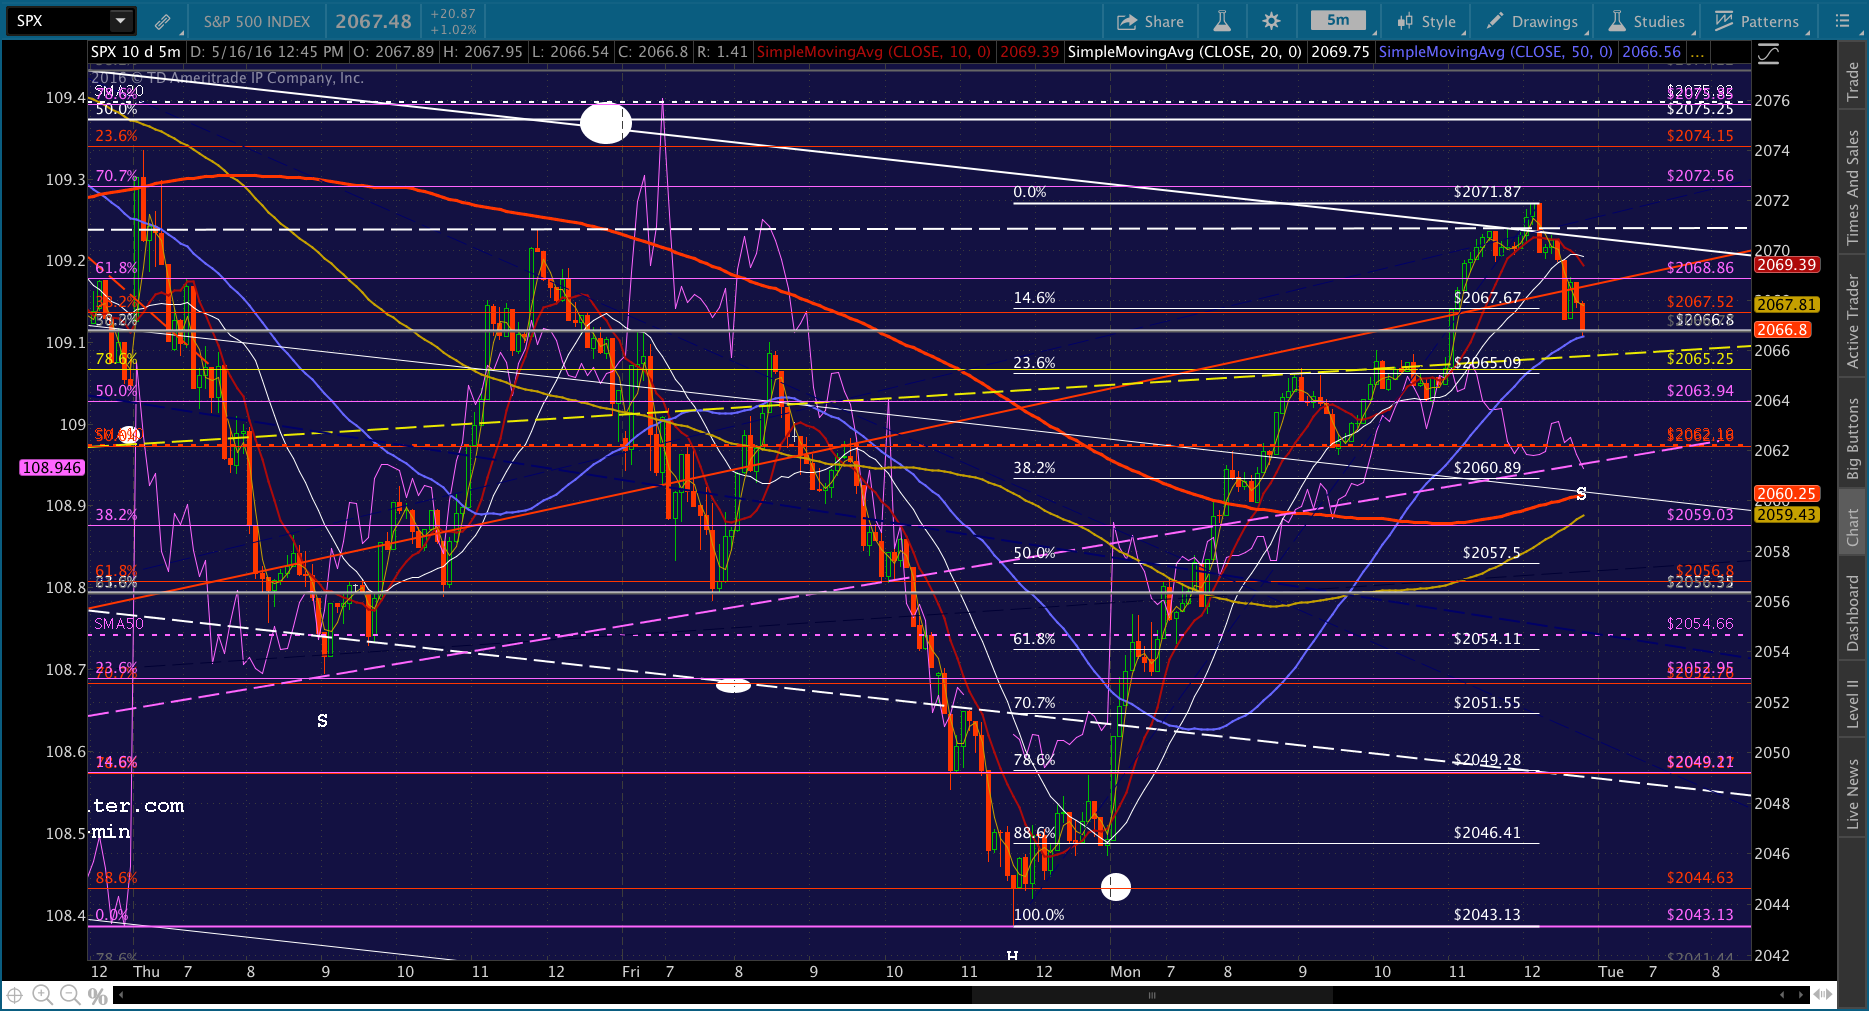
BTW, while I was writing this, SPX reached the top of its falling white channel, largely on the efforts of CL, but also a late bid by USDJPY. The algos aren’t usually forward thinking enough to take advantage of such opportunities, but a decline here to 2060 or so would make for a nice IH&S neckline. I’d take a crack at shorting here, but with tight stops. They usually just ram it on through resistance like this.

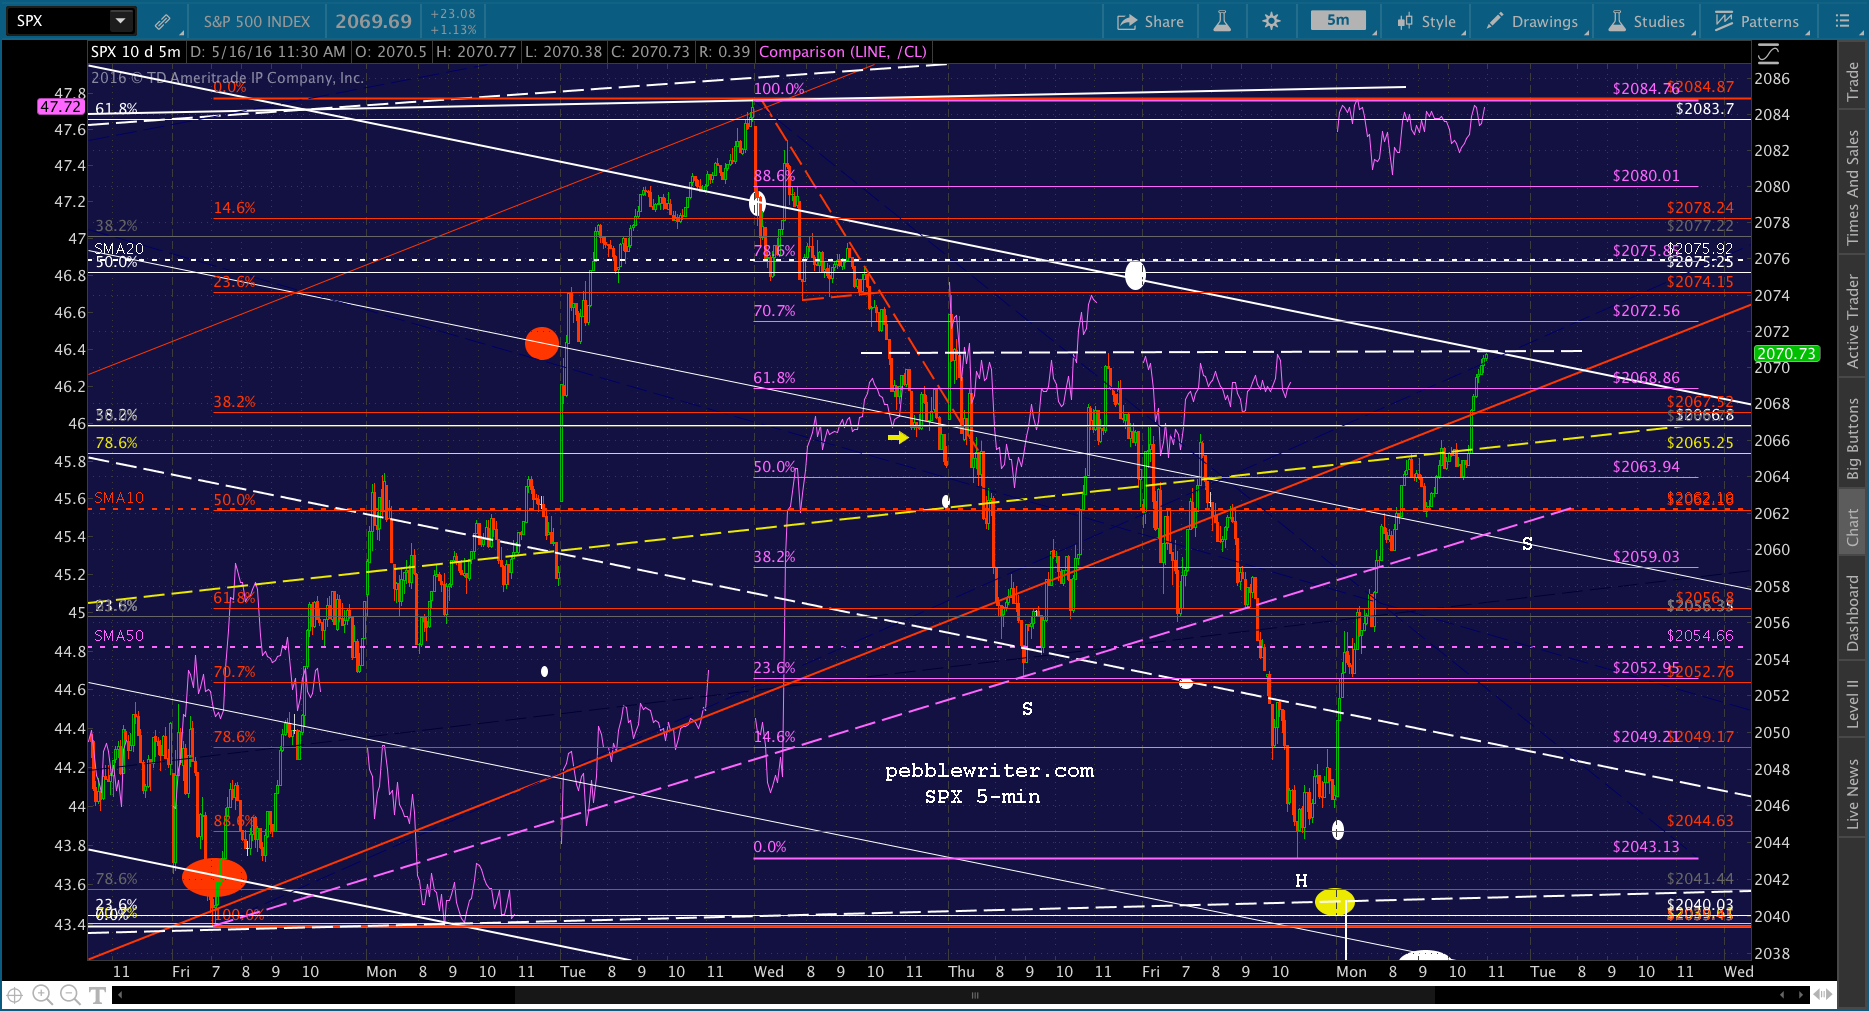 UPDATE: 3:49 PM
With 10 minutes to go, it’s anyone’s guess. What’s the more valuable to TPTB, a backtest on the yellow neckline at 2065.70ish (again!) or a drop to make a more symmetric right shoulder for the IH&S. I’d go for 2060-2062, myself. But, that would mean holding short overnight. As always, only do so if you can hedge or watch it carefully overnight.