Month: April 2019

  • FOMC: Endgame?

    I can’t recall the last time we saw such a wide array of expectations regarding the FOMC’s next steps.  Like opinions, data has been all over the map.  Just this morning, Trump’s latest nominee for the Fed, Stephen Moore, insisted we could have 4% growth with no inflation going forward.  Total nonsense, of course.

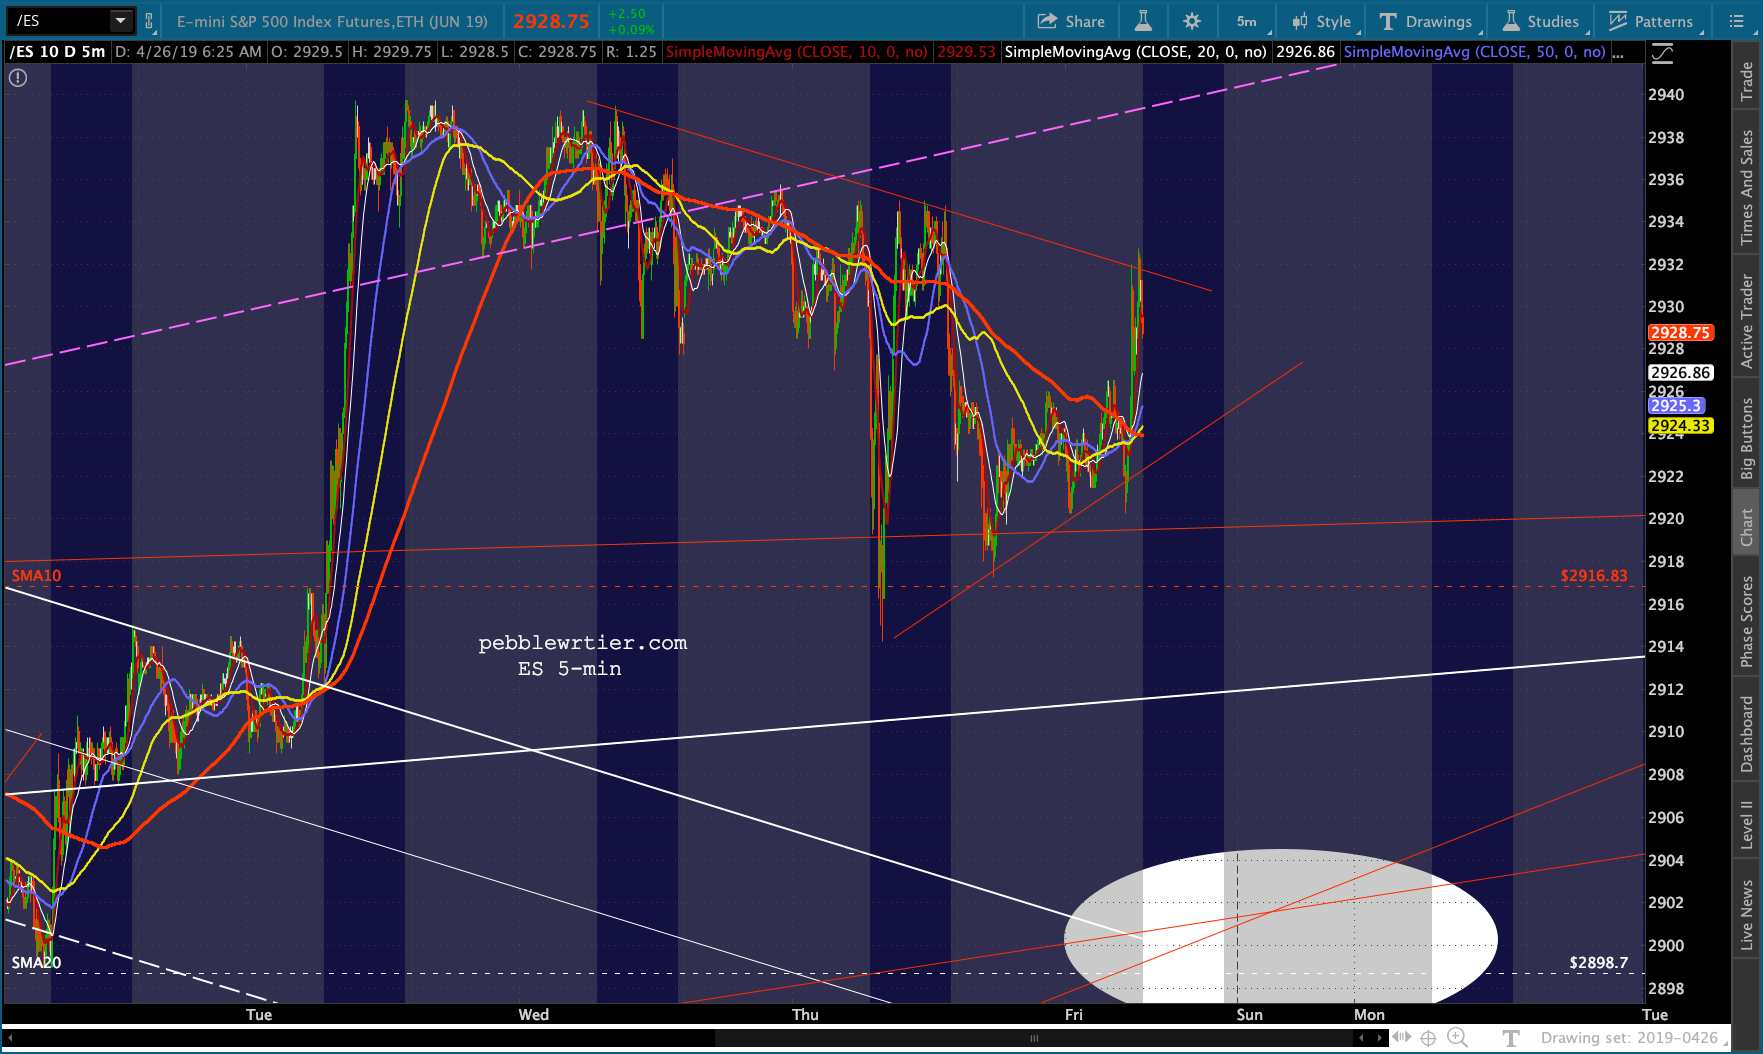
    Futures were off by as much as 7 points overnight before a pop in oil futures brought them back to even.  They’re currently off about 2 points — about where we were yesterday morning at this time.

    If the rising wedge and SMA10 break down — likely, as the FOMC is rather boxed in — look for ES to test its rapidly rising SMA50, currently at 2846.50.Today, we’ll take a look at the big picture and try to discern what the charts suggest the Fed’s actions might be.

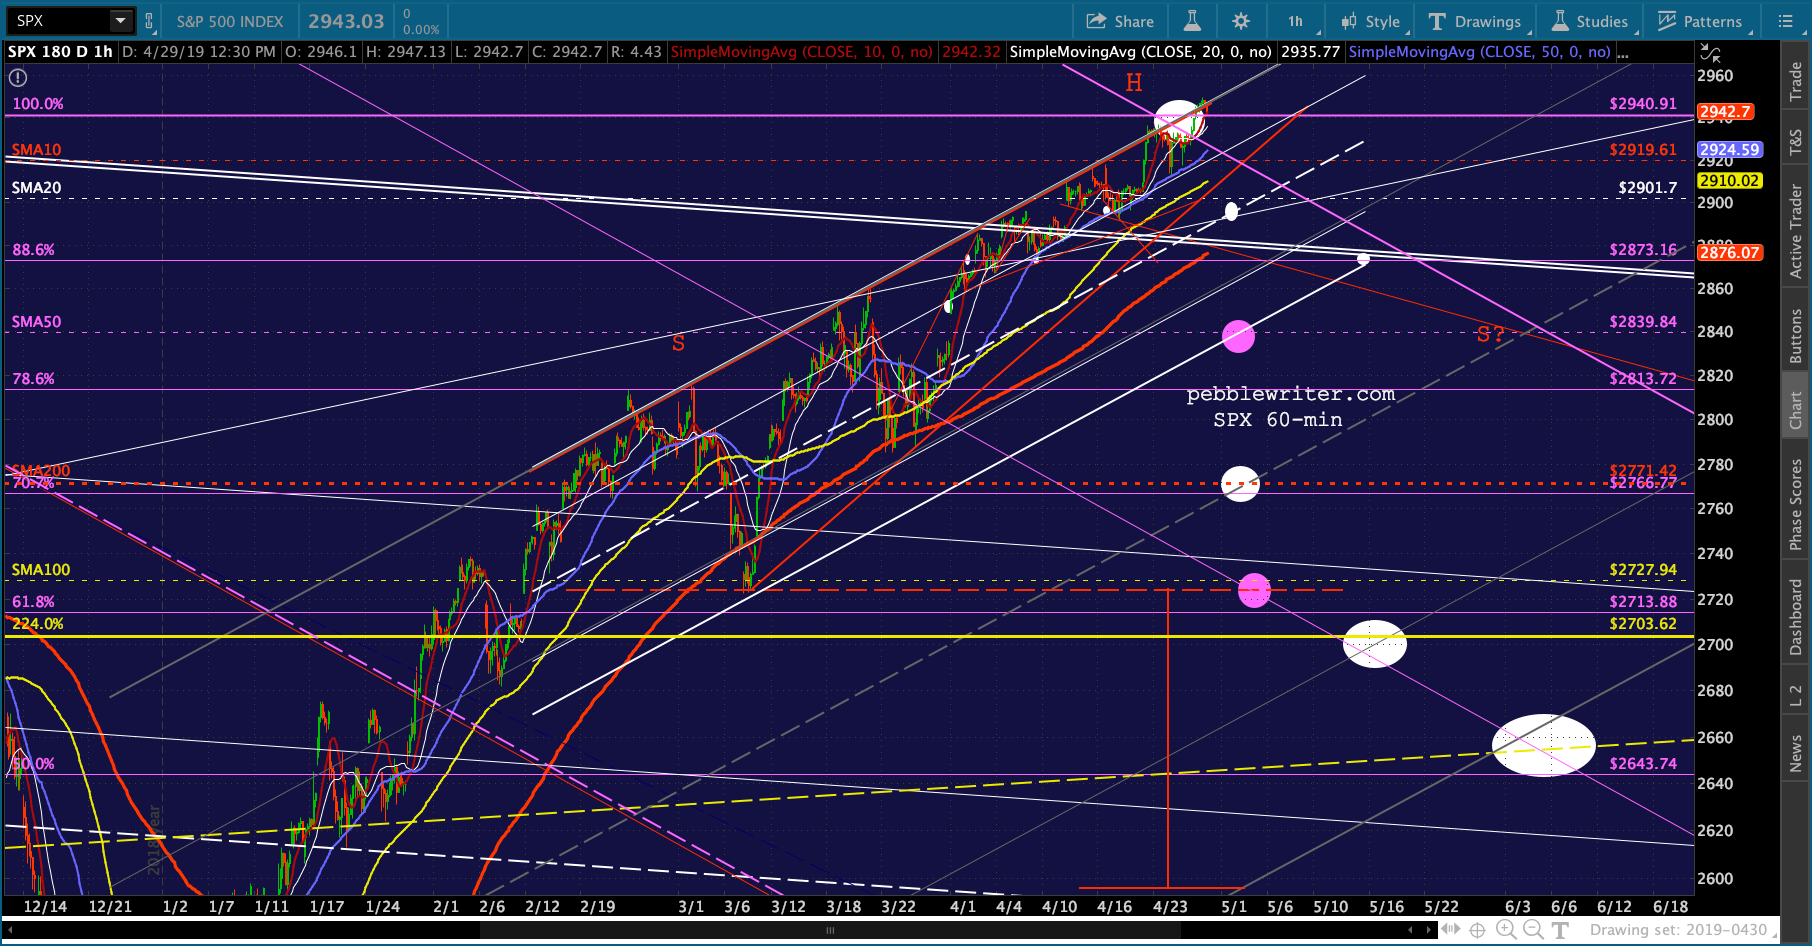
    First, a reminder as to where SPX/ES stand. As we discussed yesterday, a drop through 2940 — which it should do on the open — is a signal to short.  From there, we have multiple downside targets starting with the SMA10 at 2919, the SMA20 at 2901 and SMA50 and small white channel bottom at 2938.

    If the white channel breaks down, there’s little in the way of support until reaching the SMA200, currently at 2766 and rising slowly, followed by the 2.24 at 2703.62 in late May.
    continued for members(more…)

  • Charts I’m Watching: Apr 29, 2019

    Futures are flat this morning after coming within 0.25 of the Sep 2018 highs overnight.

    The algo factors are generally bearish, but that hasn’t been enough to stop the meltup thus far.

    continued for members(more…)

  • GDP Beats, Stocks Yawn

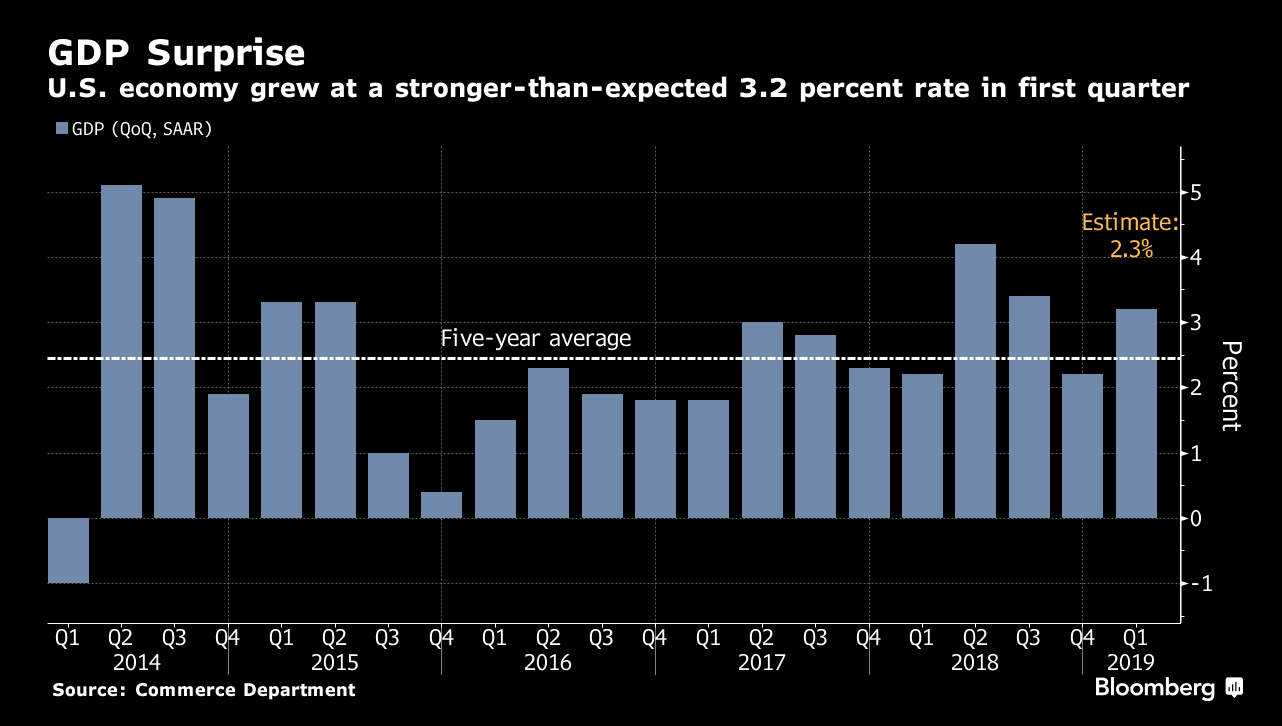
    Q1 GDP came in at 3.2%, a big beat versus the 2.3% most expected.

    Futures, which nailed our SMA10 target yesterday and had been in the process of breaking down, shot up to the top of the triangle pattern we’ve been watching — not enough to register as a breakout.

    It will be interesting to see how the Fed spins the latest data to fit their dovish stance.  Our downside narrative remains intact.

    continued for members(more…)

  • Yield Curve Model Warns Again

    Over the last couple of years, the shape of the yield curve has provided some remarkably useful warnings of market turmoil.  There are numerous signals and nuances in our yield curve model. One of the most significant is when the 2s10s breaks out above resistance.

    It can be seen below in the breakout above the blue trend line (which signaled the Jan-Feb correction) and again in the breakout above the red trend line (which warned us of the Sep-Dec correction.)

    What might it mean, then, that the 2s10s is threatening to break out again?

    continued for members(more…)

  • Sealing the Deal

    SPX came within 4 points of its all-time highs yesterday, a few days ahead of schedule but close enough to be considered a major victory for the bulls.  Oddly enough, the futures didn’t seal the deal after-hours.

    Is it just possible that the downside case isn’t completely dead?

    continued for members(more…)

  • Markets in Maintenance Mode

    SPX has spent 16 sessions at or above its 10-DMA, hardly a record but definitely getting long in the tooth.  For those keeping track, this latest run began the day after VIX was hammered back below its SMA200 and CL popped above its SMA200.

    But, most of the excitement this morning is in currencies.  DXY is testing its Dec 14 and Mar 7 highs, which has nice implications for GC reaching our next downside target.continued for members(more…)

  • Oil Fails to Rally Stocks

    One of the more effective factors in prompting algos to buy stocks is the price of oil. Yet, as we’ve been discussing, higher oil prices are a double-edged sword as they can drive inflation to levels which prompt uncomfortably high interest rates.

    Thus, even though the latest 3-D chess moves out of the White House have driven oil prices 2.5% higher overnight, S&P 500 futures are off 10 points.

    continued for members(more…)

  • Charts I’m Watching: Apr 18, 2019

    Futures dipped 11 points below the SMA10 overnight, only to be rescued by retail sales data that beat expectations (+1.6% vs 1.0%)The beat was primarily attributable to soaring gasoline prices and auto sales — a double-edged sword, of course, from an inflation standpoint.The only chart that continues to matter, however is VIX.  It has been threatening to break trend for several week, but has managed to hold up fairly well considering the market’s meltup.continued for members(more…)

  • The Nikkei’s Strange Divergence

    One of life’s certainties over the past decade or so has been that the BOJ would always find a way to keep the Nikkei rallying.  When QEn ran out of steam, there was always direct purchases of stocks via ETFs.  So, it was surprising to see NKD’s rising channel, in place since Fukushima, break down in December.

    True to form, it has since made a strong comeback.  But, it has paled in comparison to the S&P 500 (the thin purple line.)  While SPX is approaching its all-time highs, NKD is approaching a .618 retracement and a backtest of the broken channel.A possible warning sign?

    continued for members(more…)

  • Stocks: Fake It Till You Make It

    As we discussed last week, VIX is at the threshold of what would be a major break in trend.  Every such past setup in which VIX broke down resulted in stocks breaking out above important overhead resistance.S&P futures are up 10 points and are now only about 27 points from all-time highs — the result of VIX being hammered to new lows after rallying nearly 10% yesterday. ES’s rising channel from December, kicked off by a meeting of the Plunge Protection Team, broke down two weeks ago.  But, it hasn’t mattered.  ES continues to melt up, guided by an overhead trend line which will intersect 2947 around Apr 26. Only if VIX bounces strongly will stocks avoid new highs.As for earnings and economic data, the algos could care less lately.

    continued for members(more…)