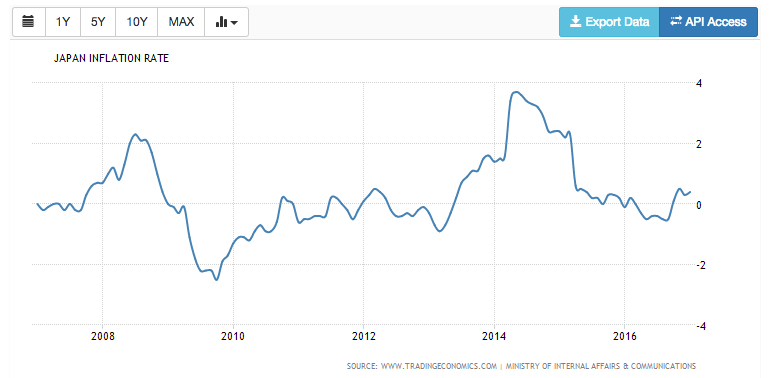
Regular readers know that I’ve been beating the carry trade drum for years. From 2011 to 2015, it was the yen carry trade driven by the plunging yen (rising USDJPY) that was largely responsible for stocks gains. I wrote about this most recently (Feb 22) in our latest post on the Big Picture. At the end of 2013, stocks were in limbo when USDJPY ran into serious technical resistance — the top of a falling channel from 1998. Japan also faced fundamental problems because oil, priced in USD and topping $110/barrel, was causing rather inconvenient inflation (remember, Japan’s nukes were taken offline following Fukushima.)
It’s tough to justify historic accommodative measures in the midst of nearly 4% inflation. But, the BoJ, very much stuck in an equity trap, dared not change course. Withdrawing QQE was not an option.
Stuck between an inflationary rock and a market crash hard place, USDJPY spent eight months going sideways — coiling, but never breaking down — until it finally broke out of the falling channel on Aug 20, 2014. The yen plunged in value, which might have sent inflation spiraling higher.
But, two days earlier, oil had broken down through long-term support. And…spoilers: it was not a coincidence.
USDJPY rallied sharply, gaining 22% by June 2015. And, CL dropped like a rock, losing 55% by Jan 2015 and, of course, much more after a couple of bounces.
The sharp drop in oil obviously made the plunge in the yen palatable. Inflation dropped back below 2% in early 2015 (below zero by 2016) and SPX rallied past the resistance du jour to new all-time highs.
Everything was going well until USDJPY, reached 120.11 — a critical Fib level which represented 61.8% of its drop from 147.65 in 1998 to 75.65 in 2011. Itt spent 14 months playing cat and mouse with 120, boosting stocks with every push above and triggering sell offs like with every dip below.
There was one such scare in August 2015, when USDJPY broke trend and ultimately dipped below 120. SPX, which had recently reached what we deemed a top [see: The Last Big Butterfly], plunged 12.5%.
USDJPY pushed back above 120 and stocks recovered. But, it didn’t last. In December, It fell through 120 again. This time, stocks plummeted 14.5%. Clearly, something had to give.
Fortunately for stocks, CL was nearing a bottom. I had had a downside target of 26.22 on CL since Jan 9 and called a bottom on Feb 11 simply because any further drop in CL and USDJPY would have broken some very long-term trend lines for SPX [see: USDJPY Finally Relents.]
Oil bottomed at 26.05 on Feb 11, and rocketed higher, almost doubling in 4 months. Its recovery was about all that stocks (well, algos) cared about. When CL finally reached 51.6 last October 10 — one year from its last 2015 peak — I called a top [see: Welcome to Peak Oil.]
It occurred to me that oil would need to decline sharply over the next 4 months or Yellen & Co. would also be facing some rather inconvenient inflation of their own.
As it turned out, that call was premature. CL fell 18%, but the drop was tough on stocks — which everybody wanted to ramp higher into YE, especially after the near disaster on election night [see: The Fallout.]
So, the decline was postponed until 2017 — with CL putting in a high on Jan 3. It might have stayed at that level, too, but for inflation. January’s 0.6% MoM (2.5% YoY) CPI sent shock waves through the Eccles building — not to mention the bond market.
With February’s (probably worse) numbers due out on Mar 15, central bankers must take action to avoid being painted into an inflationary corner. Bottom line, this is the swoon we’ve been waiting for.
There are two ways to play it, and neither of them involve stocks. CL has already reached our two initial downside targets, but there is more to come.continued for members… (more…)
With this morning’s ADP employment report bolstering the odds of a rate increase next week, one would expect the USD to get a little bump (is there anyone left out there who doesn’t expect an increase?)
It would be a shame, though, if investors saw rising rates as a negative — which explains why USDJPY stepped up to the plate. The peculiar thing is that the now-familiar spike occurred over 5 hours before the ADP news hit.
In fact, it was about the same time that oil broke down from its week-old rising channel, dragging stocks below an important channel line.
Futures are up 9.5 points from their overnight lows, and everything is peachy again in the “markets.”
SPX nailed our downside target yesterday, then turned around and came within pennies of our bounce target. Today promises to be not quite as easy, as CL has joined VIX in propping up the futures overnight — but, at pivot points where they could break out or break down.
Odds are the 5-pt loss is designed to hold SPX to a backtest in the opening minutes of trading — putting in a floor of sorts.
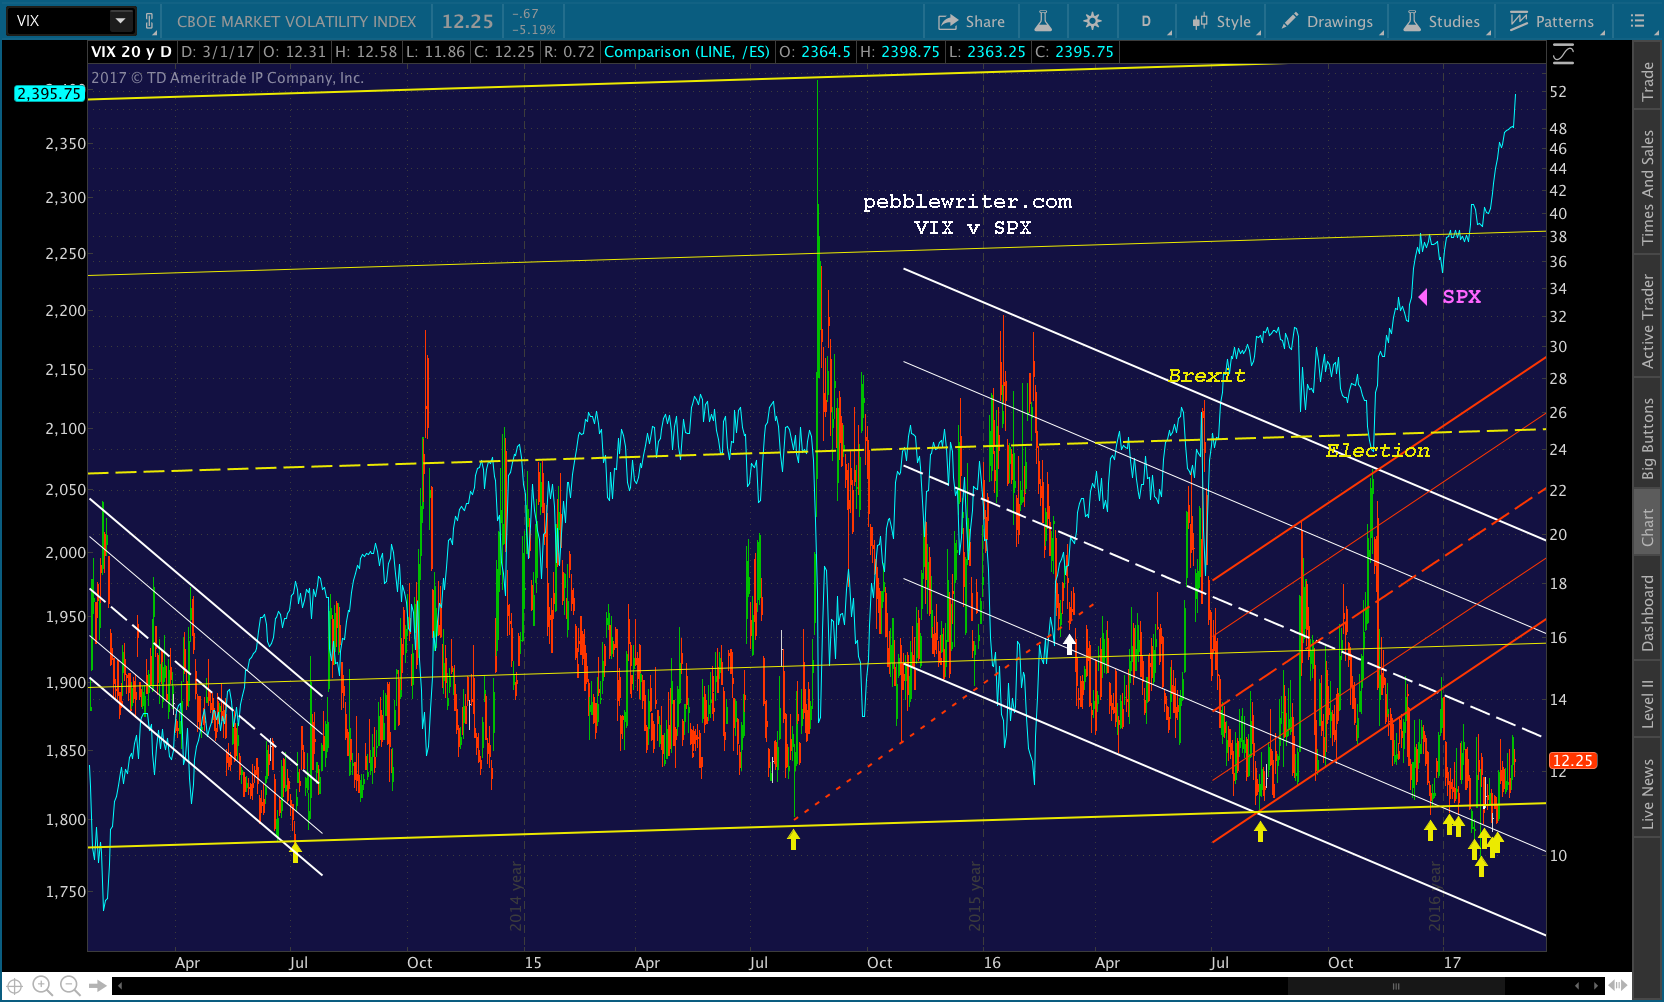
VIX spent the past month edging higher, finally breaking out of the falling white channel that has marked tops since Dec 30. There were numerous intraday plunges, as needed, in order to keep stocks from slumping.
But, with SPX threatening to put in a dreaded 1% drop last week, VIX was pressed back into action, descending back into the falling white channel, breaking down the rising purple channel and — drum roll please — making its 8th voyage below the long-term yellow channel bottom.
It was enough to merely postpone Friday’s drop to our next downside target — which should be tagged this morning.
The Fed’s Evans, Lacker, Powell, Fischer and Yellen are all appearing in public today, and will no doubt be pressed for confirmation regarding the recent hawkish comments by Dudley, Brainard and Kaplan. I can’t remember a time when there was so much unanimity regarding a rate hike.
SPX was off a whopping 14 points yesterday which, given its recent melt up, felt like much more. Somewhere, some investors are clearly wondering about rising rates. After 8 long years of the most accommodative monetary policy in history, can the Fed and the bulls sell investors on the idea that higher rates are a good thing?
I suggested last October 10 [see: Welcome to Peak Oil] that oil, then at 51.60, would need to fall significantly to avoid nasty YoY CPI comparisons in Feb 2017. Recall that CL reached 26.05 on Feb 11, 2016 — so Feb 10, 2017’s close at 53.85 was roughly a doubling over the course of that year.
As it turned out, CL did drop sharply — dropping 18% to 42.2 by Nov 14. But, TPTB were quickly reminded of what I had been posting about for months: CL had taken over primary responsibility for driving equity algos. Having driven SPX almost 20% higher since Feb 2016, CL’s decline was now dragging equities lower.It was SPX’s second such dip below the midline of a large rising channel (yellow arrow below, the first being Brexit) and the Central Planners wanted nothing to do with the bottom half of that channel. The day after the US election, CL joined with USDJPY and VIX in trying to convince investors that the election results were a good thing [see: Why the Trump Rally is a Fraud.]
Everyone knows the rest of the story. Oil ignored huge inventory builds and rallied through the end of the year to new highs — enabling SPX to do the same. Even after the channel that carried it sharply higher for two months broke down on Jan 9, CL managed to limit its losses to 8%. Even after January’s CPI numbers came out at 2.5% on Feb 15 — due largely to oil and gas — it still bounced back, almost to its previous highs.
That was then…and, this is now. We’ve been expecting a divergence between RBOB and CL, and the past few days has not disappointed. It seems TPTB have reached a compromise that will enable gasoline prices to drop back to an acceptable level without CL participating in as much downside.
RBOB rallied sharply along with CL and, well, everything else in November — suggesting a new, faster rising white channel and avoiding our original white target at 1.4855. Yesterday, RBOB closed below its SMA200. This morning, the white channel broke down. RBOB might just find its way back to the red channel after all.
Much of it, of course, has to do with what SPX has accomplished over the past couple of weeks.
I very seriously doubt that Trump, nor anyone for that matter, can sharply expand spending while slashing taxes without generating higher inflation and, thereby, higher interest rates.
Yet the “market” continues to melt up, supposedly because the new administration will be so beneficial to the economy. What gives?
Without question, trend followers have jumped on board after seeing stocks make new highs. But, it should be obvious by now that prices are way ahead of any improvements in fundamentals – both current and promised.
The past two days are a great example of what’s really driving stock higher the past several months: well-timed spurts in USDJPY and CL and downdrafts in VIX.
A rising USDJPY is, of course, the primary sign that the yen carry trade is at work. And, VIX, formerly an indicator of risk, is now regularly used to goose algorithms which spur stock buying every time VIX ticks lower and/or breaks below support. CL is a general, all-purpose price booster with a very outsized impact.
THE PAST SEVERAL MONTHS
Since the election, SPX has traced out a rising channel, shown below in purple. In late January, it took on a steeper trajectory, shown as the red channel below. This red channel sliced through a Fib level that might ordinarily serve as overhead resistance — the white 1.618 at 2335.34 — without so much as a backtest.
So, it made sense that, after a reasonable amount of time and a couple percent, SPX would return to backtest it. Beginning on Feb 21, SPX started to trace out a falling channel, also shown in red. It was well-formed, meaning it offered several lows and a couple of highs that lay along parallel lines. And, it aimed for the 1.618 around March 6.
THE PAST TWO DAYS
There’s nothing very unusual about the past two days. We’ve seen the very same factors play out that drive prices higher on a day-to-day, even moment-to-moment, basis. It’s instructive, though, to see what’s working lately.
When SPX opened the morning of Feb 24, it gapped lower to tag the bottom of the falling red channel where it intersected with the bottom of the rising red channel (the first yellow arrow.) It was an obvious spot for a bounce — which we noted at the time.
VIX, which had made a special point of climbing from its close at 11.7 the day before to 12.59 just before the open (a 7.6% spike), dropped like a rock moments later, gapping back down to 11.66 by 10am.
VIX’s plunge ensured a sharp bounce. But, what then? How to keep the rally going? First, VIX quickly reset back to 12.49 where it began a slow, steady decline that only algos could love. It helped SPX slowly churn its way back to the top of the channel.
In the final 30 minutes, as SPX approached the top of the falling red channel and VIX had reached the bottom of its rising yellow channel, VIX plunged through channel support (the white arrow) and dropped to a new low at 11.34 — a 9.9% plunge from its overnight highs. The algos went nuts, and SPX closed above the falling red channel top — a breakout.
It didn’t matter that VIX jumped right back in the rising yellow channel the next morning. SPX had broken out, and all that stood between it and new all-time highs was a backtest.
VIX pulled the same stunt the next day, ramping in the pre-market hours Monday morning so it could plunge when the “market” opened and drive prices even higher. Fortunately, CL broke out overnight (the yellow arrow), keeping futures prices on the rise.
But, Monday morning was problematic. Durable goods and pending home sales both missed. Futures were off 9 points from their overnight highs. There was real buying pressure in VIX, and it started ticking higher after its initial plunge. Traders didn’t believe stocks’ new highs.
By noon, SPX was struggling and CL had reached resistance. VIX was still climbing. The only tool left was USDJPY. It had been following a falling red channel since the previous Wednesday, but suddenly (the red arrow) felt the need to spike higher and break out of the channel (the white arrow), a rally that continued until stocks closed for the day.
While USDJPY broke out of the falling red channel, there were other, bigger channels that spelled more downside. And, it hadn’t quite tagged its SMA100 — an obvious attraction slightly lower. But, USDJPY’s spike was just powerful enough to offset VIX’s continuing rise and, more importantly, enough to push SPX to a slight gain and new, all-time highs.
After the close, USDJPY reset back to the SMA100, CL’s rising purple channel broke down, and VIX continued to gain momentum. To make matters worse, GDP and trade deficit numbers disappointed the following morning. S&P futures were off 7 points as stocks prepared to open.
SPX gapped down 5 points before VIX started dipping. But, it wasn’t enough. By 11:25, CL had shed 2.6% from its highs the previous day, and RBOB was off 4.8%. Stocks, used to being supported by CL, were feeling very let down.
At 12:26, SPX completed a backtest of the falling red channel at 2358.96 — potential support. Does it surprise anyone that VIX reached the top of the rising yellow channel (the yellow arrow) and reversed at exactly that same moment? Or, that CL chose that exact same moment to bounce at a slightly higher low (also, a yellow arrow) of 53.19? Or, that USDJPY started spiking higher at exactly that same moment?
SPX had completed a small Head & Shoulders Pattern that targeted 2356.87. But, given the sharp rallies in both CL and USDJPY, it spent the rest of the day trying to rise above the neckline (red, dashed line.) It appeared the 2356 tag, if it was going to happen, would have to wait until the next morning – this morning.
It looked possible, given that the red channel had broken down earlier that day. The only hitch was Trump’s speech later that night. Could he suspend the laws of mathematics and present a cogent plan to sharply increase spending while lowering taxes and staving off inflation and higher interest rates?
In the end, it didn’t matter. Aside from not further alienating half the country, Trump’s speech was long on rhetoric and short on details. It didn’t accomplish much.
USDJPY, on the other hand, was very busy. It extended its rally — now up 2.1% since yesterday morning. CL did the same — gaining 2.4% until this morning’s EIA inventory report reminded everyone that oil prices should be much lower.
VIX, which had reached 12.96 just before yesterday’s close, started dropping immediately afterwards, reaching 11.86 (a 8.4% plunge) as of this morning’s 8:30 data dump. It dropped again after this morning’s EIA report gave CL permission to decline (only to support at the SMA10, of course), bouncing at the bottom of the yellow channel for the 7th time in the past week.
The result: SPX and ES are currently up about 30 points.
LOOKING FORWARD
Does it matter why SPX keeps hitting new highs, or should we ignore the details and keep on buying the dips? Surely, there are limits to the manipulation or what it can accomplish?
It’s hard to say. Since election night last November, USDJPY rallied 17%, crude rallied 30%, and VIX collapsed 56%. There’s your Trump rally.
The challenge in forecasting stocks each day is that these drivers take turns. If oil suddenly starts dumping, it’s a safe bet that USDJPY will suddenly start spiking or VIX start plunging. It’s like a hydra, with a new factor sprouting whenever another is cut off.
I’ve mentioned to many clients that it’s become easier to trade USDJPY, CL and VIX themselves rather than equities. As tools, their individual actions are much easier to forecast than their combined effects.
Having said that, here’s where things shake out.
Oil prices are problematic. We’ve touched on this many times, noting that CPI broke out of a long-term trend with its Jan print — which should be even higher in Feb (due out Mar 15, the morning of the FOMC’s next rate decision and Yellen press conference.)
We’ve also discussed, however, that gasoline prices have dropped further and faster than oil. If the last CPI print at 2.5% was acceptable, then a modest CL drop could hold the Feb CPI number to 2.7 or 2.8% and give the Fed cover to raise rates a bit. Who knows, the PCE might even approach 2% (though, I doubt it.)
Once the Feb 2016 lows are digested, YoY comparisons won’t be so alarming. All the Fed will have to worry about (or not) is John Q’s ability to pay his bills with his declining real income. But, for now, CL is at least 10% higher than it should be.
USDJPY is an interesting case. It’s a currency pair, meaning the dollar will have to increase from its already overvalued levels in order to, along with a falling yen, goose the yen carry trade.
It has proven hugely effective in years past, driving the bulk of the 2011-2015 gains in stocks. But, as the BoJ discovered in 2014, a very cheap yen creates very real inflation — especially if fuel prices remain at elevated levels. Four percent inflation is an inconvenient truth when trying to justify the most accommodative monetary policy of all time in an effort to reach 2%.
IMO, this reality was the impetus for oil’s crash — which, not so coincidentally, began on the same day that the USDJPY broke out. A little mutually beneficial back-scratching, perhaps?
And, you can bet the Fed and politicians alike are keeping a close eye on the trade deficit — which will continue to grow with the USD’s every tick higher.
VIX is the reigning champion of market manipulation. It knows no bounds (other than zero) and has no obligations to reality — economic or otherwise. It’s a rare day when VIX doesn’t suddenly start dropping — goosing stocks in process — on no news whatsoever, other than that stocks are slipping below an acceptable level or need a nudge to get past resistance.
TPTB discovered the extent of VIX’s power following the Brexit sell-off. So, after years of respecting a long-term channel (in yellow below) VIX has been hammered below it countless times since election night’s “miraculous” recovery in equity futures (VIX plunged even while equities were plummeting.)
As a chartist, it’s difficult to know when these moments will arise. Often, for instance, VIX will construct a series of intraday lows — simply to have a trend line below which to plunge later in the day! And, as occurred last night, there is rarely any correlation between its close one day and open the following morning — meaning frequent head fakes and sleepless nights for those who don’t go to cash every night.
CONCLUSIONS
Like most of our readers, I went to a great business school, studied under brilliant and highly-respected professors, read all the top books, magazines and newspapers (like the internet, but on paper.) I worked with some of the brightest analysts for some of the top firms on Wall Street. I have undergraduate degrees in math and economics, and still put in 60-80 hour weeks reading, studying, learning.
And, I can tell you, I have never seen the “markets” as heavily manipulated as they currently are. It was one thing when QE came along and there was a rising tide lifting all boats. But, this is different. It has become much more closely managed — to the point where hardly anything happens that isn’t either preplanned or carefully controlled.
I spoke to a group of financial engineering grad students from my alma mater the other day — very bright young men and women. One of the things they teach these days is using big data to discover and define the factors that drive the prices of investment assets — everything from financial reports to web traffic, patent filings and satellite imagery.
I even took it upon myself to learn Python so I could play around with some ideas that pop into my head from time to time. Quantitative analysis has become increasingly prominent, as evidenced by the growing number of quantitatively-driven hedge funds in the top 10.
Two observations stand out. First, most analysts, trained in random walk theory, efficient frontiers and various fundamentally-driven pricing models, remain completely unaware of the degree to which algorithms impact prices on a daily basis and, even, moment to moment.
The other observation is the scary one. There are only so many data points in the universe. If we’re all studying the same data, then we will all likely come to similar conclusions regarding pricing and, thus, seek to buy and sell at similar times. In other words, those following the important indicators constitute a crowd which could have great difficulties squeezing through the doors when (not “if”) the theater catches fire.
We saw this play out on Black Monday in 1987. We saw it again in 1998 when LTCM melted down. We saw it after the internet bubble popped in 2000-2003, and again in 2007-2009 when mortgages blew up.
Shiller CAPE Ratio
More recently, we saw it happen in 2011, when our analog played out (despite very heavy central bank influence.) It almost occurred with Brexit and the US elections, but was successfully beaten back. What about the next time?
We can’t know exactly when or what the next catalyst will be. But, it’s safe to say there will be one. With CAPE edging back above all but its 2000 highs, it could be a doozy. In fact, if everyone is crowded into the same trade, betting on the same outcome, it increases the odds of it being truly devastating.
Over the past few years, the “market” has developed a knack for rising in spite of disappointing economic news. Before CPI reached 2.5%, we usually characterized it as “bad news is good news.” In other words, a moribund economy increased the odds of maintaining or even expanding the most accommodative monetary policy of all time.
But, inflation changes things by laying bare the negative implications of easy money and easy credit. It might be acceptable if hard economic data were keeping pace. But, it’s not.
Trump will speak to the nation tonight and, given that he’s smarter than the rest of us (except, perhaps, when it comes to healthcare), will explain how the laws of mathematics can be suspended for the next four years. The “market” might even respond favorably — which would simply mean that USDJPY, CL or VIX-driven algos have kicked into high gear. But, at the end of the day, it simply doesn’t add up.
If he gets his way, we’re heading into deeper deficit spending — but, this time, with $20 trillion in debt and rising interest rates. What could go wrong?
The interplay between USDJPY and oil has been fascinating to watch. The yen carry trade used to be the primary driver of algos and, thus, equity prices. But, CL officially took over on Feb 11, 2016 and, despite the inflation complications it has engendered — not to mention a bearish channel breakdown and some of the worst fundamentals on record — it’s having a hard time letting go.
With CPI reaching 2.5% in January, and the year-over-year numbers set to look worse for February, what can we expect from oil and, thus, equities?
Can USDJPY find its feet, and can VIX be hammered strongly and frequently enough to offset the impact?


 At the end of 2013, stocks were in limbo when USDJPY ran into serious technical resistance — the top of a falling channel from 1998. Japan also faced fundamental problems because oil, priced in USD and topping $110/barrel, was causing rather inconvenient inflation (remember, Japan’s nukes were taken offline following Fukushima.)
 Stuck between an inflationary rock and a market crash hard place, USDJPY spent eight months going sideways — coiling, but never breaking down — until it finally broke out of the falling channel on Aug 20, 2014. The yen plunged in value, which might have sent inflation spiraling higher.
 USDJPY rallied sharply, gaining 22% by June 2015. And, CL dropped like a rock, losing 55% by Jan 2015 and, of course, much more after a couple of bounces.
  USDJPY pushed back above 120 and stocks recovered. But, it didn’t last. In December, It fell through 120 again. This time, stocks plummeted 14.5%. Clearly, something had to give.
 It occurred to me that oil would need to decline sharply over the next 4 months or Yellen & Co. would also be facing some rather inconvenient inflation of their own.
  continued for members… (more…)