If the S&P 500 Index suddenly shot up 160 points, or the DJIA 1,350 points (7.4%) in one day, would anyone notice? It would be the biggest point move ever for the Dow, and the third biggest percentage move ever. It would make headlines, right?
So, why is it that when oil prices gained an equivalent amount in 24 hours earlier this week, no one blinked an eye? Maybe the guys filling up their Family Trucksters this weekend will grumble a bit. But, besides them, nobody seems to notice. Nobody seems to care.
Would they care if they knew the extra pain at the pump was the result of central bankers manipulating the stock market higher?
Sure, oil companies benefit from higher oil prices. But, the real point is to goose automated stock buying programs — algorithms — to push stocks up to new highs.
It’s not always as obvious as this week, when the 7.4% spike occurred on the heels of news that should have driven oil prices lower.
Some Background
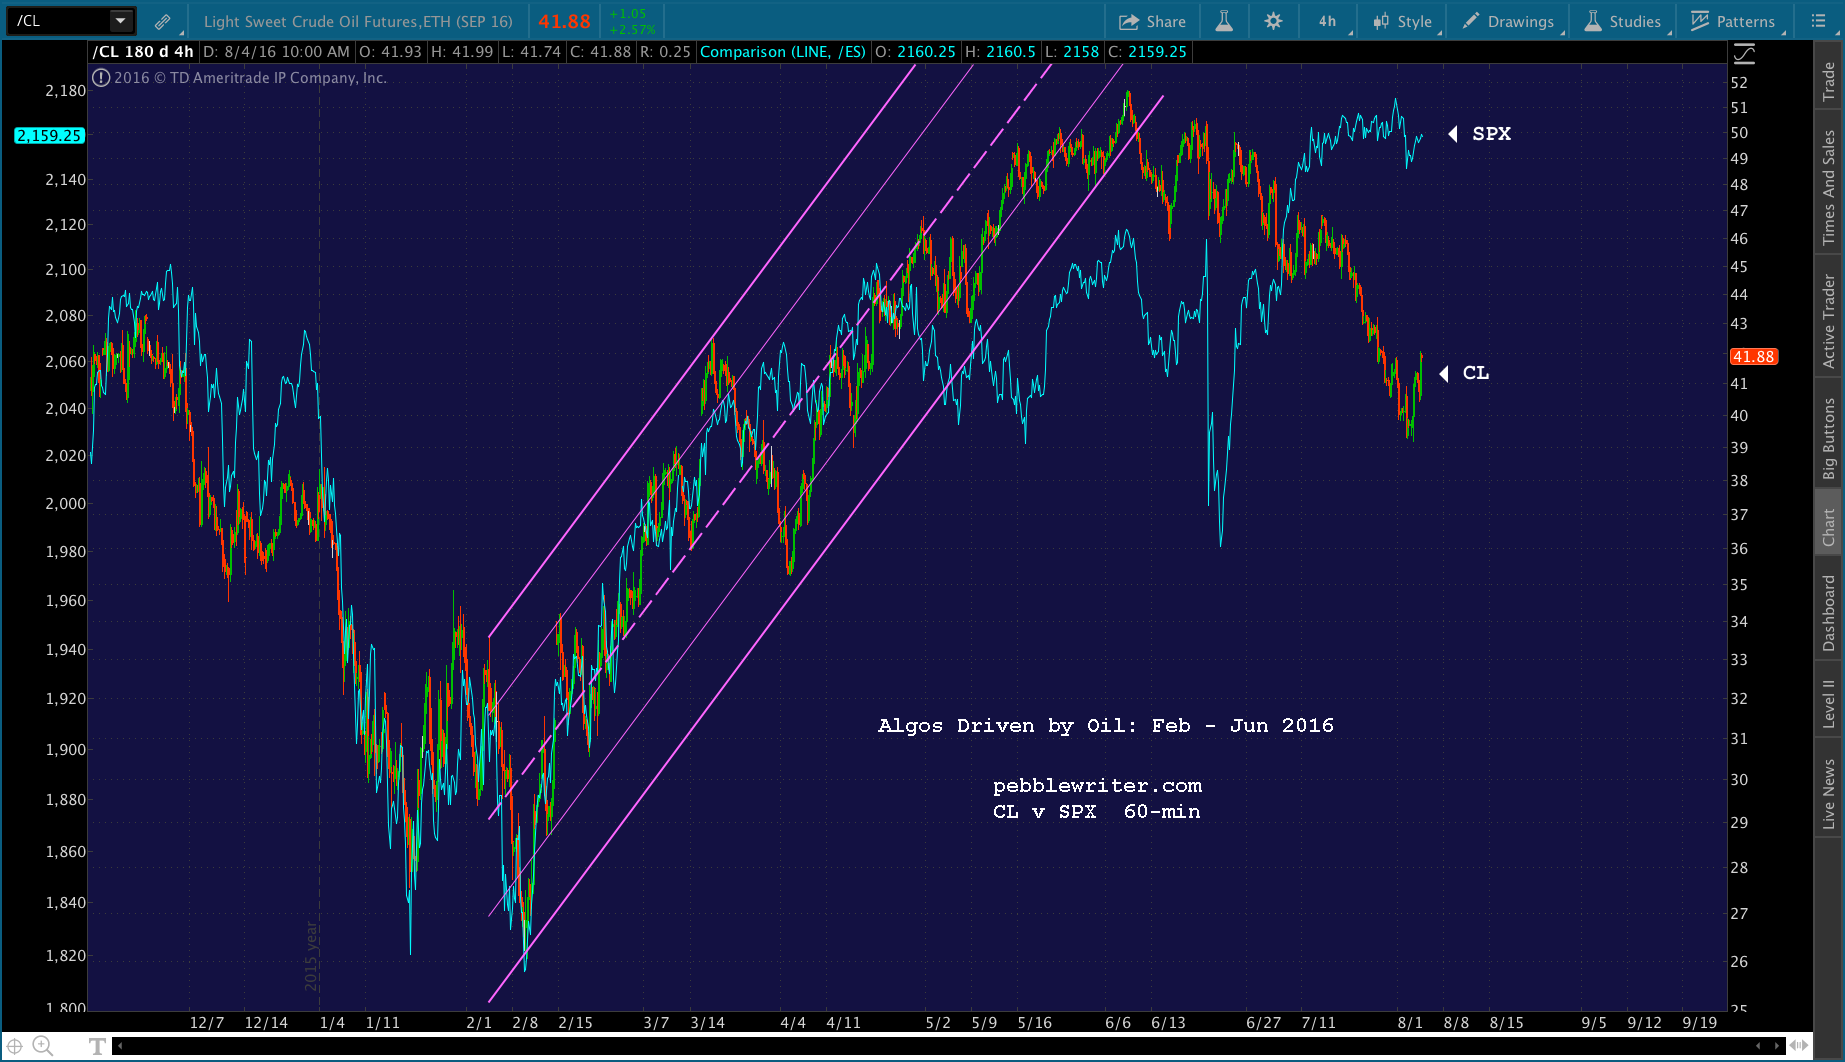
As we’ve discussed countless times, the relationship between CL and SPX has been quite strong — particularly between February and June 2016. CL doubled following its Feb 11 lows, which enabled SPX to experience an exceptionally strong recovery. After topping out in early June however, CL became a drag on SPX.
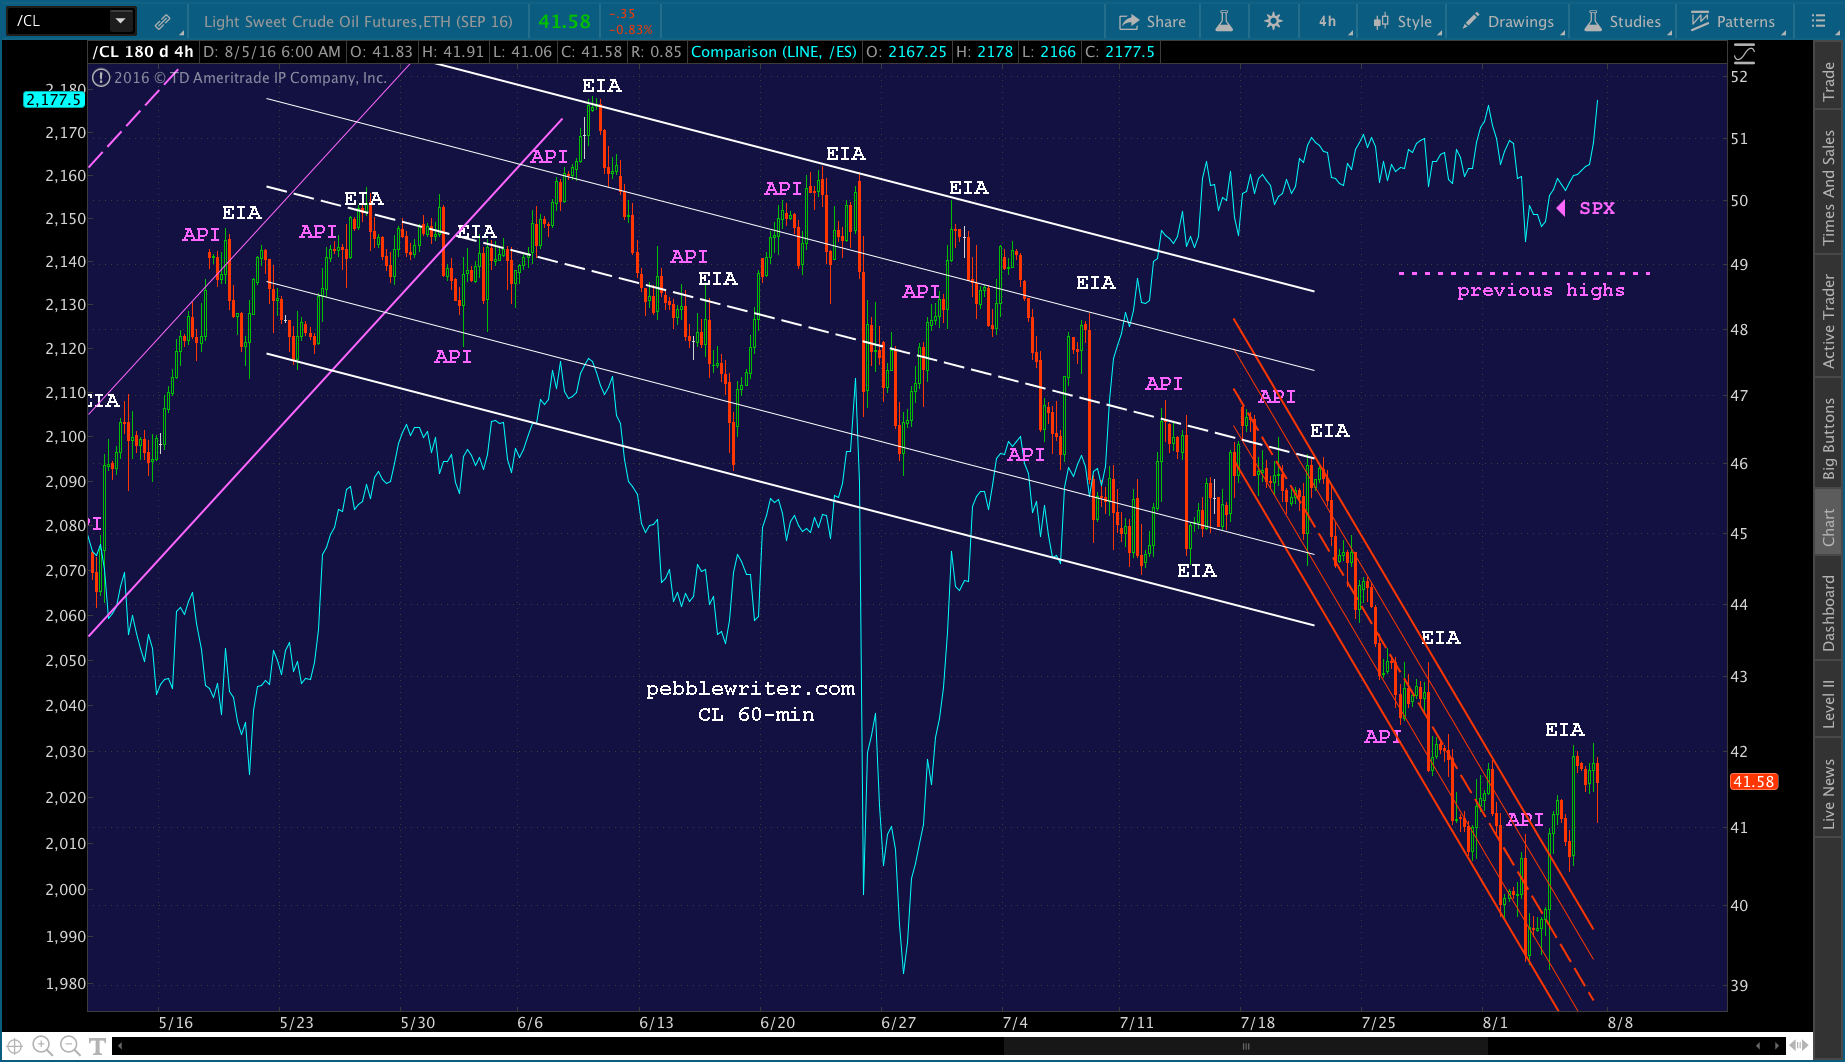
 Since then, CL has given up about 24%, dropping in a tight, falling channel ever since mid-July. Were it not for the weekly spikes prompted by goal-seeking API and EIA data, and daily intraday ramp jobs based on nothing at all, SPX would likely have followed it lower instead of pushing up past its May 2015 highs.
 So, on Wednesday, with SPX having dropped 32 points in the last two days and in danger of falling back below its previous highs, swift action was needed. It was time for a trend change. It was time to break out of that falling red channel — even if the EIA inventory news should have sent it lower.
How They Did It
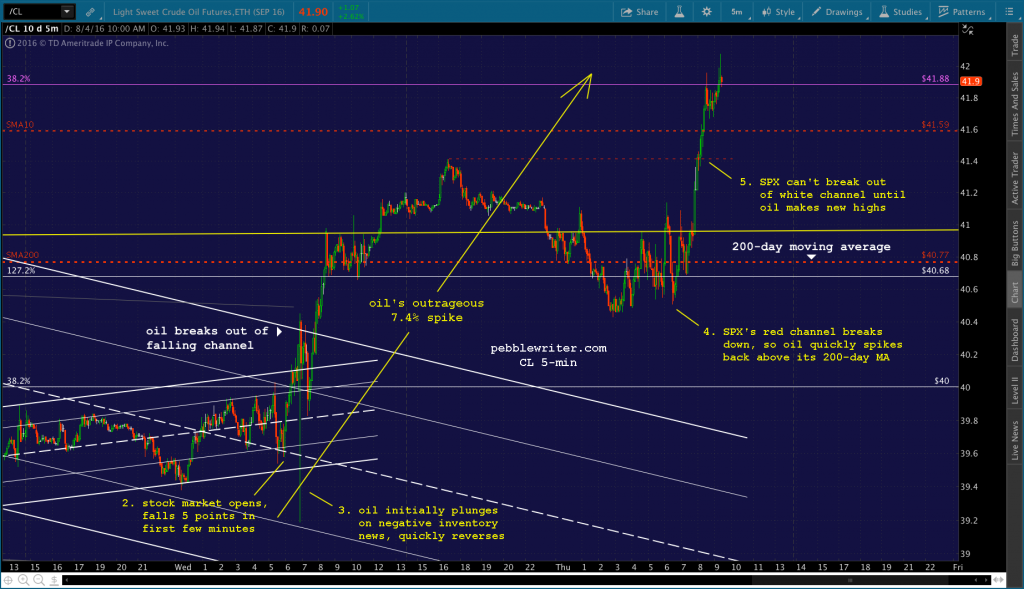
The charts below tell the whole story. We’ll walk through it point-by-point, looking at how oil futures (CL) were used to drive the S&P 500 index (SPX) higher at critical junctures throughout the day.
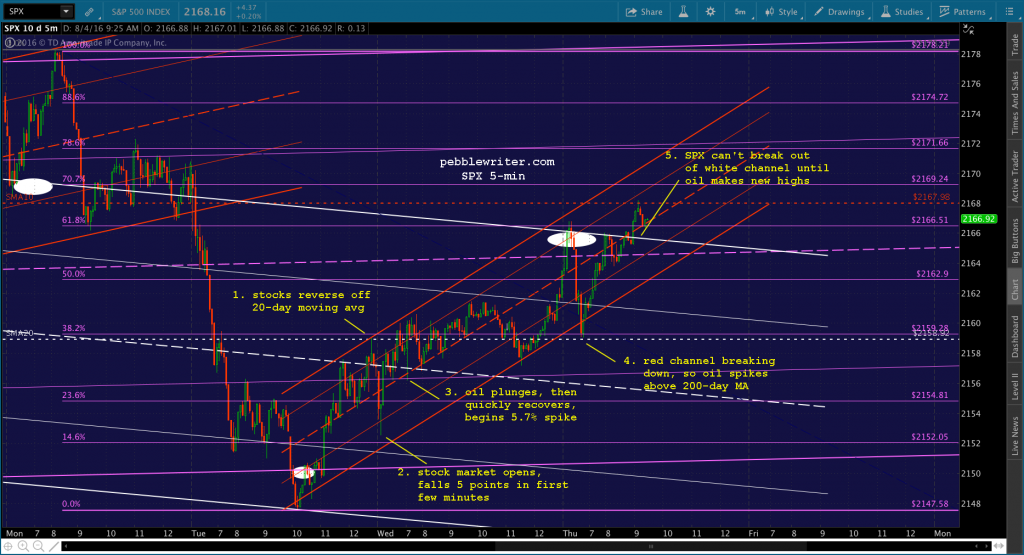
- After falling 32 points from Monday’s highs, SPX rebounded — only to reverse at the 20-day moving average (white dotted line.)
- The following morning, SPX continued falling, shedding 5 points in the opening minutes. Oil immediately started moving higher — on no news, whatsoever. This reversed SPX’s drop, sending it back above the 20-day moving average.
- The EIA’s crude oil Inventory report came out. Inventories had grown 1.4 MM barrels versus the 1.3 MM barrel contraction that was expected. Oil futures plunged almost 3% in seconds, and SPX started slipping. Literally seconds later, CL turned around and started spiking higher. Within 3 minutes, it had recovered all its losses and was making new highs. SPX regained all 4 points it had lost during CL’s drop and was soon back above its 20-day moving average again. When CL popped out of its falling channel and topped its 200-day moving average, SPX spiked higher and closed at its high for the day. CL’s gain from its earlier lows: 5.7%.
- CL settled lower overnight, dropping back below its 200-day moving average. When SPX opened the following morning, it gave up 7 points right away. It only reversed when CL started spiking higher, which it (no so coincidentally) did once SPX’s rising red channel started to break down.
- SPX popped up to the top of a falling white channel, and was having trouble breaking out. CL to the rescue again, making new highs that allowed SPX to break out of the channel. CL’s total gains since Wednesday morning: 7.4%. It produced a 16-pt gain for SPX but, more importantly, reversed a potentially damaging decline and helped it break out above overhead resistance.
 Do real investors dive in and buy up something that’s plunging in value by the second? Of course not. They wait, read the report, consider its import and draw their conclusions. Only then, if they feel prices have reached some kind of equilibrium, do they begin to build a position.
In today’s “markets,” measured judgement is hard to find. Before a real, live analyst has skimmed the first sentence of the report, the algos have scanned the entire report and placed heavy bets based on a predetermined set of criteria. This can drive prices up or down, of course.
But, when central banks have their fingers on the scale, provide floors or drive prices up through resistance, we get the sort of rebound we saw on Wednesday. Is it such a bad thing?
Why We Should Care
Gas prices matter to the average consumer. Collectively, those few cents per gallon all around the world are a tax — a drain on society — that bleeds much-needed money from consumers who are increasingly struggling to make ends meet.
If you have a nice fat stock portfolio, as I’m sure all of our readers do, you’re probably fine spending a few extra bucks when filling up. But, consider those who aren’t as well off: the families who are unable to afford a new plug-in hybrid. That few extra bucks has to come out of grocery money.
A recent Bankrate.com study showed that 63% of all Americans couldn’t handle a $500 car repair or $1,000 emergency room visit. It’s a safe bet that the same 63% aren’t very well represented among the dwindling ranks of stock market investors.
Gasbuddy.com reports that gas prices increased 40% between February and June — an untenable increase for those on fixed income, especially after dealing with rent increases that have far outpaced income growth.
Whether or not you care for the plight of those less fortunate, and whether or not you’re a fan of trickle-down economics, there’s broad agreement on the fact that the economy cannot grow if the “have-nots” don’t participate.
Based on the contraction in the rate of real GDP growth forecast by the Fed, it seems as though all the stock market gains of the past six years have done little to boost the real economy. Why, then, does the game go on?
 Where Do We Go From Here?
The Fed, ECB, BoJ, BoE and SNB are playing a dangerous game. They’ve figured out how to boost stock prices. They just haven’t figured out how to expand the global economy.
They play games with currencies, stealing a little growth from each other in a zero sum game. And, they play games with commodities such as oil, essentially stealing from the poor in order to prop up stocks. And, they drive interest rates to all-time lows and rents to all-time highs, stealing from pensioners and others on a fixed income.
How much lower can interest rates go? How much more government and, now, corporate debt can they monetize? How much more of global stocks can they purchase? In the end, it won’t make up for the fact that the excesses of 1995-2000 and 2003-2007 bubbles were never allowed to clear. Today, debt loads are even higher, made bearable only by artificially depressed rates.
I don’t imagine central bankers are proud of what they’re doing. In fact, I imagine some of them are even ashamed. They should be. Their policies prey on the weakest of us. But, at the end of the day, I think their shame is overshadowed by their fear of what might happen if they stop propping up stocks.
This week it was oil futures. Next week, it might be the USDJPY, VIX, or interest rate futures that drive algos and stocks higher. In the end, it won’t really matter to those pushing on the strings, only to those of us who must live with the consequences.