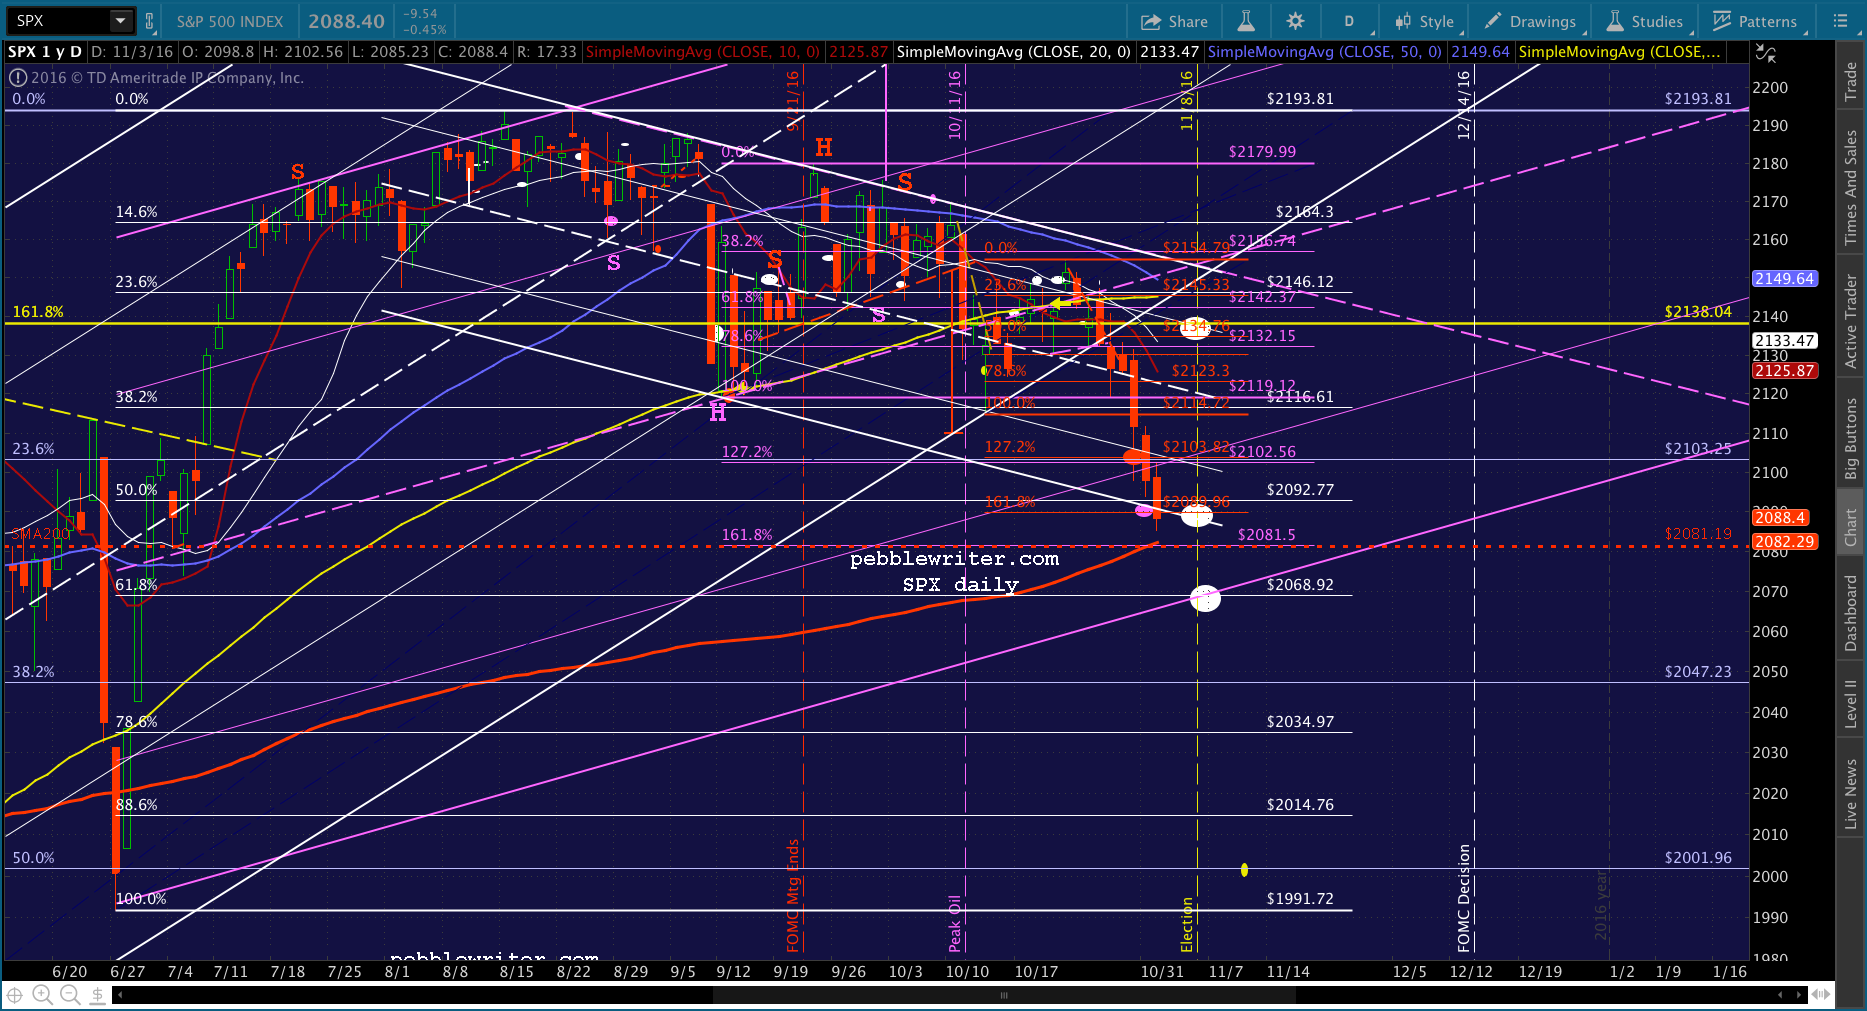
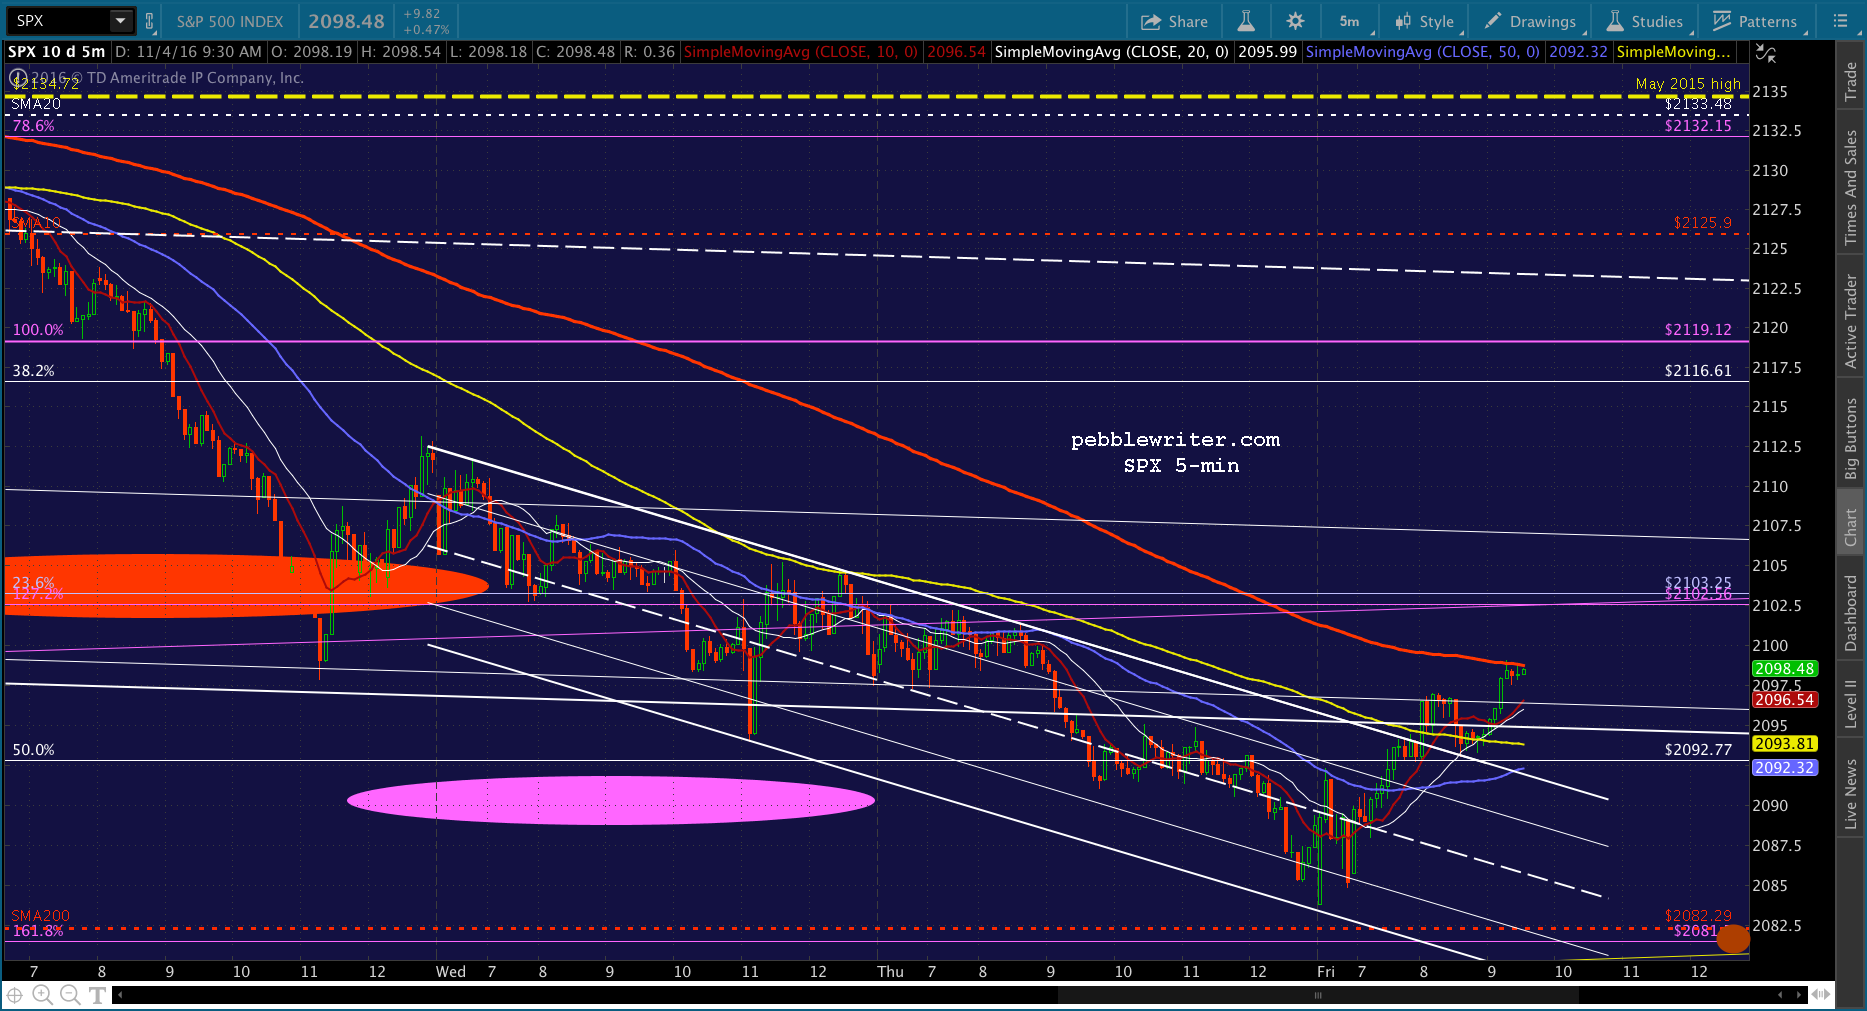
I’m traveling today, so there won’t be any intraday market commentary. SPX hit our 2103 target yesterday and got an nice bounce. All of our additional downside targets originally posted on Oct 13 [see: More Trouble for Mr Market] remain in place.
* * * * *
There are 100,000 new MBAs minted every year in the US. We all read the same textbooks. We all heard roughly the same lectures. We all learned the same formulae. So, where’s the collective groan over the disconnect between stock prices and, well, practically everything we were taught should matter?
In 2011, all that great information began to matter less and less. New, intrusive methods were used to prop up markets — and, I’m not just talking about QE. I’d like to share with you today what happened, and why I think central planners are painting themselves into a corner from which escape will be difficult if not impossible.
We have a lot of new members, so I’ll start from the beginning. If I showed you a chart like this, would you have any trouble believing the target will be hit? Of course not. A trend line is the simplest and most reliable of all chart patterns. What if, instead of a perfectly straight line, prices oscillated between two parallel lines — a channel? It’s probably not too hard to accept, either.
 A rising, consolidating pattern of incrementally smaller price increases seems, on a gut level, to represent an impending top — which is exactly what a rising wedge portends.
 Likewise, the failure of a stock to make a new high on the third try and subsequent dip below the trend line supporting it — a head & shoulders pattern — is considered a reliable bearish signal.
 Harmonics takes more of a leap of faith. But, after you’ve seen it work a few hundred times, it’s hard not to believe. The Gartley Pattern promised a reversal at the .786 Fibonacci level based on the earlier reversal at the .618 retracement of the drop from 1576 to 666. It worked nicely.
 So did the Butterfly Pattern that played out at the 1.618 extension of the 2007-2009 drop.
 If we put harmonics together with other chart patterns, we can see how they work together to offer important clues as to market direction.
 Then, there’s my favorite chart pattern: the analog. The 2007 top wasn’t that different from most. The turning points came at logical places, and I’ve labeled them as to how many days prior to or after the 1576 top they occurred.
 As everyone remembers, it resulted in a sharp downturn that lasted 17 months and sliced 57% off the S&P 500.
 Imagine my surprise when, in June 2011, I saw the same pattern setting up. It suggested a repeat performance that, were it to play out the same, would have meant new lows for stocks.
At the very least, it suggested a big drop, which I detailed in a series of posts leading up to the big event [see: Analogs.] On July 21, I wrote: “1347 might be the last best chance at an excellent short.” It topped at 1347 exactly, and 13 sessions later reached 1101.54. It was both exciting and unnerving, as all those formulae and all those lectures never touched on anything like this- this- what the hell was it? Black magic? Witchcraft?
Of course, I owe pebblewriter.com’s creation and subsequent success to this analog playing out and making a lot of people a lot of money. But, there was a dark cloud behind the analog’s success. It broke.
 I wish I could say I knew right away why it broke. But, it would take me many months before I fully understood the mechanism and the degree of manipulation involved.
Back then, even using the word “manipulation” was enough to make people slowly edge away from you at cocktail parties. Talking about the yen carry trade would get the door locked behind you when you stepped outside for a moment.
For the uninitiated, the yen carry trade might be explained from the BoJ’s standpoint thusly:
You can borrow all the money you want at near 0% interest, and you can pay it back at a steep discount. In the meantime, you can invest those borrowings in stocks that we guarantee will appreciate — because we’re buying them, too.
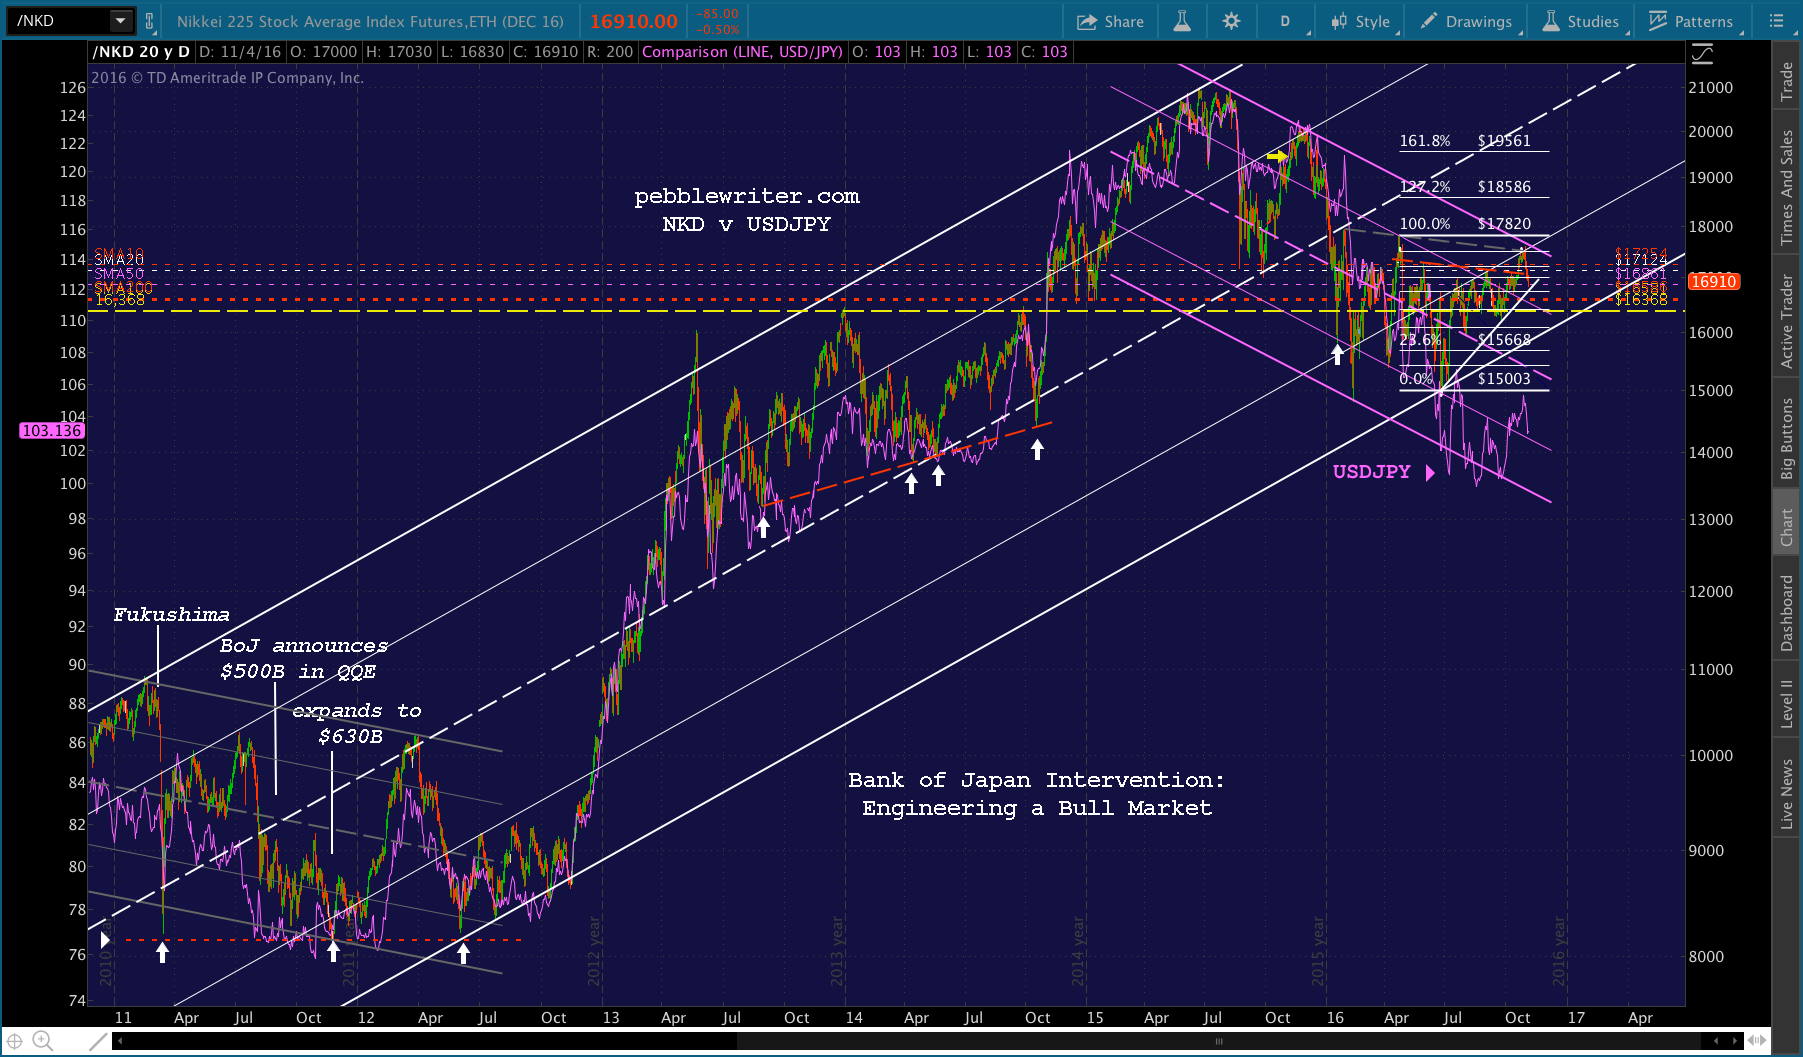
 It took a while to get going, but it worked like a charm. When the USDJPY bottomed and started to break out, the analog was busted. As USDJPY rose from 75 to 100, SPX ratcheted up to new all-time highs.
There was a problem, however, with USDJPY’s continued rise. Remember, as the yen gets cheaper, it buys less of those things that Japan imports — especially food and oil. Oil was particularly a problem, as it’s priced in US dollars and the country had shut down all its nuclear reactors in the wake of the Fukushima disaster.
 So, isn’t it a coincidence that oil began crashing on August 14, 2014 and USDJPY broke out on August 18, 2014? The yen’s subsequent 25% depreciation was easily offset by oil’s 61.8% plummet. And, it wasn’t even done.
to be continued…


 It’s not such a big deal to lose 50-100 points if it’s from 64 points higher in the first place. And, that’s exactly what we’re seeing this morning — except that TPTB learned another lesson from Brexit. The damage control has been so effective overnight that the futures have already bounced 73 points off their overnight lows.
 The world has changed. Investors will care. The question is whether VIX and the other tools central banks have at their disposal will be enough to prevent serious fallout as they did with Brexit.