Year: 2014

  • Charts I’m Watching: May 27, 2013

    Holiday weekend + Tuesday + 1900 barrier broken = strong ramp.  NKD hit an imporrtant Fib level and the SMA100, but is probably aiming for the SMA200 and purple .618 combo at 14787/14796.  At some point, folks will start to realize the yen carry trade is nearing an end.

    2014-05-27-NKD 60 0500

    While, USDJPY features a nice Fib target of the combination red .618/blue .886 at 102.18 — just below the SMA50 at 102.22.


    2014-05-27 USDJPY 60 0545

    What does it mean for stocks?  continued for members… (more…)

  • Charts I’m Watching: May 23, 2014

    Remember, no POMO today.  Our thesis about NKD was weakened as it popped a bit overnight.  There is still overhead resistance and a rising wedge, but not as compelling since it exceeded the 5/13 high.

    2014-05-23 NKD v ES 0600

    Likewise, USDJPY was ramped a bit after the close yesterday, fell during Tokyo trading, and was ramped again after their market closed — testing the SMA20.

    2014-05-23 USDJPY 30 min 0615

    The near-term bounce should continue, but there remains the issue of the broken grey channel bottom and all those bearishly-aligned moving averages…

    2014-05-23 USDJPY daily SMAs 0615

    …not to mention decent channel resistance.

    2014-05-23 USDJPY daily 0615

    The e-minis have gone essentially nowhere after selling off at the close.

    2014-05-23-ES 15 0557

    While ES tagged its .886 yesterday, SPX never reached its.  So, we could see another cycle up powered by USDJPY.  The only problem is e-mini buyers are reluctant to bid up over 1894.  By my calculations, getting SPX to 1897.63 will require ES reaching roughly 1895. Who’s going to bite the bullet?

    It’ll take a big spike in USDJPY — pushing through the SMA20 at 101.92? — which normally would have occurred at 15-30 minutes prior to the close yesterday.  HP’s goof seems to have put a damper on the normal algo action.  Now…they’re a bit confused.

    Back in the old days, before the word “market” required quotation marks, this wouldn’t be an issue.  Investors would look at things like earnings, the economy, geo-political events, etc and decide whether they justified higher prices.

    I suspect it’ll happen, and what better time than a holiday weekend?   Low volume and minimal attention from real investors can work wonders — especially when the land of milk and honey lies just beyond 1900.


    GLTA.

  • Charts I’m Watching: May 22, 2014

    The problem with bubbles is you have to decide whether to look
    like an idiot before they peak, or look like an idiot after they peak.

    John Hussman

    The Nikkei has been repeating a clear pattern for many months, now.  Each dip to the neckline of a large H&S Pattern has bounced back to a falling trend line — typically to whatever Fib level intersected with the TL.

    2014-05-22-NKD daily

    Monday, NKD bounced off the neckline again.  It got a great boost from USDJPY’s reversal off the SMA200.  And, today, it has retraced .886 of its last decline.

    2014-05-22-NKD daily CU

    Why does it matter?  continued for members(more…)

  • Charts I’m Watching: May 21, 2014

    Abe confirms no increase in QQE for now, so a measly ¥70 trillion per annum still.  The USDJPY wasn’t thrilled at the news, and traded down through the SMA200 yet again — this time testing the Feb 4 lows.

    Needless to say, the lack of increases in QQE doesn’t mean the BOJ won’t work to cheapen the yen anymore.  And, they’re keenly aware of the technical picture.  So, I’ll be very surprised if they don’t get the pair back to the SMA200 in short order.

    2014-05-21-USDJPY 15 min 0537

    After that, who knows?  The SMA10 intersects with the .382 Fib at around 101.66 — slightly higher than the old high.  It would allow ES to make a new high as well, maybe tag the .786 at 1890ish.

    From here on, it’s all about threading the needle between too high a yen (hurts exports) and too low a yen (imports too expensive.)

    UPDATE: 9:00 AM

    Just broke through and tagged the yellow channel midline, should at least backtest here.  ES tagged the SMA20 in the process.  Could be a very whipsawy day, with Fed minutes and govspeak coming up.  But, the bottoming candle on USDJPY should be quite bullish for stocks — if it holds.

    2014-05-21-USDJPY 15 min 0600

    UPDATE:  3:10 PM

    Everything responded negatively to the minutes except for stocks, which soldiered on, propped up by the PPT as proof that nothing the FOMC has planned could ever possibly hurt stocks.

    TNX was propped up until its close, but clearly has closing this morning’s gap in mind.

    2014-05-21-TNX 5-min 1207

    USDJPY dropped like a rock…

    2014-05-21-USDJPY 5-min 1207

    The 10-yr spiked higher…

    2014-05-21-ZN 60-min 1153

    But, ES was unphased as the PPT was buying with both hands.

    2014-05-21-ES 5 1156

    Yet another tag for NDX on the neckline that just won’t die.

    2014-05-21-NDX 60-min 1207

    UPDATE: EOD

    The rising ES channel (purple) contrasted with the falling USDJPY channel (red.)  We’ll watch to see if USDJPY can get back above the yellow channel midline after it digests its gains in the after-hours.

    2014-05-21-ES v USDJPY

  • Charts I’m Watching: May 20, 2014

    It’s not Home Depot.  It’s not the Keystone pipeline (though you gotta love Rick Perry’s new nerdy specs — pushup bra for the brain?)  It’s not housing.

    Thailand is under martial law, and the bhat ain’t looking so hot.  Note the central banker prop job in play in the chart below.

    2014-05-20-THBJPY daily 0740

    The yen is the flight to safety for Asia — and, a sinking USDJPY damages the yen carry trade.

    2014-05-20-USDJPY 5min 0715

    USDJPY quickly gave back .786 of its gains from yesterday morning (while ES fell .382.) The .886 is right alongside the SMA200 — a drop below would be quite bearish for stocks.  Though, the BOJ is almost certain to intervene.

    Keep an eye also on the 10-yr.  Yields fell 27 bps on the opening.

    GLTA.


  • Propping up the Markets

    We talk a lot about the markets being “propped up.”  It’s not just an expression, as the following charts for the Nikkei, USDJPY, DX and 10-yr note will affirm.  In fact, even a casual glance at the charts below should destroy any notion that these are “markets” any more at all.

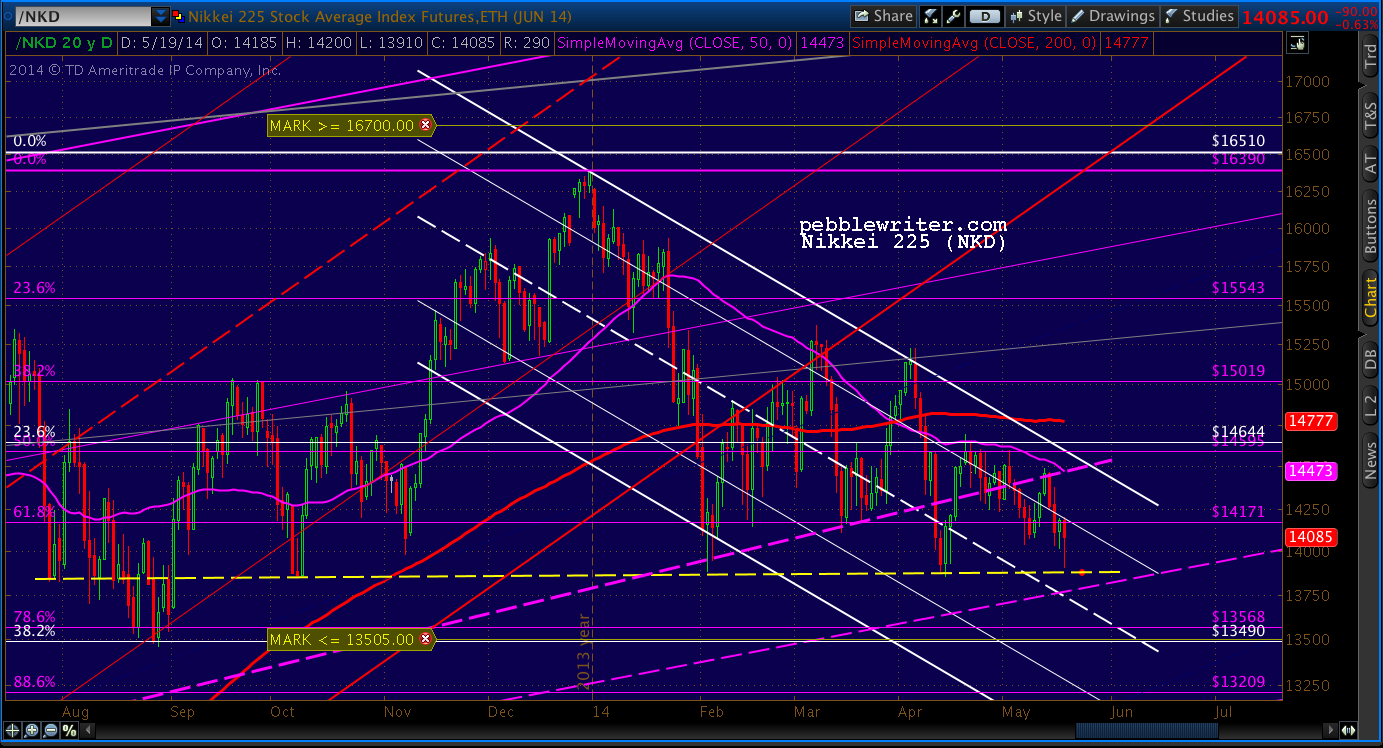
    Note the dashed, yellow neckline on NKD — even following the death cross back on Mar 28.

    2014-05-19-NKD daily 50-200

    USDJPY, likewise, has been propped up above the Feb 4 lows, with seven stick-saves off the dashed yellow neckline.  The SMA200 finally arrived today to lend additional support.

    2014-05-19-USDJPY daily 0552

    The dollar’s latest death cross came way back in September.  But, it has been propped up at roughly 80 at least a dozen times since late 2011.

    2014-05-19-DX daily 50-200

    The 10-yr’s rising red channel midline gave up the ghost on Apr 9 following its death cross on Apr 3.  Since Thursday, it has been propped up above the TL connecting the July and October 2013 lows.

    2014-05-19-TNX daily CU

    Each of these critical components of the yen carry trade are due for another bounce, providing a boost to stocks — which is, after all, the object of the whole exercise.

  • Why a Lower 10-yr Note is Bearish

    It does get tiresome, the talking heads blathering on about the signals being sent by the bond market — whether lower rates reflect a better economy, worse economy, or simply Fed tapering.  The bottom line?

    As we pointed out way back in December, a plunging 10-yr has correlated with lower stock prices ever since Jan 2000.  The chart below reflects the two big declines — 48% and 52% — associated with TNX’s reversals off the white channel top in 2000 and 2007.

    2014-05-19-TNX v SPX w notes

    I wondered months ago whether we might get back up to the top of the channel by May in order to catch its intersection with the yellow .618 at 38.18.  But, a casual glance reveals that ship has probably sailed.

    Since last departing the white channel top in 2007, the tops have come instead at the falling trend line (dashed yellow.)

    2014-05-19-TNX v SPX CU

    While not as spectacular as the declines at I and II, the declines at (a) and (b) were pretty significant at 15 and 20% respectively.  TNX even traced out a third derivative — the steeper yellow trend line that produced drops in SPX of 10 and 9% (1 and 2.)

    TNX got back up to the trend line off of 2007 on September 5, 2013 — at which time stocks might have reversed had not a series of ramp jobs and coordinated dip buying kept them inching higher.  On Dec 18, the day SPX spiked higher on news that the taper would in fact occur (the most bizarre PPT action in recent memory) TNX actually popped up above the yellow TL, only to fall back below it two weeks later.

    2014-05-19-TNX daily CU

    Since then, it has managed to leak lower as stocks (but, not the SPX or DJIA) have stumbled.  It was badly damaged by the death cross on Apr 2 and plunged through the red channel midline (red, dashed) a few days later.  Note that the midline is highly evocative of the necklines on NKD and USDJPY.

    Last Thursday, it found support at the TL (purple, dashed) connecting the July and October 2013 lows — although it briefly dipped below the October 23 low.

    It wouldn’t surprise me — especially if USDJPY gets a good bounce off its SMA200 — to see TNX also bounce higher, perhaps to close the May 14 gap at 26.11 (also the SMA20 in a day or two.)  But if it dips below 24.71, the downside should be significant — to TNX and to stocks.

    For the record, I don’t believe much lower rates — if they arrive — will be driven by supply and demand, higher or lower GDP, etc.  I think they’ll be driven by a flight to safety as investors flee a stock market meltdown.

  • Update on NDX: May 19, 2014

    Warning to small-cap bears… NDX is a handful of points from completing an Inverted Head & Shoulder pattern targeting 3822 on the daily chart.  The only catch…it’s tagged the same neckline three times before — all with no follow-through.  So, watch out for another possible head-fake.

    2014-05-19-NDX daily 0830

    Note that if it plays out (if USDJPY gets a big bounce here at its SMA200) then the white 1.272 should also get a tag — leaving the larger scale .786 (of the crash from 4816 in the year 2000 to 795in 2002) up at 3955 as the next major target in, say, August.

    2014-05-19-NDX daily 0920


    IH&S and H&S patterns have very consistently failed for many months now — yet another signal that the “market” hasn’t been playing by the normal rules.  Normally very reliable patterns (bearish ones, in particular) have been very unreliable.  TPTB are doing everything in their power to convince traders to stop shorting the market, and simply start buying the dips along with everyone else.

    I suspect that only when this capitulation finally occurs, it’ll be time for a serious downdraft.

  • Update on COMP: May 19, 2014

    The NASDAQ is threatening to break out of the malaise it’s been in since the yellow channel bottom broke on Apr 14.  It got a nice bounce off the SMA200 on Apr 15, and has since been dancing around the SMA10 and 20.  The bulls no doubt have their eye on backtesting the yellow channel way up at the grey .886 (4323) should the USDJPY cooperate and provide a huge bounce off its SMA200 (tagged it earlier today.)

    The more immediate resistance will be provided by the SMA50 at 4159 and the SMA100 at the previous high of 4177 — provided it can break out of the falling white channel.  If it fails to, then the SMA 200 is right back in focus.

    2014-05-19-COMP daily 0900

  • Charts I’m Watching: May 19, 2014

    As expected, USDJPY traded down to the SMA200 in after-hours trading — tagging the .886 of the bounce off of 101.746 in the process.  TPTB will no doubt do their best to prop it up, but this represents a critical support level that, if broken, opens up a can of whoop-ass on the bullish thesis.

    2014-05-19-USDJPY daily 0552While we suspect there is more downside ahead, it would be silly not to watch stops here.  Traders might wish to try a long position and see if the flatline of the past three months is sending a message.

    ZN has remained stubbornly above the .618 we discussed last week, leaving open the possibility of much lower rates in the 10-yr as the short squeeze continues.  In yield terms, 24.71 is the important level.

    2014-05-19-ZN daily 0552

    With the war drums and really dreadful economic data coming out of Southeast Asia the past few days, look for both to continue their trends.

    UPDATE:  9:50 AM

    ES just took a run at the SMA10…

    2014-05-19-ES 5 min 0653

    …motivated entirely by the one-way influence of the USDJPY.  Rallies in USDJPY are magnified in ES to the upside.  Declines are ignored.  This is usually confined to the after-hours, but TPTB are (rightly) worried about the implications of the broken SMA200, and are obviously bringing the PPT online.  Remember, today is a POMO day ($1.8 billion, in order to “boost employment” of course.)

    [For more on the all-important carry-trade, see: https://pebblewriter.com/why-are-stocks-rising/]

    2014-05-19-ES v USDJPY 5 min 0653

    Lots of leaks in the dikes this morning…will there be enough fingers to plug them all?

    There’s a lot of talk about SPX dipping down and tagging the SMA100 — currently at 1847.44.  I agree it’s likely, but if TPTB have their way, they’ll probably delay it just a bit.  At current prices, it would represent a lower low than the Apr 28 low of 1850.61.   Note that it would also represent a tag of the .618 of the run up from 1814 (Apr 11) to 1902 (May 13.)

    2014-05-19-SPX daily 0755

    In a few days, however, the SMA100 will be above 1850.61, and a reversal off it would represent a higher low — helping to bolster the bullish case.  It’s exactly the sort of crap they like to pull — as evidenced by the “new high” established on May 13.  In an unmanipulated world, SPX would be tagging 1800 today — the .618 retracement of the series of ramp jobs following the Feb 5 lows.

    2014-05-19-SPX daily 0800