Year: 2014

  • Charts I’m Watching: Jun 24, 2014

    USDJPY, pushing up against a bearishly aligned SMA10 but in a fairly well defined rising channel, is looking weak this morning…

    2014-06-24-NKD daily 0600


    … though NKD is ignoring it for the moment.

    2014-06-24-USDJPY 60 0546

    If they can both hold their rising channels, equities should tag along.  ES has dropped out of the rising white channel, but that hasn’t mattered much lately as NKD/USDJPY can negate just about any resistance — technical or otherwise.

    2014-06-24-NKD ES 0630

    UPDATE: 11:00AM

    USDJPY to the rescue yet again.  Note the spurts higher it makes, dragging ES up through what would have been harmonic resistance back when stocks used to correct every once in a while.

    2014-06-24-USDJPY v ES 1 min

    USDJPY should be able to let some air out, maybe backtest some of the broken SMAs, as NKD has elevated to the .886 and is likely to stay there — or higher — until the close.

    UPDATE: 12:15 PM

    What happens when ES threatens a move lower?  It ticked down 0.25 points a moment ago…

    2014-06-24-ES 1 min 0916

    …triggering this immediate response from USDJPY…

    2014-06-24-ES 1 min 0916

    …and NKD.

    2014-06-24-NKD 5 min 0916

    UPDATE:  1:50 PM

    Live by the sword…

    Real live downside in stocks after the 2-yr auction belly-flopped.  Stick save (so far) courtesy of NKD.

    2014-06-24-NKD 15 min 1047

  • Charts I’m Watching: Jun 23, 2014

    USDJPY continues to be boxed in between lots of overhead pressure, including the daily cloud, and the SMA200.  The 15-min chart shows a triangle setting up, reflecting the likelihood of a directional breakout soon.

    2014-06-23-USDJPY 15 0615

    Bonds have been a pretty indicator of equity moves in the past, but have lost some predictive ability as prices are currently rising in concert with stocks.

    2014-06-23-ZN v ES daily

  • Charts I’m Watching: Jun 20, 2014

    Quad-witching day, but no POMO.  Should be interesting…

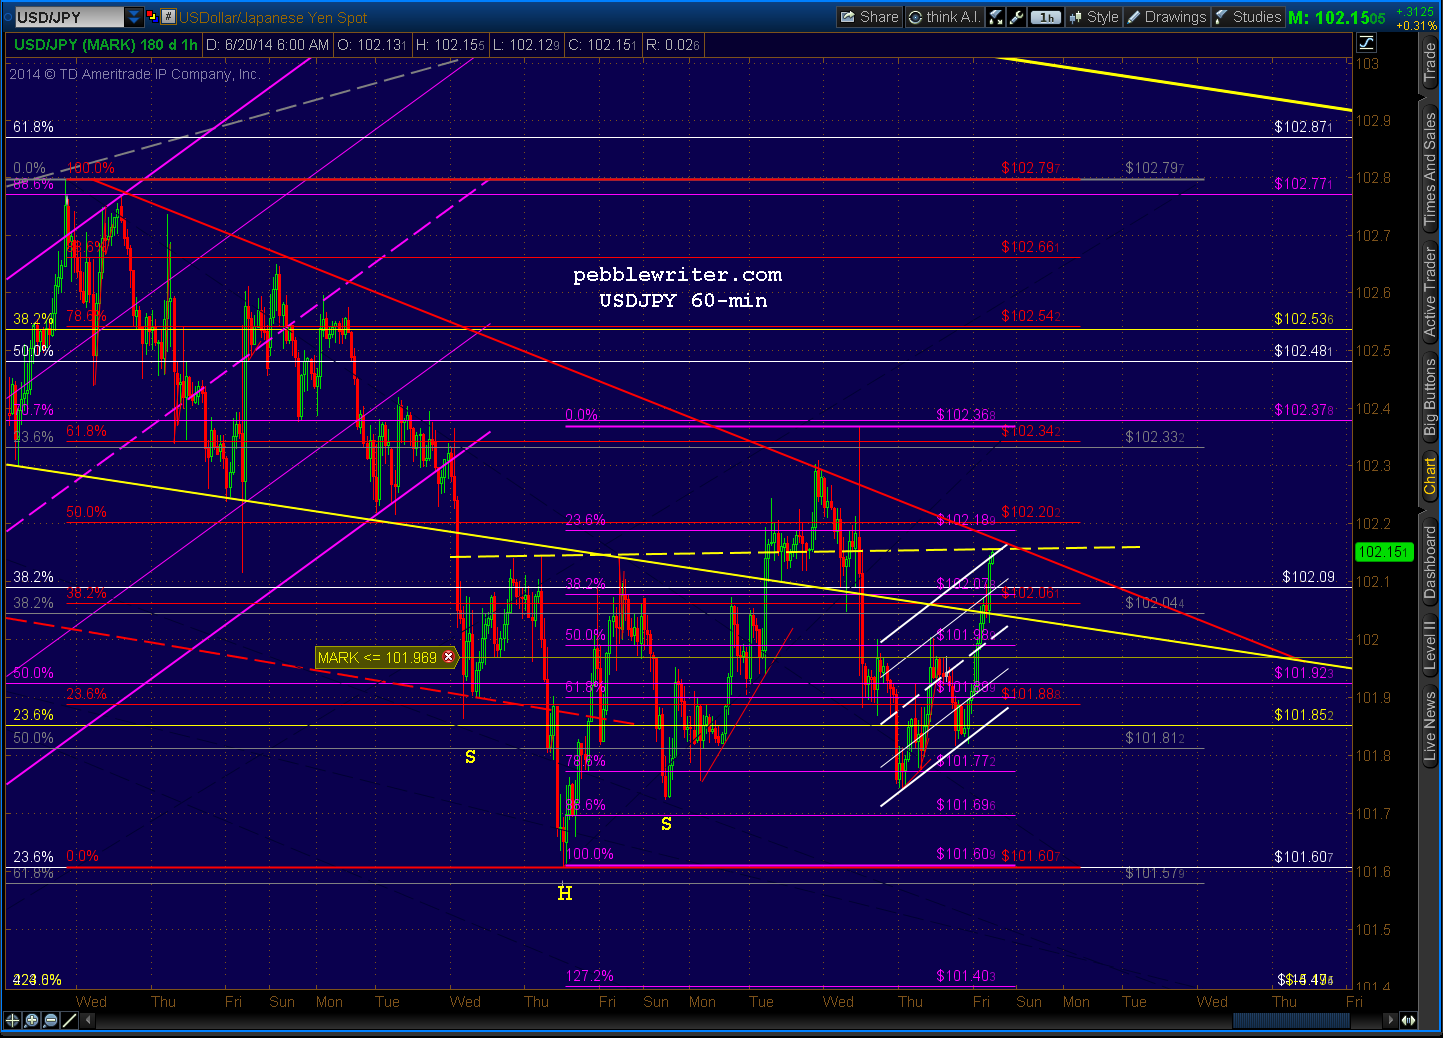
    USDJPY is threatening to break out, but neither IH&S has played out yet.  A break above the red TL/yellow neckline should be eventful for stocks.  A potential run up to the .786 or .886 should usher in new highs.


    2014-06-20-USDJPY 60 0600


    If USDJPY reverses off this resistance instead, stocks could flesh out one of the rising channels.  Yesterday was one of the few days lately when SPX didn’t exceed its .886 on the day (after the previous day’s FOMC rally.)

    2014-06-20-SPX 15 0600

    Someone forgot to turn on the Dow’s algos, which didn’t share SPX’s enthusiasm for Yellen’s non-answers.

    2014-06-20-DJI 60 0600

    UPDATE:  EOD

    Pretty weak close.  Equities tried to rally at the close with the usual VIX monkey-hammer, but couldn’t even top the session’s earlier highs.  USDJPY was no help at all, failing in the crucial last hour or so after topping the neckline earlier in the day.

    USD weak against the euro, too.  Could the rest of the world’s efforts to ditch the USD as reserve currency be bearing fruit already?  Very interesting…

    2014-06-20-USDEJPY 15 1300


  • Brave New World

    It’s hard to watch these Fed things anymore.  The FOMC knows all too well the damage it’s doing to market integrity.  But, it has no choice, given that higher interest rates or a serious correction would nuke the economy.  We, as a country with $17-18 trillion in debt (actually $60 trillion), can’t afford higher rates.  And, global financial institutions, with $1.5 quadrillion in derivatives, can’t afford another market meltdown.

    This brings me back to Japan.  I focus on Japan so much because the US is heading down the exact same path:

    • central bank suppressing interest rates out of necessity
    • central bank supporting equity prices
    • no mathematically viable exit, as the growth in debt is exponential

    The talking heads are right in the sense that Yellen’s comments are bullish for stocks.  She brushed off inflation as “noise” and complacency/over-valuation as non-existent.  Investors are right to expect no tightening anytime soon.  So, the only risk to markets is, theoretically, from macroeconomic, geopolitical, or earnings surprises that are so significant that TPTB can’t quickly counteract their effects on stock prices.  Think another Lehman, Fukushima, oil shock, war, etc.

    BTW, these things are happening now.  There are numerous Lehmans in the world, but they are being propped up by central banks rather than being left to fail.  Fukushima isn’t fixed, even though the mainstream media pretends it is.  An oil shock is a pretty good bet — with crude light already up 20% since January.  And, wars…take your pick.

    The “market” simply doesn’t care anymore.  Dips are quickly bought, crushing short sellers.  Nightly ramp jobs keep things on an upward trajectory.  And, the yen carry trade is always available to ramp up prices for no reason whatsoever at any time.

    2014-06-19-SPX log chnls

    Like the FOMC, the BOJ effectively buys all new debt issued, keeping interest rates near zero.  And, they’ve demonstrated their willingness to not let the USDJPY drop below 101, nor the Nikkei below 14,000 (they hold 4 trillion yen in stocks now and are adding another trillion per year.)

    It’s not so much a market anymore, but a slot machine with a guaranteed payout.  TPTB will let the air out when they feel like it, and are correctly positioned in advance.  This cartoon posted 4 years ago has proven to be the best prognosticator of market behavior around.  BTFD indeed.

    We can’t know when the music will stop, only that it will.  With extremes in sentiment, margin debt, P/Es, volatility (lack thereof), it’s pretty apparent that something wicked is waiting in the wings.  VIX under 10 is a pretty good sign.  There are many others.  And, given the extent of the runup and the quadrupling of the derivatives market since Lehman, the unwinding will be much, much worse.


    2014-06-18- VIX 60 1300


  • Charts I’m Watching: Jun 18, 2014

    Fed announcements and press conference today, so the market should bounce higher afterward regardless of the results.  Remember, it’s the illusion that’s important — that whatever they announce is great news.  Doubters, check the market’s reaction on Dec 18 to Yellen’s confirmation that the Fed would, indeed, taper.

    Speaking of illusions, the BOJ pulled a doozy last night.  Stocks soared and the yen fell after more dismal economic news.

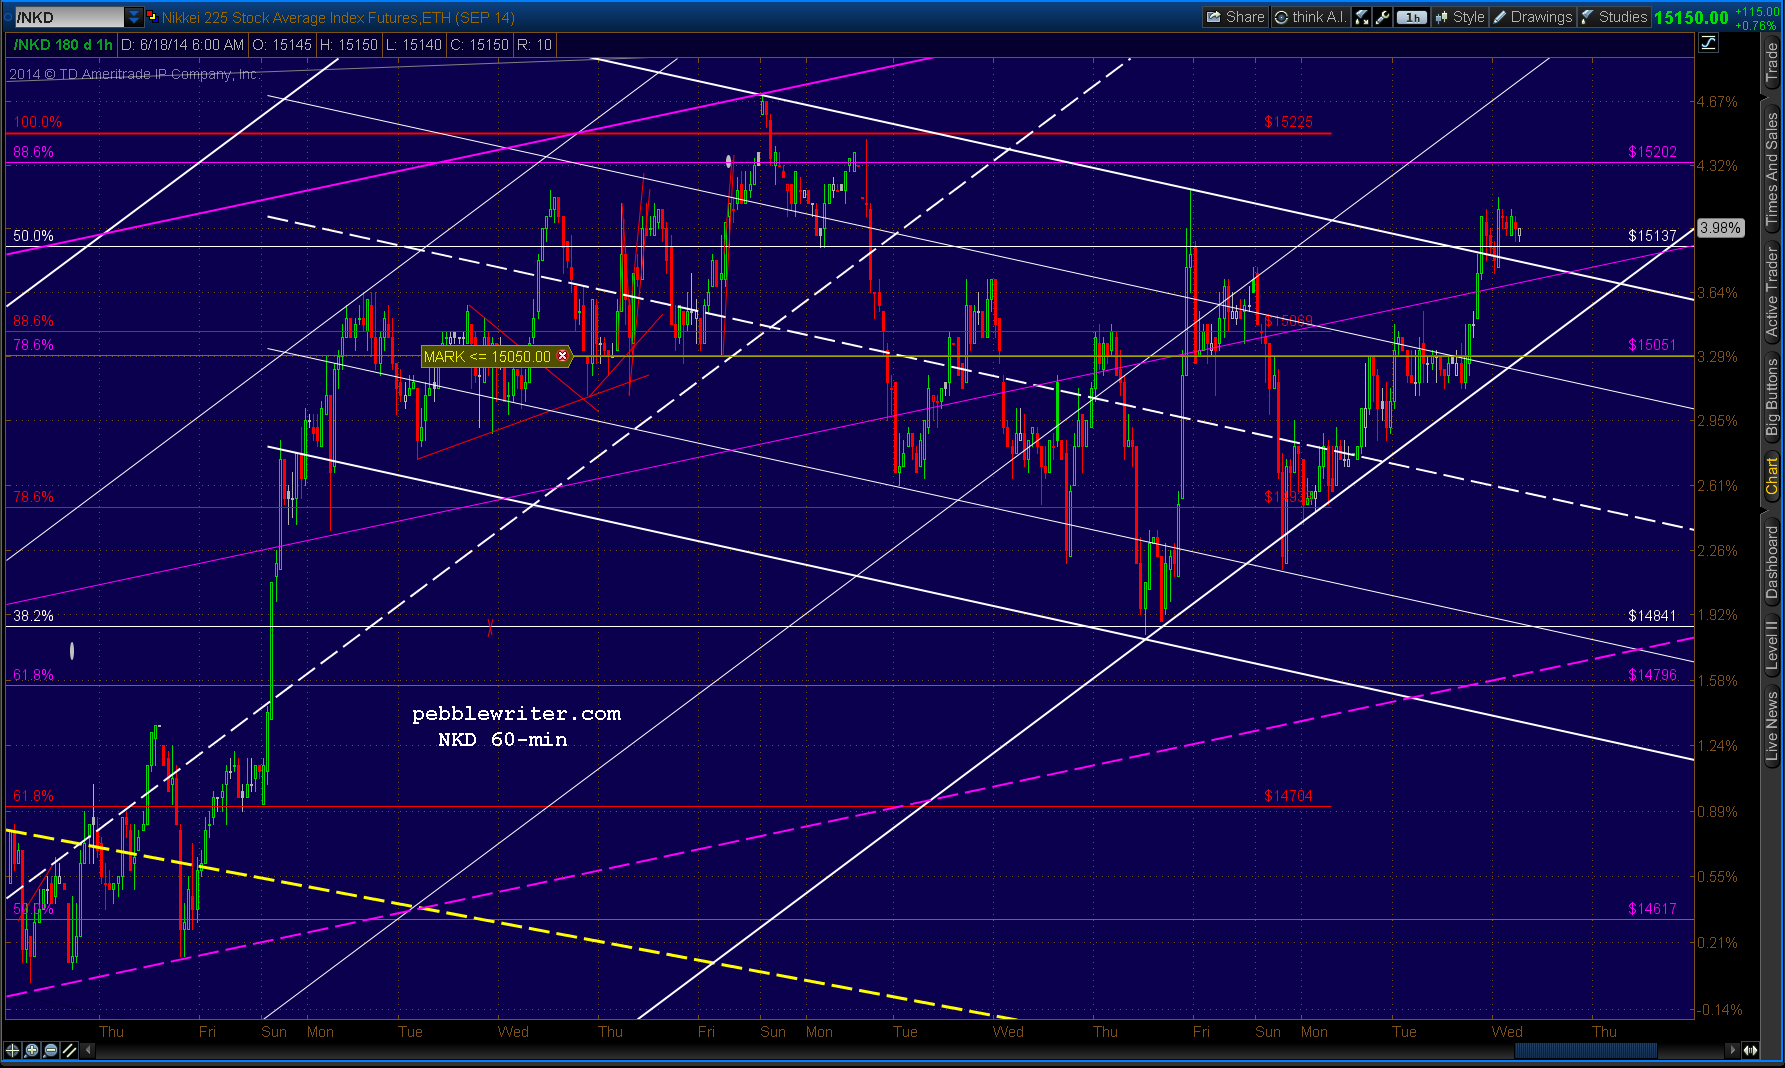
    2014-06-18-NKD 60 min 0615

    Many have noted the IH&S on the USDJPY — which certainly could play out.  Worth watching…

    2014-06-18-USDJPY 60 0615

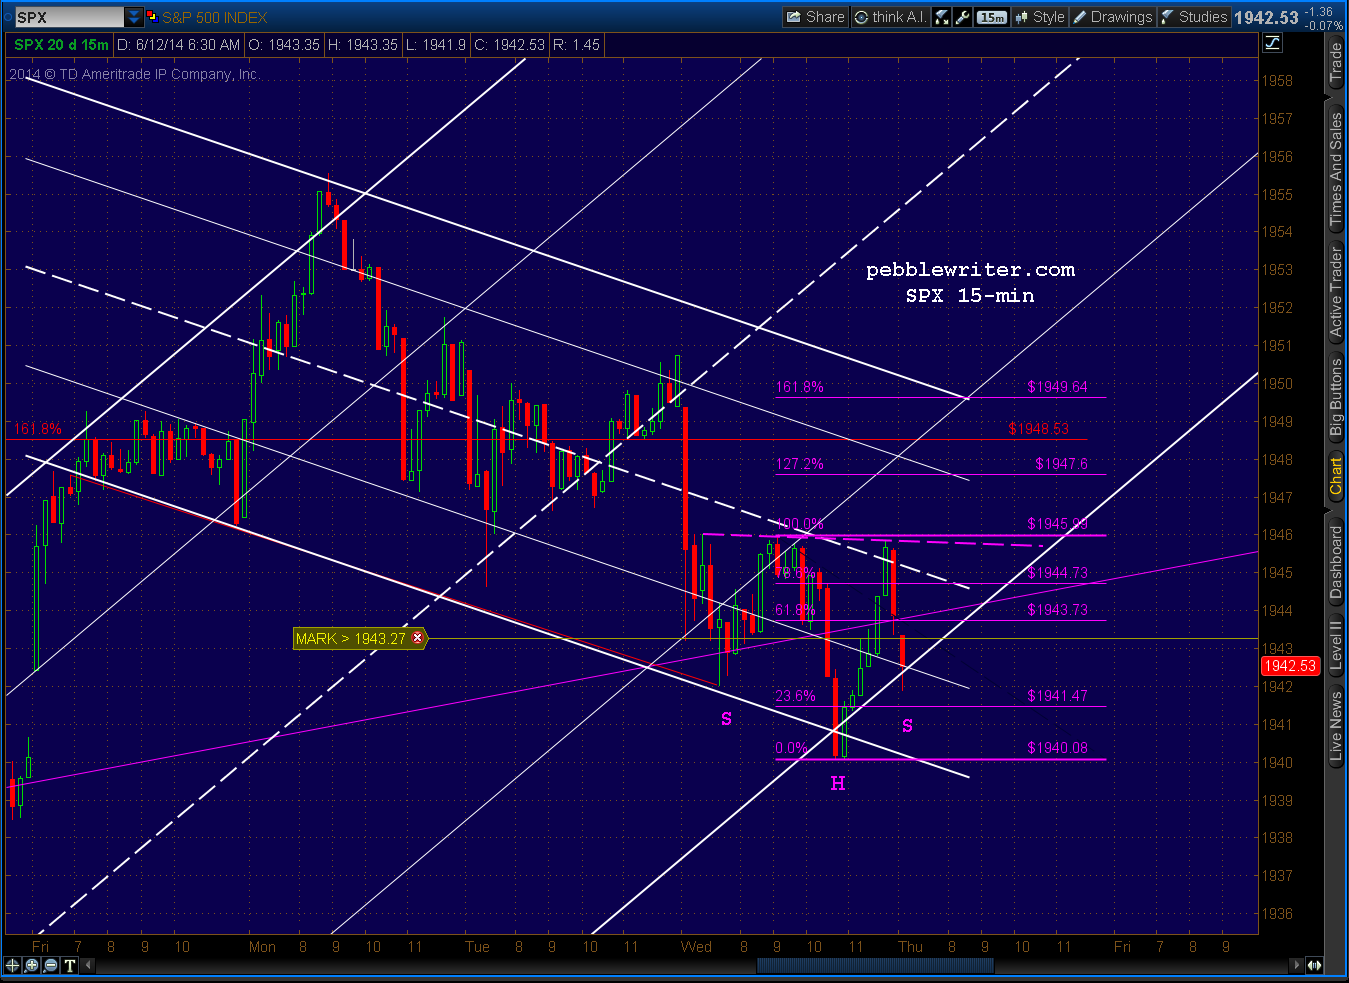
    US stocks are. so far, ignoring the fact that mortgage applications fell 9.2% last week — supposedly due to a 2 bps increase in rates.  SPX has TL resistance at 1944-45, in the vicinity of the purple .618 at 1944.18.

    2014-06-18-SPX 5 0635

    UPDATE: 11:50 AM

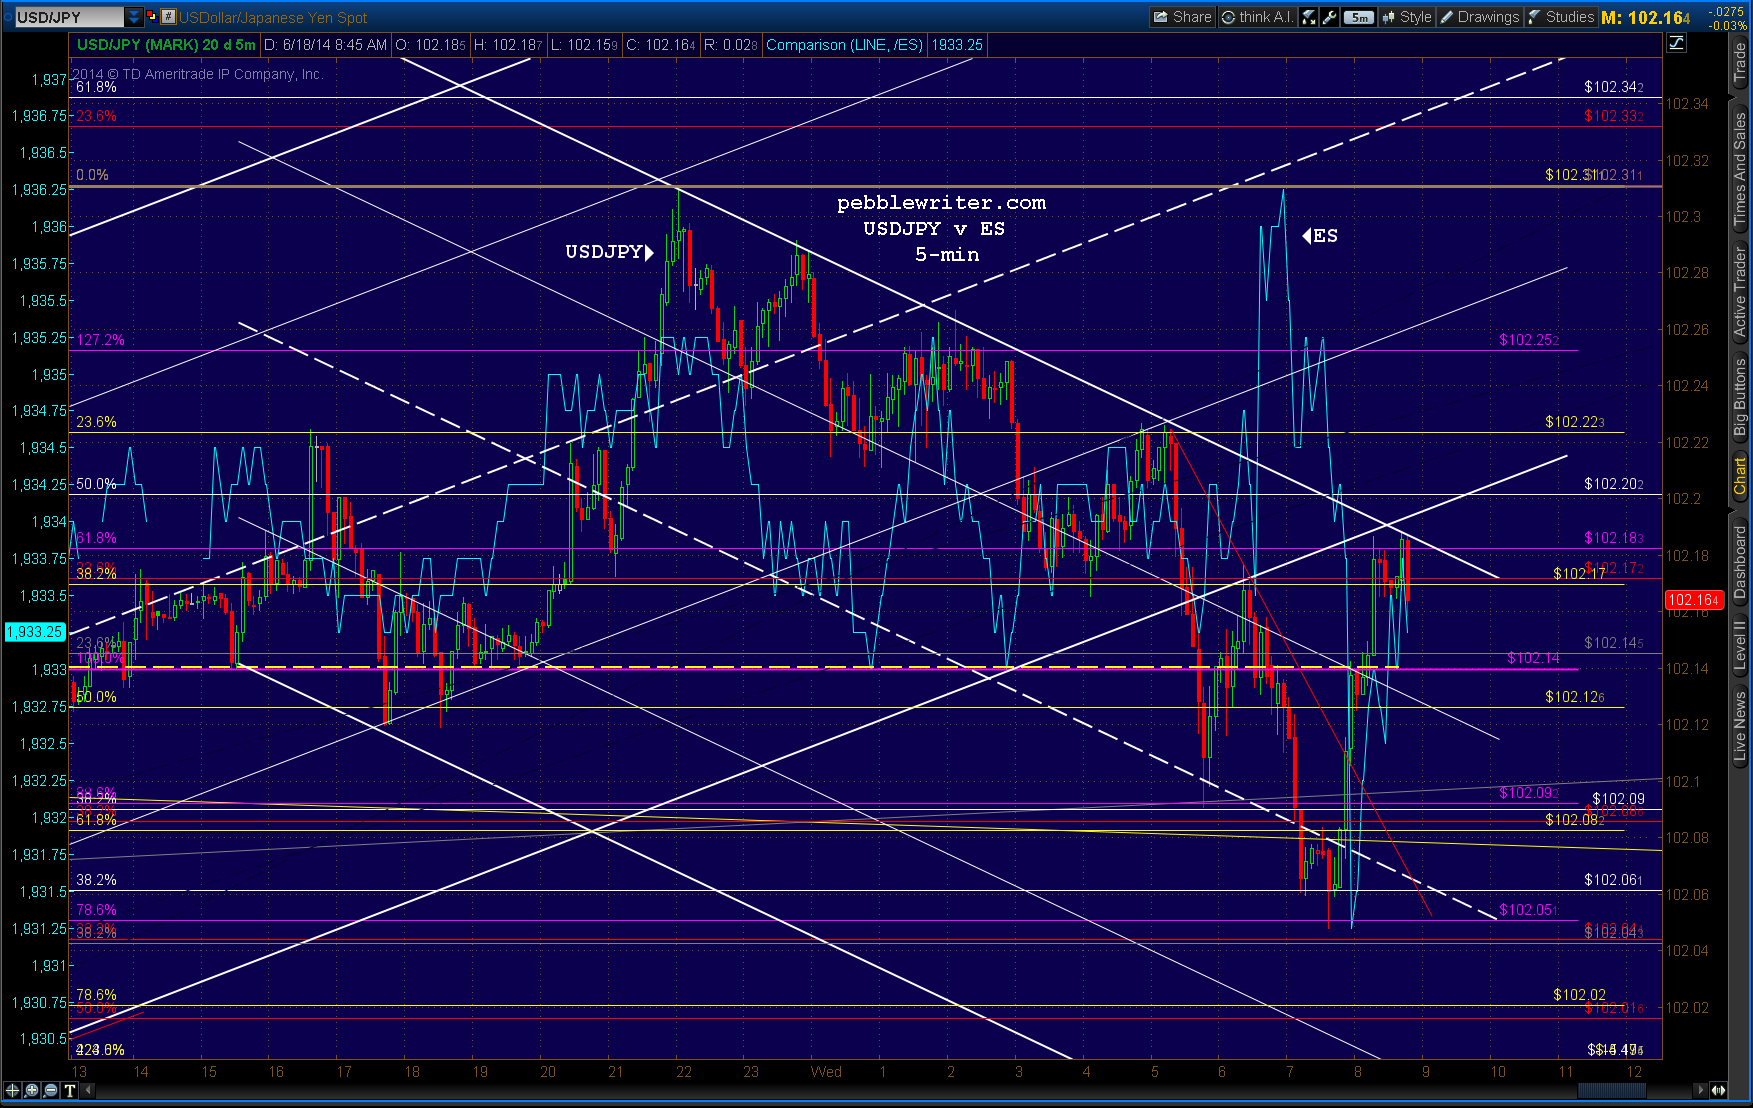
    This bounce in stocks is brought to you by the friendly neighborhood folks of USDJPY — which is backtesting its broken channel as ES/SPX are backtesting their SMA10s. But, don’t be surprised if the moving averages offer little resistance.  The deck is stacked, and there are very few investors willing to step in front of a well-planned ramp job.

    In the news last night, the BOJ is now the single biggest holder of Japanese government bonds.


    2014-06-18-USDJPY v ES 5 0850

    What some folks forget is that the BOJ also purchases about a trillion yen of stocks every year, too — in addition to about 4.2 trillion already on the books.  There has been some talk in the past of selling the position, but every time a deadline approaches…they just can’t seem to pull the trigger.

    Screen Shot 2014-06-18 at 8.58.34 AM

    If you were the biggest investor in the bond market and the biggest investor in the stock market and had an unlimited amount of money with which to “intervene” in the unregulated foreign exchange market…would you allow any declines in value?  Neither would they.  The 1% rule is alive and well.   And, via the yen carry trade, it’s helping inflate other bubbles from New York to Mumbai.

    Happy trading.


  • Charts I’m Watching: Jun 17, 2014

    Double dose of crummy economic news this morning: CPI that overshot estimates and housing starts/permits that didn’t.  Those of us of a certain age remember well the term “stagflation.”  It is used to describe the combination of low economic growth, high unemployment and high inflation.  While central banks have been warning of deflation for some time, anyone who buys gas or food would argue that their budgets have not been squeezed by lower prices.

    The only thing missing from the stagflation equation has been a supply shock that caused a rapid increase in consumer prices.  Forty years ago, it came from the 1973 oil crisis.  Good thing we don’t have to worry about that.  Oh, wait…

    2014-06-17 ES 5 0606

    Some might remember this chart comparison of the DJIA in the 1970’s and the current pattern from a few months ago [see: Eye Candy for Bears.]

    2014-03-14-SPX megaphone 65-74

    The pattern on Mar 14:

    2014-03-14-DJIA megaphone

    Sure, it’s a little higher now (16,770.) The Butterfly Pattern was busted.  And, we have central banks that think nothing of pumping trillions into the “markets” to keep asset prices on the rise.  But, it sure gives one pause…

    2014-06-17 DJI megaphone


  • Charts I’m Watching: Jun 16, 2014

    Stocks have some decisions to make this morning.  Key channel for ESU4:


    2014-06-16-ES 4hr 0640

    The close-up:

    2014-06-16-ES 5 0640

    As long as the BOJ is explicitly managing USDJPY, it will probably continue to move sideways.  But, sooner or later, it’ll have to either break out or break down below the SMA200.

    2014-0616 USDJPY daily

  • Charts I’m Watching: Jun 13, 2014

    Powerful forces at work this morning. We’ll see which one wins out…

    a) Friday the 13th
    b) full moon
    c) mass coronal ejection
    d) wars in Iraq and Ukraine
    e) USDJPY/NKD ramp job


    2014-06-13-USDJPY 60 0611

    2014-06-09-NKD 60 0630

    2014-06-13-ES 5 0611


  • Charts I’m Watching: Jun 12, 2014

    The little IH&S that was setting up yesterday afternoon might still be in play. Keep an eye on 1838.50.

    The trouble in Iraq is one of those game-changers.  We’ll see if TPTB decide whether or not it matters.  Lousy retail sales…but, since when does economic data matter to the market?


    2014-06-12 ES 15 0600

    Here’s a look at SPX now that the market is open.

    2014-06-12 SPX 15 0635

    UPDATE:  9:50 AM

    Another absolutely non-sensical day from a charting standpoint.  Remember when breaking a significant low used to mean something?

    2014-06-12 ES 5 0645

    What could turn things around like that?  Here’s the culprit…about 200 contracts of NKD, nominal value around $15 million.  In this bot, NKD drives USDJPY which drives ES (140,000 contracts, nominal value $13.5 billion in the last hour) which drives SPX.

    Welcome to the wonderful world of algos…where the tail not only wags the dog, it makes the dog its bitch.

    2014-06-09-NKD 15 min 0650

    UPDATE: 1:55 PM

    Downside after all…led by the 10YR (hitting channel resistance and an important .618) and the USDJPY (approaching its SMA200 and a .886 at 101.57.)  NKD reaches channel and Fib support at 14,835.

    SPX has dipped below the TL connecting the 2011 top to the .Dec 31 top, but approaching a combo .786/.886/1.618 of support at 1926.77.