Month: October 2014

  • Charts I’m Watching: Oct 21, 2014

    Nothing much new from last week.  We remain in a slowmo meltup based entirely on rumors of more easing by central banks — all without confirmation, not to mention actual “flow.”

    The USDJPY lost its rising channel overnight, and should continue to settle lower within the falling white channel.

    2014-10-21-USDJPY 60 0600

    Last night’s ES ramp, courtesy of an unnamed source within the ECB, has the futures up 12 points which, if it holds on for another 30 minutes, should finally get SPX up over the SMA200.

    2014-10-21-SPX daily 0600

    Next resistance is at 1913-1919 — at which point I would look for a backtest of the SMA200.  The case for lower lows than we saw on Oct 15 diminishes with each passing day during which the algos manufacture a slow, steady drip higher.

    2014-10-21-SPX daily CU 0600

    UPDATE: 2:20 PM

    Thanks to the algos, no backtests today.  No impact from earnings, or anything else.  In fact, USDJPY and VIX just helped SPX slice through the SMA20 without even a hiccup.  The .618 of the drop from 2019 to 1820 is up ahead at 1943.99.  FWIW, it also represents the top of the falling channel from 2019.  This should be stout resistance, but given the brokenness of this “market,” who knows?

    2014-10-21-SPX 60 1130

    If there is a reversal, don’t be surprised if — like the majority of the gains — it happens in the after-hours, when investors aren’t around to pile on.

  • Charts I’m Watching: Oct 20, 2014

    Friday’s ridiculous maybe-we’ll-delay-the-end-of QE ramp job carried over into the Sunday session, boosted by Abe’s proclamation of increasing the Japanese public pension plan’s holding of equities from 12 to 25%.  But, it ran into a dose of reality this morning with IBM’s dismal earnings announcement.  At present, the futures are off slightly, even though the TOPIX was up nearly 4% in Japan’s Monday trading.

    Today should shape up as a battle between the carry trade and real live earnings, with SPX’s SMA200 still around 1906 and multiple lower targets as detailed over the past several sessions.  Though VIX made an impressive move last week, it appears unfinished to me.  Though, as Thursday and Friday demonstrated, patterns are no match for the power of the FOMC/BOJ punchbowl.

    After today’s QE market goosing, there are supposedly only 3 more POMO days left.

    2014-10-20-VIX weekly 0544

    Note that VIX’s decline backtested the purple channel top, which has held so far.

    2014-10-20-VIX daily 0544

  • Charts I’m Watching: Oct 17, 2014

    More Fed/ECB/BoJ-speak, overnight ramping.  The futures indicate a nice bounce higher — which is to be expected on OPEX.  Perhaps a backtest of the SMA200 or broken white channel?  The downside targets remain the same.

    2014-10-17-SPX daily 0600

    UPDATE: 4:15 PM

    And, there you have it.  Up 30.25 on SPX, 263 on DJIA.  Someone asked me yesterday whether it was time to start panicking, given the strong sell-off.  As long as central bankers are willing to mortgage our future in order to keep “markets” from crashing…the risk is limited.  In my opinion, TPTB engineered this sell off as a lever to force the Fed’s hand, “look how bad things will be if you take away QE!”  The Fed reacted predictably, with hawks and doves alike buckling under the pressure.  It’s pathetic, really.  But, I don’t see it changing any time soon.

    Will stocks continue the decline next week?  I still like 1770-1798 by the 22nd.  FWIW, today counts as a channel midline backtest.  But, though ES backtested its SMA200, SPX hasn’t yet (though it did backtest the broken white channel bottom as we suggested earlier this morning.)  So, it could go either way.  It all depends on what the showrunners have in mind.

    2014-10-17-SPX daily 1300

    As always, keep an eye on USDJPY, which is almost completely responsible for the intra-day moves.

    2014-10-17-USDJPY 60 1315

    Have a great weekend, everyone.


  • Charts I’m Watching: Oct 16, 2014

    SPX tagged our target at the white .886 yesterday and rebounded sharply.  As discussed, though, the grey Fib charts remain a potential path to further downside: the .786 at 1798 and the grey .886.

    2014-10-16-SPX daily 0600But, with several Fed Prez speaking today, don’t be surprised if the jawboning furthers yesterday’s bounce.

    More later.

    UPDATE:  11:45 AM

    Stocks got a nice bounce thanks to rumblings of QE4 by Jim Bullard.

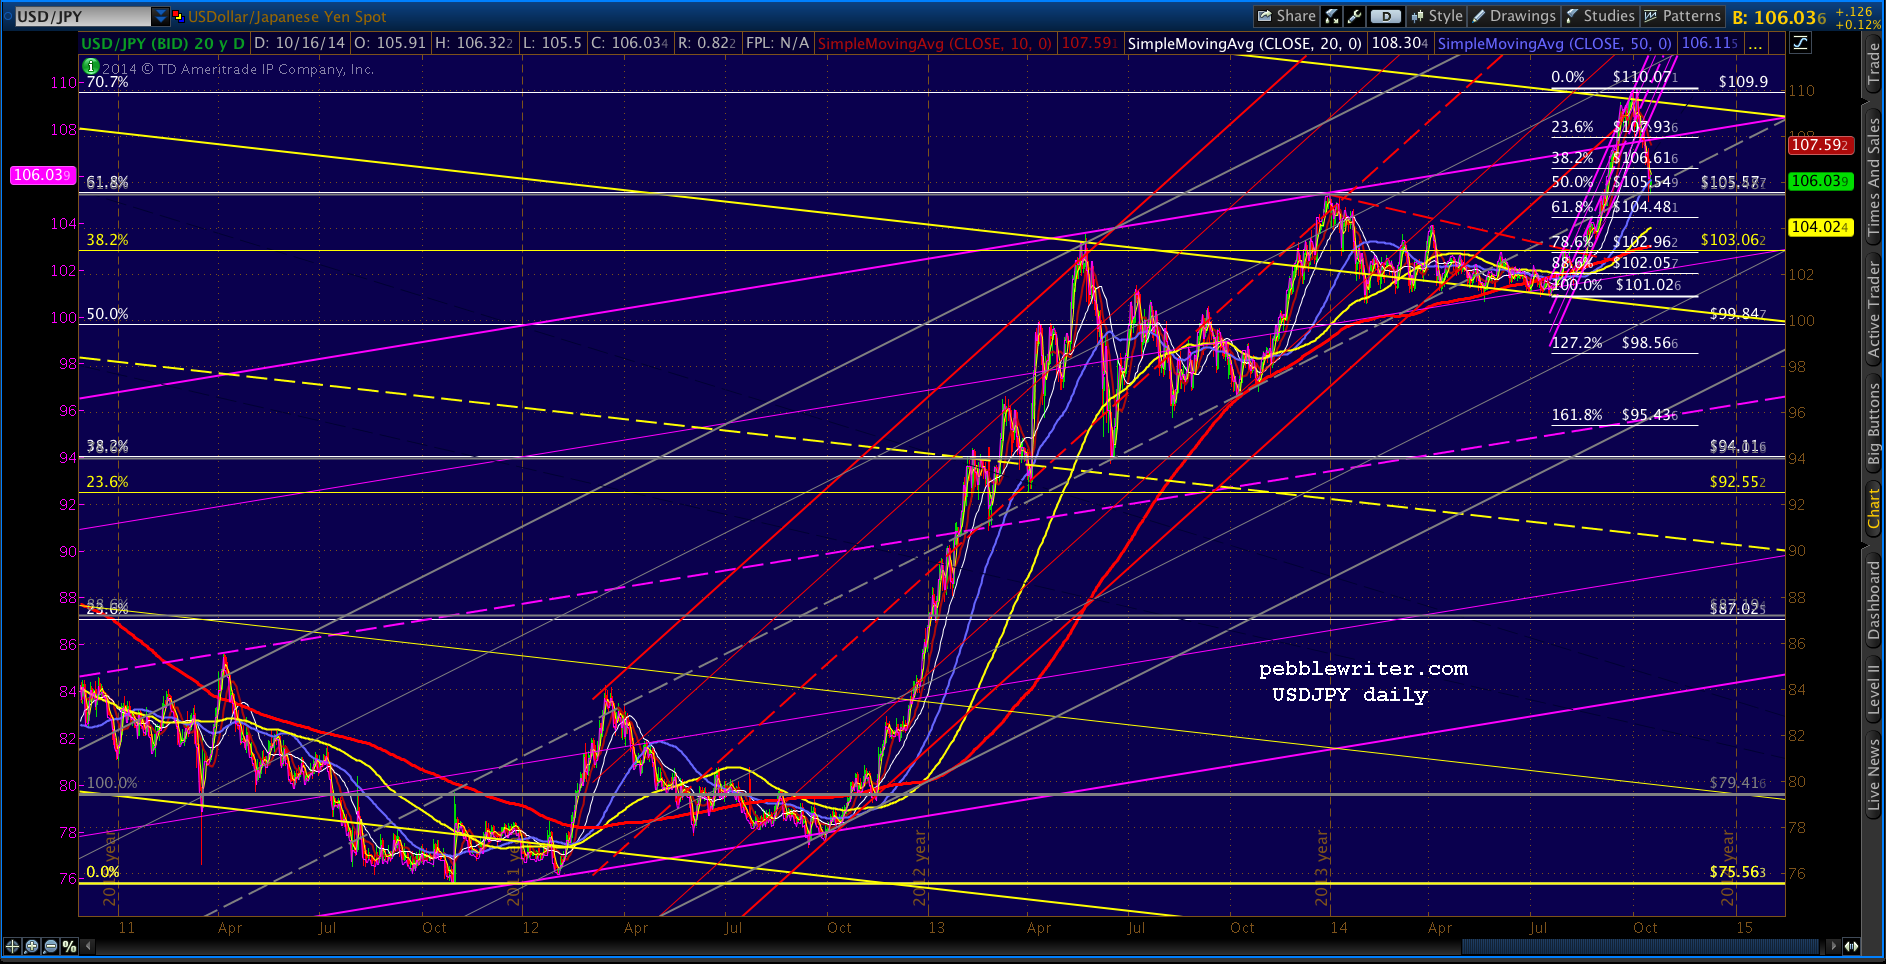
    But, they’ll have trouble keeping the bounce going without USDJPY, which has backtested and is currently stuck below its SMA50.  Note that it’s still north of the grey channel midline, though.  So, we have to treat that as support for now.

    2014-10-16-USDJPY daily 0800

    Note that the gray channel dates back to late 2010, so this might serve as a significant line in the sand.  But, then again, so is SPX’s 1.272 extension at 1823.   Former overhead resistance  — which was ignored on the way up — don’t be surprised if it becomes formidable support.

    2014-10-16-USDJPY daily 0805

    Stay tuned.

  • Capitulation

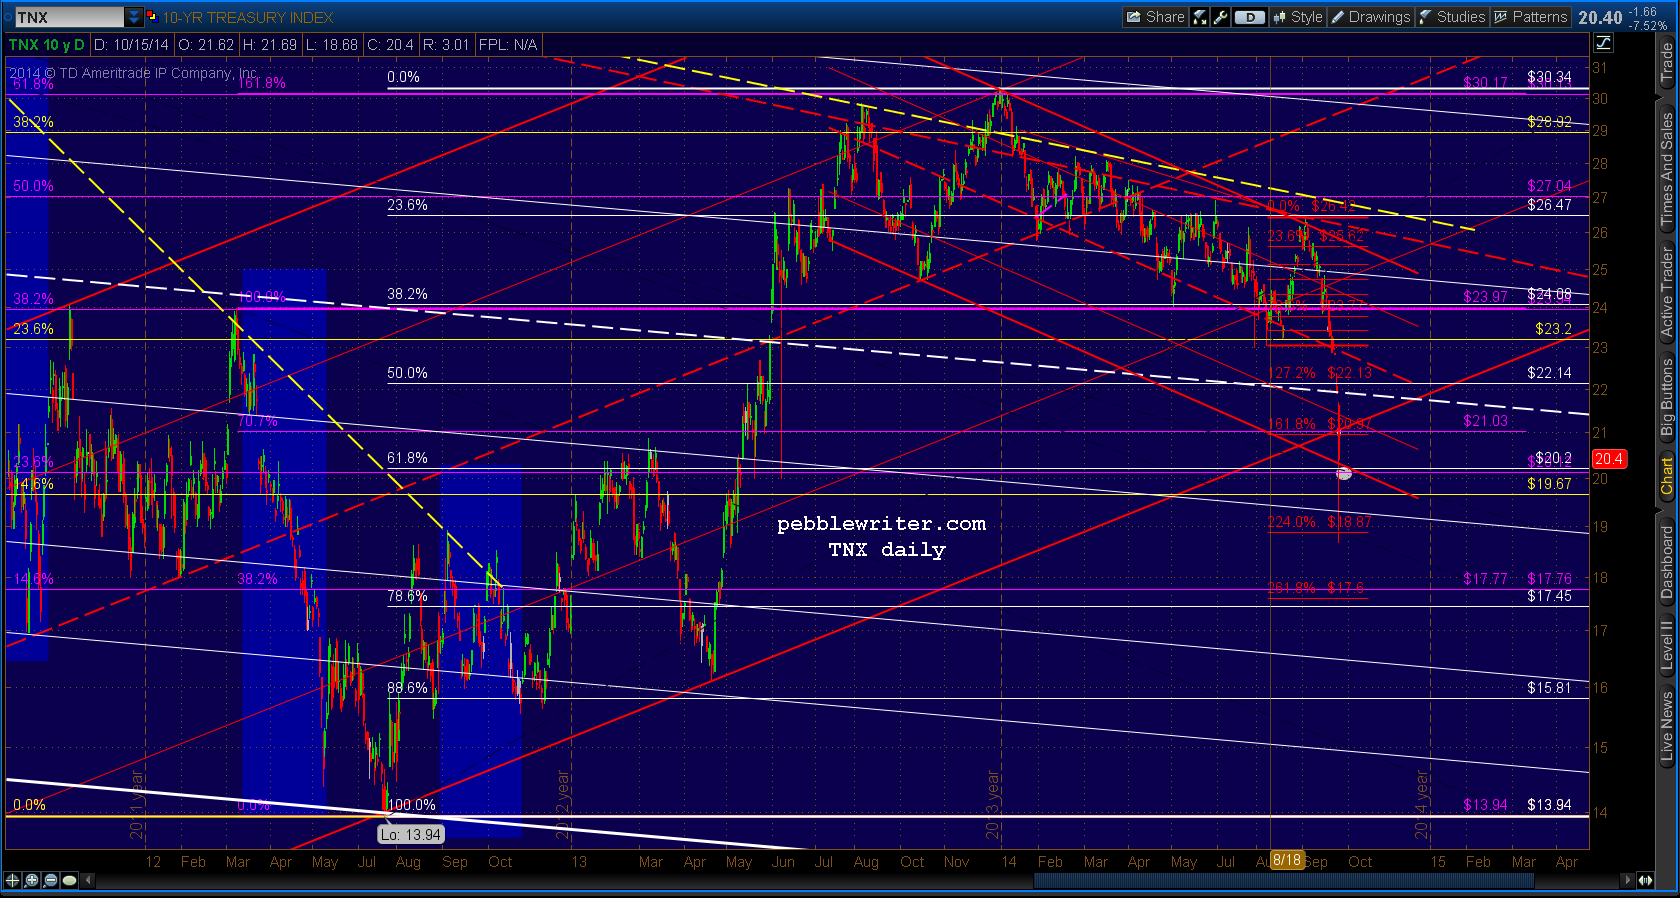
    Gentlemen, we have capitulation.  10-yr note yields just plunged below our rising channel of support, blowing through our 2.02% target.

    2014-10-15-TNX daily 0700And, SPX just backtested its 1.272 Fib at 1823.

    Cue USDJPY for emergency hockey stick operations.  All Fed presidents, report to CNBC for an optimistic, dovish interview.  Mr Buffet, please report to makeup.

    Should be a heck of a bounce from here.

  • Charts I’m Watching: Oct 15, 2014

    USDJPY continues to struggle, giving up the .382 Fib overnight.  The next potential support is the SMA50 at 106.06 and the combination of Fibs at 105.5.

    2014-10-14-USDJPY 60 0600The more troubling development for Mr. Market is the bond market.  The 10-yr note futures shot through the previous high overnight, complicating the prospects of a quick resolution to the market’s correction.

    2014-10-15-ZN daily 0600

    While ES successfully backtested its SMA200 yesterday, SPX didn’t quite make it — fading in the afternoon as has been its habit of late.

    2014-10-15-SPX daily 0600

    There are a number of potential downside targets from a Fib and chart pattern standpoint.  The keys remain the unraveling yen carry trade and interest rates.  I’d keep a close eye on each — particularly when the plunges take place during market hours in less controllable circumstances.

    Note that while we might see a reversal today on the white Fibonacci grid — the .786, .886 or the 1.272 itself — we still have to deal with the grey grid, which suggests the possibility of a drop to the .786 at 1798 or the .886 at 1770.

    I will be out of the office for the rest of the day, but will check in from time to time.  GLTA.

  • Charts I’m Watching: Oct 14, 2014

    VIX’s channel midline tag has been a long time coming.  Also, note the TL connecting the previous highs.

    2014-10-14-VIX wkly 0600Obviously, these patterns don’t mandate a incipient reversal (rally in stocks); but, they’re a pretty strong hint.

    Note, also, 10-yr notes could be topping here just above the .886 of the drop from May 2013.

    2014-10-14-ZN daily 0600SPX overshot its SMA200 by a wide margin.  A backtest at this point would mean a 30-pt rally.  Note the completed Butterfly Pattern at the purple 1.272 and the TL of support from 6/12 and 8/7.  If bonds and USDJPY play ball, it could happen.

    If it doesn’t, and a selling panic develops, I’m looking for 1834-1837.  And, of course, the larger scale 1.272 at 1823 is teed up nicely for a backtest.  Having paid scant attention to 1823 on the way up, a strong reversal there would be a nice way of emphasizing the “bullishness” of this drop.

    2014-10-14-SPX daily 0600One strong argument for 1823 is CL, which is breaking down and appears headed for 64.38, with a potential bounce at 74.02.I will be out of the office tomorrow, Wednesday the 15th, on personal business but will try to post early in the morning.  GLTA.

  • Update on NKD: Oct 14, 2014

    The Nikkei’s rising purple channel is done — meaning the BoJ has postponed the 1% rule… at least for now.

    Keep an eye on the falling red channel.  The next major support is way down at the white channel midline where it intersects with the purple .886 and gray .618 in the 14,000-14,200 range.

    2014-10-14-NKD daily 0900

    If they don’t prop up their “market” north of 13,860, the downside risk is enormous.

    2014-10-14-NKD daily big 0900

  • Charts I’m Watching: Oct 13, 2014

    My cynicism was well-founded, as SPX did fade into the close Friday, nearly tagging the SMA200 (1906.25 v 1905.22.)  Will the market erase the Sunday ramp job and finish the job, or was that close enough?  Not sure, but it appears things are oriented toward a sizable bounce.  Just be cautious for a dip on the opening to trigger the stops and justify the MA bounce.

    USDJPY tagged not only the .7886 but the .886 as well.

    2014-10-13-USDJPY daily 0624

  • Charts I’m Watching: Oct 10, 2014

    Futures have been all over the map overnight, nearly tagging the ES .786 at 1910.75, which might represent a reversal as suggested yesterday by VIX’s completion of a Gartley Pattern.  The key remains USDJPY, which has vacillated just shy of completing its own Gartley Pattern.  In any case, it remains below the channel that took it from 101 to 110 in less than 3 months.   The BOJ might let it linger in this 107.50 – 108.10 range — which could set up a repeat of the early months of 2014 — with the pair providing occasional lifts for stocks during the trading sessions, and resetting overnight.  We’ll see.  All I know is it’ll be difficult for stocks to rally meaningfully without the carry trade’s participation.  And, any doubt as to whether it’ll hold its value might create even more uncertainty for stocks.

    2014-10-09-usdjpy daily 0500

    SPX still has the potential to drop down and tag the .886 at 1917.83, though I have mostly favored a tag later in the month when it will offer a test of the SMA200 — currently 1904.86 (which is finally up above the Aug 7 low.)  But, I certainly can’t rule out a test of both as early as today. Any move below 1925 is probably headed for 1917, so it might pay to just wait and see.

    Double bottoms are always a killer for chart guys, and the amount of whipsawing this market has done is certainly in keeping with that kind of move.

    2014-10-10-SPX 60- 0500

    On the flip side, any sustained rally should still seek out the purple .618 at 1983.65.

    UPDATE:  11:20 AM

    SPX tagged the .886 — after a 15-pt wild goose chase after the open.  From here, it’s anyone’s guess whether we’ve seen the low for the day or whether we’ll take a run at the SMA200.  The cynic in me suspects a close right at the SMA200 — or maybe even a tick or two below — going into the weekend.  In any case, I think it’ll be a lot of chop for the rest of the day.  And, my back continues to give me fits.  So, it’s back to bed for your humble host.  GLTA.

    2014-10-10-SPX 15 0824