Month: October 2014

  • Update on NKD: Oct 31, 2014

    When we last updated the Nikkei 225 [see Oct 14 post], we noted the rising purple channel had broken down and the downside was in the 14,000-14,200 range (from 15,030 at the time.)

    Keep an eye on the falling red channel.  The next major support is way down at the white channel midline where it intersects with the purple .886 and gray .618 in the 14,000-14,200 range.  If they don’t prop up their “market” north of 13,860, the downside risk is enormous.

    2014-10-14-NKD daily 0900

    Since then, two major events have occurred.  First, Bullard blinked — arresting NKD’s decline at 14,400 instead of our 14,000-14,200 target.

    Secondly, the BOJ just went full retard on QQE, upping the amount of bond buying (all of them — full monetization) and stock buying it will do (Japan’s public pension plan will more than double its holdings of stocks, and the BOJ will also increase its direct stock purchases.)

    Today’s 8% rally has been amazing, but it has landed NKD in the middle of serious resistance: the white .886 at 17,068 and a trend line connecting the May 22, 2013 and Dec 31, 2013 highs.

    2014-10-31 NKD daily 0900Given that USDJPY has also bumped up against Fibonacci resistance, I’m inclined to call at least an interim top here, and would fade today’s rally.

  • Trick or Treat?

    If you’re just checking in and wondering why the futures are up over 20 points this morning, last night the Bank of Japan, in a 5-4 vote, increased its annual QQE target from 60-70 trillion yen to 80 trillion.

    This means that the BOJ is now buying every single bond that it issues — also known as monetizing its debt.  Aside from the fact that it is bizarrely legal, this is no different from paying your bills with hundred dollar bills printed out on your Xerox machine.

    The USDJPY, which three weeks ago fell out of the rising purple channel that ramped it from 101 to 110 in two months, has reached 111.97 so far.  It has not only broken out of the secondary red channel, but is backtesting the original purple channel midline.

    This is a shocking development, given that Japan’s QQE has been an utter failure — other than its ability to inflate other asset bubbles around the world. Note, below, the impact on S&P 500 e-minis when USDJPY lost the purple channel — and the huge bounce in ES when USDJPY started recovering.

    2014-10-30 USDJPY v ES daily 0600Interestingly, this puts USDJPY at the .500 retracement of the drop from its 1998 all-time high of 147.55 to its lows of 75.56 in late 2011 — when Kuroda/Abe cooked up the rescue scheme — and just below the .618 at 112.375, which was our next upside target. So, it’ll be interesting to see if there’s any follow-through, or the pair has simply exchanged one form of resistance for another.

    2014-10-31 USDJPY v ES daily 0600Surprisingly, DX has not rallied all that much, and is so far stuck at the midline of the rising yellow channel we’ve been watching for over a year.

    2014-10-31 DX daily CUThe close-up shows DX has reached the 1.272 Fib level, with the white .886 just above in case we get a break out.2014-10-31 DX dailyThe 10-yr has also not reacted much, with prices holding above Wednesday’s lows at the .618 Fib level we discussed then.

    2014-10-31 ZN dailyAnd, VIX just tagged the .886 retracement of the rally from 11.52 on Sep 19 to 31.06 on Oct 15.  2014-10-31 VIX daily

    Note the well-formed falling wedge on the 15-min chart.

    2014-10-31 VIX 15-minI should also point out that the Nikkei 225, which has risen 1,160 points this past week, is only 48 points away from its .886 Fib retracement of its 2007 highs. It’s close enough to count, though I suspect the fact that it didn’t quite reach it (which would have been quite simple for TPTB) is often an indication that the fireworks aren’t quite over.  Either way, it points to an potential reversal.

    2014-10-31 NDX wkly 0900For all these reasons, I would hesitate to chase this rally, as there is a fair to middling chance of it reversing.  The brave/reckless might even consider shorting USDJPY at 112.38 and ES at 2014 (tight stops on both.)

    I’ve said it before, but it bears repeating.  It’s time central bankers admit that currency debasement has absolutely nothing to do with helping their countries’ citizens.  There is no proof whatsoever that the average guy on the street benefits from increased inflation.

    Japan, like the US, uses a measure of inflation in its official statements and press releases that leaves out food and energy prices.  Guess why?

    As of September — before this latest yen bashing — fresh food prices had increased 23% in the past year.  They were up over 10% in the past two months alone!

    Screen Shot 2014-10-31 at 6.49.03 AMEnergy prices to the Japanese consumer increased 18.5% since the yen topped out at 75 USD.  By contrast, oil prices in dollar terms dropped 22% over the same time period and should drop substantially more by year-end.

    Screen Shot 2014-10-31 at 6.52.26 AMThe experiment that is quantitative easing has failed the Japanese people.  When will they wake up and realize that things are going from bad to worse?  When will the rest of the world realize that their own central bankers are taking them down the same path?


    UPDATE: 10:50 AM

    ES dropped from 2014 to 2002.25, a pretty good move so far.  DJIA and ES made new highs, and the fact that USDJPY keeps edging higher suggests SPX will, too (2019.26 versus 2015.16.)  SPX can do so without ES retracing all its decline off the top.  If it does (and, that’s a ginormous IF) ES could be angling to complete the pattern below.  If C=A, we’re looking at 2001.  At 1.618 of A, more like 1991.

    2014-10-31 ES 5min 0749The nearest daily moving average is the 50-day way down at 1960.  The 10-day will likely reach it on Monday.  For SPX, the SMA50 is 1968 and the 10 will reach the SMA100 Monday at around 1963.  I like moving average crosses as targets for pullbacks, but till readily admit that these are miles away and, as such, would necessitate a huge reversal.


  • Charts I’m Watching: Oct 30, 2014

    Stocks rightly sold off yesterday, almost reaching the SMA50 before USDJPY/NKD ramping and VIX shorting arrested the decline and shoe-horned stocks to a little over 61.8% of the decline from the 1991 highs.

    2014-10-30 SPX 60 0600On this morning’s GDP news, USDJPY reached just shy of the .886 of its decline from the 110.07 highs, reversing strongly but leaving room for one last gasp higher without threatening the politically-mandated ceiling.

    The big picture:

    2014-10-30 USDJPY daily 0600Note that the decline from this morning’s highs has been halted at a channel midline, which could serve as a floor for any further declines.  I’d keep a close eye on USDJPY and its first derivative: NKD.

    2014-10-30 USDJPY 60 0600Why didn’t the market correct more?  Yesterday’s ramp job did its job very well.  The point was to demonstrate that the end of QE needn’t crash the market.  Nothing to see here, just move along.

    As can be seen from the 10-yr notes, prices even broke down through key support.

    2014-10-30-ZN 15 0721It’s now in the process of backtesting that support (126’255) in a rising wedge — a reversal pattern.  If it’s unable to break through, there is potential downside to the bottom of the white channel below — a .786 or .886 retracement of the rise from 123.

    2014-10-30-ZN daily 0721

    But, note that the decline has reached the .618 level — meaning that the current bounce could have more legs than just a backtest of support.

    2014-10-30-ZN 60 0721I used to regard the 10-yr as one of the most unadulterated indicators of market direction.  Now, of course, it is every bit as manipulated by central banks as any other “market.”  As such, it’s not an honest indicator. In fact, there are not more “honest” indicators.  But, it does provide some hints as to what TPTB are planning.

    The fact that it was pounded into submission at the height of the equity meltdown shows that they are very serious about avoiding the appearance of a panic.  But, in reality, lower rates really, really help governments like the US which have way too much debt on the books.

    Witness what’s happening in Japan and Germany, where rates have recently gone negative.  In Japan, in particular, negative rates are necessary in order to buy a little more time until Abenomics’ failure becomes clear to everyone.

    The bottom line: QE got us from 666 to 2019.  Without it, prices should drop like a rock.  But, as long as USDJPY and VIX can be manipulated, bears will have a hard time getting any traction.

    As we saw earlier in the year, USDJPY can stay in a trading range for a long, long time.  They can lower it during the after-hours, when e-mini volume is light enough to keep under control with a few nudges from time to time.

    As I’m writing this, SPX just reached our top Fib target, 88.6% of the drop from 2019 to 1820.  It should reverse (but, probably won’t go below 1991.4 until late tonight when most investors are sleeping.) The white .786 at 1976 would be a modest downside target in an unrigged market, though I favor the SMA100 at 1963.48.  The SMA10 should reach it tomorrow.

    It’ll probably rally a little more into the end of the month tomorrow — whipsawing and headfaking every few minutes to shake the confidence of anyone crazy enough to short it at these levels.

    2014-10-30 SPX 5 1100Re USDJPY, as discussed early this morning, the channel midline was the obstacle for bears.2014-10-30 USDJPY 5 1100It just backtested the top of the falling yellow channel from 1996 that we’ve referred to before.  Sure, it could pop through.  At 109.45, it came up just shy of the .886 retrace of the drop from 110 to 105.19 that accompanied the equity sell-off.  “Just shy,” as in “there’s always an excuse for one more rally.”

    But, at these levels, opposition to the ever-cheapening yen is reaching a fever pitch (by Japanese standards) and Abe has just plain run out of room to do much more.  Any further food or fuel inflation, and he’ll be given a siphon and bundled off to Fukushima to deal with the other radioactive mess Japan faces.

    2014-10-30 USDJPY v SPX 60 1100I don’t know if the market can survive without QE, or the yen carry trade, or any other of the tricks that have levitated it this high.  I do know that TPTB have reached the point of not caring about the scrutiny they’re under.

    Only a year ago, there was at least the pretense of trying to help the average Joe.  It took some work (mostly a lot of definition changing) but unemployment finally reached the Fed’s target.  Yay.

    Now, they’re trying to sell us on the idea that that same 55-year old who was lucky enough to find a part-time job greeting WalMart customers…what he really needs is more inflation!  If he just shell out a little more for his generic raisin bran and to gas up his ’77 Caprice, everything will be just peachy.

    As to the markets, when they’re not outright buying up stocks or leveraging them lower through derivatives, central bankers cum game show hosts go on TV to talk the “market” higher.  No hiding it anymore.  No shame.

    A friend of mine, one of the smartest guys I know, insists they can keep this up indefinitely.  Maybe he’s right. But, what a sorry state of affairs.  Imagine what they could have done with the $4 trillion other than prop up the banks that got us into this mess in the first place.

    The average age of the 607,380 bridges across the county is 42 years.  One in nine is structurally deficient.  We could spend $10 million on each one, and still have $3.5 trillion left over to build 10,000 hospitals, 100,000 schools, and 100,000 day cares — still leaving $2 trillion to put into serious alternative energy research so we can stop sending soldiers off to the Middle East to kill and be killed for oil.

    Just think of the jobs that would come from all that infrastructure construction and operation.  I dare say, they would be better jobs than WalMart offers.

    This is turning into a rant, now.  So, I’ll stop here.  But, the next time so bobble-headed TV personality insists that Greenspan/Bernake/Yellen/Draghi/Kuroda/Abe have “saved the world,” I hope you’ll think about those numbers and the good that might have been done had someone stood up to the bankers and insisted they clean up their own mess.

    Tomorrow’s a new day, and I expect the Fed will be gearing up to short some more VIX right about now.  Sigh.

    20141027_VXX4


    .


  • FOMC Day: Oct 29, 2014

    I could make all sorts of arguments for why the “market” should be moving lower.  But, the reality is that prices are still being driven by Fed/ECB/BOJ easing, promises of easing, and hints of easing.

    Although QE3 is officially over, just the hint of additional easing by Bullard the Blinker were enough to drive a panic rally that has barely retraced any of its move higher.  Note the complete lack of respect at .618 and .786 Fib lines.  The .618 was exceeded by 6 points before ushering in a backtest of the SMA20.  The .786 saw a retrace of a whopping .97 points.

    2014-10-29 SPX 5 0600The SMA20 backtest did flesh out a well-formed channel which broke down Monday — only to see prices rise higher still.

    2014-10-29 SPX 60 0600Since then, 10 year notes have moved sideways, as have USDJPY and USD.  And, VIX has been relentlessly pounded into submission.  If we get any kind of sell off today, I suspect it will be to the SMA100 at 1962 or SMA50 at 1967.  Remember, in the past, these FOMC day sell-offs have lasted a matter of minutes and are treacherous to trade.

    If those levels should fail to hold, the .618 at 1943 might serve as a target.  Otherwise, lots of resistance was broken yesterday, and the trend higher has to be considered to be intact.  The .886 is up ahead at 1996.62

    Good luck to all.


  • Charts I’m Watching: Oct 28, 2014

    The website seems to be up and running just fine again.  Thanks for your patience during yesterday’s maintenance.
    Durable goods orders gave back almost all of last month’s gains.  Headlines per Bloomberg:

    •     Durable goods new orders fell 18.3% in Aug., the Census Bureau said
    •     New orders ex-trans. fell 0.2% in Sept. after 0.7% rise
    •     New orders ex-defense fell 1.5% in Sept. after 19.1% fall
    •     Non-defense capital goods orders ex-aircraft fell 1.7% in Sept.
    •     Non-defense capital goods ex-air 3 mo. avg. annualized rose 10.4%
    •     Non-defense capital goods shipments ex-aircraft fell 0.2% in Sept. after 0.1% rise

    It seems even more dramatic in graphical form:

    Screen Shot 2014-10-28 at 5.54.08 AM

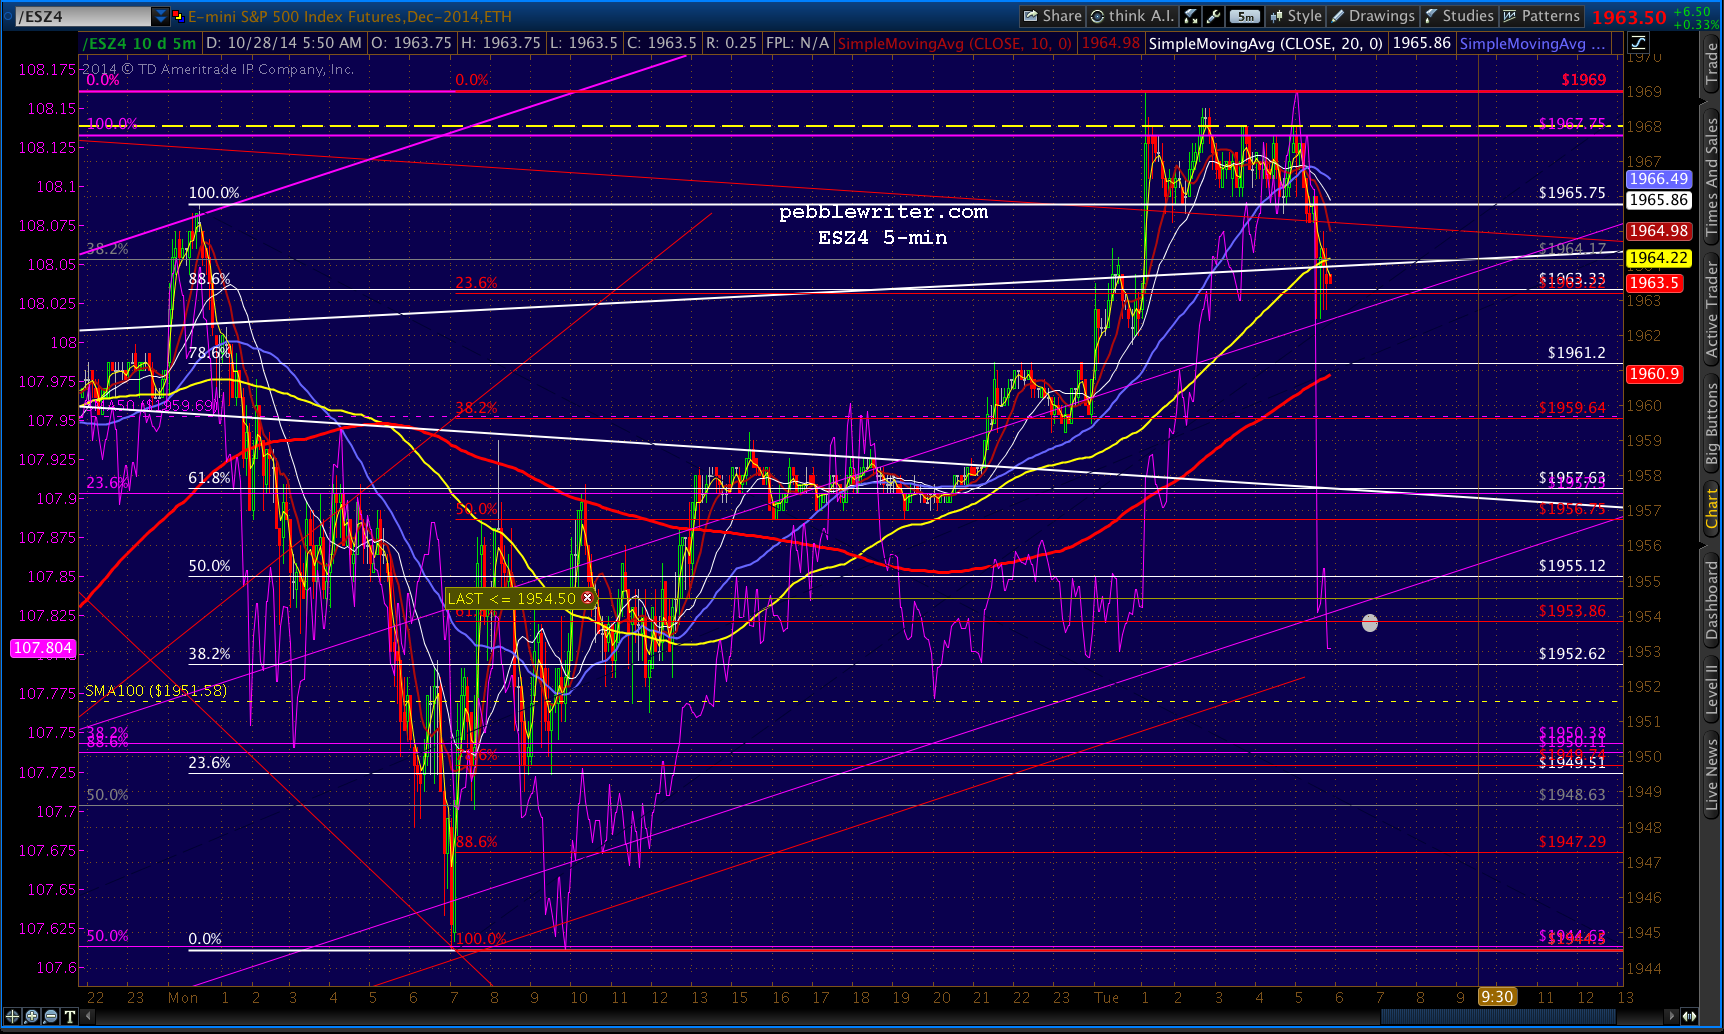
    Of course, the S&P futures gave back only a smidge of last night’s USDJPY-fueled ramp (so far.)  It remains to be seen whether bad news is still good news in the post-QE world.

    2014-10-28-USDJPY v ES 0600

    SPX came within 2 points of tagging the SMA50 (1967.08) yesterday.  I’d be very cautious around that level — particularly if USDJPY dips below its SMA20 at 107.68.

    2014-10-28-USDJPY 0600GLTA.

  • Down for Maintenance

    pebblewriter.com will be down for maintenance for some or all of the weekend.  I will post on pebblewriter.blogspot.com if it’s not up by Monday morning.

  • Charts I’m Watching: Oct 24, 2014


    141024_080927_CQG_Integrated_Client_Chart_EPZ4_-_E-Mini_S&P_500_Dec_14_Daily

    ES and SPX have both reacted off their SMA100s, but not much of a reaction yet.  A backtest of the SMA20 or lower would make sense, even if prices are still headed higher.

    Keep an eye on VIX, as discussed in last night’s post.

    GLTA.

  • As Clear as Mud

    In keeping with our “this-thing-could-break-either-way” theme, VIX is prepared to either break out or break down.  Note the well-formed falling channel containing the decline since the 15th.

    2014-10-23-VIX 60 1426

    From all appearances, I’d say it makes a great argument for a continued slide in VIX (higher stock prices).  But, the bigger picture argues quite the opposite.  VIX’s slide has taken it to the .25 channel line of the massive falling white channel that dates back to 2007.

    Not that this market is “normal;” in, fact, I’d argue that as long as central bankers and algos continue to have their way, it’s not really a market at all.  But, prices within a channel normally ping pong between the .25, .50 and .75 channel lines.  The spike that peaked on Oct 15 reached the midline of the falling white channel and has now backtested the .25 line.  Under convention, the next stop would move up through the midline to the white .75 line at 40ish, followed by a possible backtest of the midline and ultimately the top of the white channel at 60ish.

    I’ve marked the .75 line with yellow.  Note that it lines up with the white .382/yellow .786 Fib lines.  And, the final destination (in red) lines up with the yellow 1.272/white .618 (yes, it’s only a 61.8% rebound of the drop from the all-time high of 89.53 in Oct ’08.)

    Of course, this is the worst kind of rank speculation (is there a best kind?)  But, it’s something to think about if TPTB can’t engineer a few more rallies like we’ve seen the past week.

    2014-10-23-VIX weekly 1300

    Happy trading.

  • Charts I’m Watching: Oct 24, 2014

    USDJPY provided the lift last night, making a bid to break out of the falling white channel.  The key is whether it can break through the SMA20.

    2014-10-23-USDJPY 60 0600

    SPX reacted, belatedly, at the purple .618 (1943.33) as expected.  The futures indicate a bounce to backtest it.  From there, we’ll have to see whether the yen and Nikkei can provide the usual boost.

    2014-10-24-SPX 60 0600

    Ordinarily, we’d look for a minimum reaction at a major .618 to at least the .500 – usually lower.  So, a backtest of 1943 and then a continuation lower would make sense in an unrigged market.  But, this rally — being completely manufactured by central bankers and the carry trade algos — might have other plans.

    UPDATE:  1:45 PM

    This is really getting old.  Today’s rally has nothing to do with CAT, MMM, OXY or anything even remotely related to the economy.  The reason stocks have vomited higher is, as usual, the yen carry trade which is fueling the algos.  Note how USDJPY spurts higher every time SPX even thinks about digesting its gains.  The pair blew though its .618 and 20-day moving average, and the rising white channel in order to prevent SPX from experiencing any pullbacks of any consequence.

    2014-10-24-USDJPY v ES 1400

    Watch USDJPY spurt higher when SPX reaches its SMA100 at 1961.22.


    GLTA.

  • Breadth Thrust or H&S?

    This could break either way.  But, as ZH pointed out earlier, VIX has never, ever, declined 10%+ for three days in a row.  I’m thinking at least a breather, and maybe something much bigger.

    2014-10-21-SPX daily proph CU

    The trend line coming up from the lower left corner that SPX is backtesting connects some rather noteworthy lows — make that every noteworthy low of the past 5 1/2 years.

    2014-10-21-SPX daily proph