Month: August 2014

  • Breadth Thrust Misses

    According to Prophet, NYSE breadth just missed triggering a Zweig Breadth Thrust.  Recall we needed to see .615.  Today, (the 10th day) breadth closed at .611.  To state the obvious, this does not mean the market will instead correct.  Today, on the lowest volume day of the entire year, SPX had no trouble tacking on another 10 points.

    It’s worth noting, however, that it did complete a bearish Bat Pattern at the .886 Fib.  In an unrigged market, a Bat Pattern would be good for a retreat to at least the .786 (1972) and more commonly the .618 (1958) or lower. Fed minutes are due out tomorrow at 2pm ET.  So, of course, anything could happen.

    We should expect that the end of QE will ding the “markets” significantly [then again, I thought the same thing in June when the worst GDP print (-2.9%) since the financial crisis hit…and, SPX gained 10 points on the day.]  And, to the extent the minutes reinforce the timing/certainty of the end, or hint at a quicker interest rate rise than investors would like, they could exacerbate any downside potential.

    2014-08-19-SPX BT Prophet

    Stay tuned…

  • Decisions, Decisions…

    Today’s pregnant pause is brought to you by the good folks at Acme Marketbots — who would just as soon not allow SPX to reach its .886 during market hours, when traders might do something reckless like short a few overpriced stocks (it’s not just me talking, check out Shiller’s latest.)

    As we discussed yesterday and last week, there’s also a Zweig Breadth Thrust in the works.  With the daily BT currently at .618, it’s safe the say the bots will do what they can to engineer a close at or near current levels.  And, manipulating breadth is relative child’s play for the mens et manus of the PhDs behind the scenes.

    What might we be facing, were the algos not in firm control?  For one, USDJPY has reached the .886 retracement of the drop from 103.07 to 101.5 that began on July 30. This would ordinarily set up a decent sell off.   These days, it’ll happen only if/when the central planners see fit (if at all.)

    Truth be told, USDJPY tagged 102.89, and the .886 is 102.897.  So, the Bat isn’t technically complete because the engineers haven’t allowed it just yet.

    2014-08-19-USDJPY 60-min

    Ditto for SPX — which the bots are holding 1/2 point shy of the actual .886 Fib line at 1981.52.  If it does surpass 1981.52, there will likely be some very vigorous pumping of the USDJPY to make sure SPX just keeps on going.

    2014-08-19-SPX 60-min 1000

    Remember when stocks moved up and down based on earnings, economic and geopolitical events, and good old fashioned fear and greed?  The “markets” might have been rigged back then, too.  But, at least the guys at the controls put a little thought into it — if for nothing else, to keep up appearances.  Sigh…

  • Breadth Thrust Update

    As discussed last week, there is a potential Zweig Breadth Thrust event in the works.  Recall that the ZBT was defined by Marty Zweig as a move in breadth from below .400 to over .615 within 10 trading days. In the past nine days, breadth (as calculated by Prophet) has risen from .39 to .604 — just shy of the trigger that is supposed to usher in a new(?) bull market.

    2014-08-18-SPX BT EOD

    In a July 2011 article, Tom McClellan noted that since the elimination of the uptick rule in 2007 and the advent of algorithmic trading, he wasn’t sure how valid the signal was anymore (he also discusses the different calculations folks use, and charts a few notable signal fails.)

    Today’s 16-pt gain was almost entirely courtesy of the futures last night – a very common occurrence, lately.  And, thanks to the algos, the validity of intra-day price movement isn’t much better [see: How Algos are Killing Off Traders.]  So, based on the principle of garbage-in, garbage-out, I’d have to admit I’m a little leery of any signals these days.  Then there’s Robert Shiller.

    In a NY Times piece this weekend, Shiller calls the US stock market “very expensive.”  The measure of valuation he favors, cyclically adjusted price-earnings or CAPE, has reached levels only exceeded in 1929, 2000 and 2007.  Yikes.

    On (perhaps) unrelated note, just came across this nice little documentary on the flash crash of 2010.  It touches on HFT, algorithms, etc.  Well worth the 45 minutes, IMHO.

    Money & Speed: Inside the Black Box


    note: the ZBT calcs are supposed to be performed using NYSE data.  Presumably, the Prophet calculation utilizes NYSE data and the 10-day EMA suggested by Zweig, but I cannot find a source within the program to confirm this.  Caveat emptor.


  • Charts I’m Watching: Aug 18, 2014

    ES has ramped about 10 points.  SPX is still working on the IH&S pattern forecast last week.  The neckline was defended on Friday, so I see no reason for it not to play out — other than a raft of economic and Fed news this week.


    2014-08-18-SPX 60 0600

  • Charts I’m Watching: Aug 15, 2014

    The futures ramp overnight provided a gap open for SPX, so they’re now trying to backtest the .618/SMA50 without killing the upward momentum.  Closing the gap would take us down to 1955.23.  And keep an eye on the 10-yr, which just tagged 2.38%.

    2014-08-15-SPX 15 0644

    FWIW, VIX is tracing out both a megaphone and a falling wedge that suggest a move higher (lower in stocks.)

    2014-08-15-VIX 60 0712

    UPDATE: EOD

    Bit of an understatement about the megaphone…

    2014-08-15-VIX 60 EOD

    Solid breakout, which was — of course — monkey-hammered into submission when SPX tagged its .618 retrace/SMA100 on the 60-min chart.

    2014-08-15-SPX 60 EOD CU

    It was a pretty wicked departure from the channel to have climbed right back in as though nothing had happened.  Even managed to close flat on the day.

    2014-08-15-SPX 60 EOD


    *  *  *  *  *

    For anyone who missed it, Nanex (reprinted with additional commentary by Zerohedge) published an explanation of the quote stuffing strategy being employed by Citadel — a $142 billion hedge fund that’s closely linked to the Fed — to manipulate prices.  Per NASDAQ, which sanctioned Citadel in June (as did FINRA):

    We discussed quote stuffing just a few days ago [see: How Algos are Killing off Traders.]  My description was a little off: “hundreds or even thousands of orders are entered and cancelled within seconds in order to influence price direction.”  According to Nanex’s research, Citadel was placing upwards of 25,000 orders per second with, as NASDAQ confirms, “few or no executions.”

    The large red dots below are the instances for which Citadel got its wrist slapped. Each of the dots below represents an instance of quote stuffing to the tune of 6,000+ quotes per second — meaning orders were “live” for 1.6 millionths of a second.  According to Nanex, there were millions of other instances that were somewhat less egregious.

    Screen Shot 2014-08-15 at 6.33.05 PM

    This article, coincidentally, comes on the heels of a conversation I had with a quant who confirms that certain hedge funds are clearly pursuing predatory strategies — those that exploit traders’ expectations regarding traditional market analysis tools such as chart patterns, harmonics, moving averages, hell — even, the effect (or lack thereof) of news.  My hedge fund’s broker confirms that many funds are having a very difficult time trading these markets, and losses/redemptions are on the rise.

    I’m getting a clearer sense of why the chart patterns, harmonics and technical analysis has been so spotty the past year — after several years of very effective guidance.  It angers me that the regulators have allowed the integrity of the markets to erode so badly.  Turns out that Citadel is the first and only firm to be fined for running a quote stuffing strategy — quite shocking, given its prevalence.

    If you’re a trader, pass the word.

  • Charts I’m Watching: Aug 14, 2014

    Lots of overhead resistance for SPX today: SMA20 at 1952, SMA50 at 1956, .618 retrace of the drop from 1991-1904 at 1958.  But, it does have that IH&S going for it.

    2014-08-14-SPX 5 0639

    And, there’s something else that no one seems to be talking about — maybe, for fear of jinxing it?  If breadth can get up to the .615 mark by next Tuesday, we’ll have a Zweig Breadth Thrust on our hands.

    2014-08-14-SPX BT 0639

    It goes without saying that head & shoulders patterns have been miserably unreliable for the past 8-10 months.  Normally 70-80% effective, I’d rate them at about 10% lately (on par with other chart patterns, harmonics and, yes, even moving averages.)  But, bullish IH&S have certainly been more effective — especially with all the tools at TPTB disposal to nudge the markets higher and trample bears.  So, this bears watching.

    Last, I had a very interesting conversation with a high-powered institutional broker yesterday.  He works with many major hedge funds.  Top takeaway: performance is tough across the board for active traders, lots of losses and lots of redemptions.  I don’t need to explain to our readership that a market which is dominated by algorithms and government intervention is no longer a market.  I suppose there is some comfort in knowing I’m not the only one incredibly frustrated by the direction things have taken.

    GLTA.

  • Charts I’m Watching: Aug 13, 2014

    Third miss in a row for US retail sales, a massive 6.8% plunge in Japan’s GDP (biggest consumer spending drop ever,) industrial production misses in Europe and China, ugly earnings and forecast from bellweather Macy’s, renewed tensions in Ukraine, riots in Missouri…  why shouldn’t the “market” rally?

    In spite of the above…mission accomplished on the IH&S thanks to the bots.  Sigh…

    2014-08-12-SPX 15 1055

  • How Algos are Killing Off Traders

    I’ve been a big fan of chart patterns, harmonics and technical analysis for many years.  They’ve worked well for me, for those who follow this site, and for many generations of traders who came before us.

    Since late 2013, however, algorithmic trading has practically ruined these time-tested tools.  Unless you follow the market throughout the day, tick by tick, you might never realize the extent by which they determine stock prices.  I’ve had many conversations with veteran investors who have a hard time believing it until they set up multiple screens and watch the instruments involved side by side.

    There are many different types of algos involving all types of instruments, currencies, derivatives, etc.  All involve computers, and many involve high-frequency trading including quote-stuffing (hundreds or even thousands of orders are entered and cancelled within seconds in order to influence price direction), front-running (needs no explanation), layering (placing multiple large orders slightly away from the market to push it one direction or the other) and subpennying (providing a slightly better bid or offer in order to nudge the underlying higher or lower.)  There are many others, as illustrated in this chart from BlackRock (which uses less pejorative terms.)

    HFT

    In my experience, the most influential algo going today involves the USDJPY.  Many investors are aware of the dollar-yen carry trade.  The basic premise is that an investor borrows in yen and invest in stocks.  As long as the BOJ continues to trash the yen, it is presumed that the loan will cheaper to repay in the future – a riskless trade.  And, as long as central banks continue to prop up stock prices (directly in the case of Japan, indirectly practically everywhere else), the assumption is that the other side of the trade also riskless – a safe assumption for several years, now [note: the market averages 11 months between 10%+ corrections; it has now been over three years.]

    While the dollar-yen carry trade makes sense in a big-picture sense, many are surprised to learn that it is being used by algos to direct even minor moves in the markets throughout the trading day.  Currency markets are almost entirely unregulated and are extremely easy to manipulate.  There’s a nice collection of FT articles HERE, but any Google search for “forex manipulation” will provide plenty of reading material.  And, given the general lack of volume in the markets lately (gee, I wonder why?), the impact can be substantial.

    We’ll look at two blatant examples that occurred earlier today.  They’re not the most egregious I’ve seen, but they have the advantage of being fairly obvious to anyone who knows how chart patterns normally work.  First, we’ll look at the e-minis on a 5-minute chart.  Note the strong trend line (blue, dashed) connecting the highs of the day.  Note also that the declining Imoku Cloud guided prices lower throughout the day.  The chart is cut off at around 3:30pm EST, when ES was coming up to test the trend line for what was probably one last time during regular trading hours.

    140812_174810_CQG_Integrated_Client_Chart_EPU4_-_E-Mini_S&P_500_Sep_14_5_Min

    The 50-period moving average had also guided prices lower, with the 100-period line also pitching in.  A strong move higher at 3:30pm would have taken prices up to the trend line, and perhaps the SMA100 (marked as Point A.)

    The USDJPY chart looks fairly similar.  It also bears a strong trend line connecting the highs of the day.  One glaring difference is the it broke above its Imoku Cloud.  Though, it appeared to be contained within the cloud as it backtested the SMA50 and the trend line at around 3:30.

    140812_174903_CQG_Integrated_Client_Chart_USDJPY_-_Japan_(Yen)_5_Min

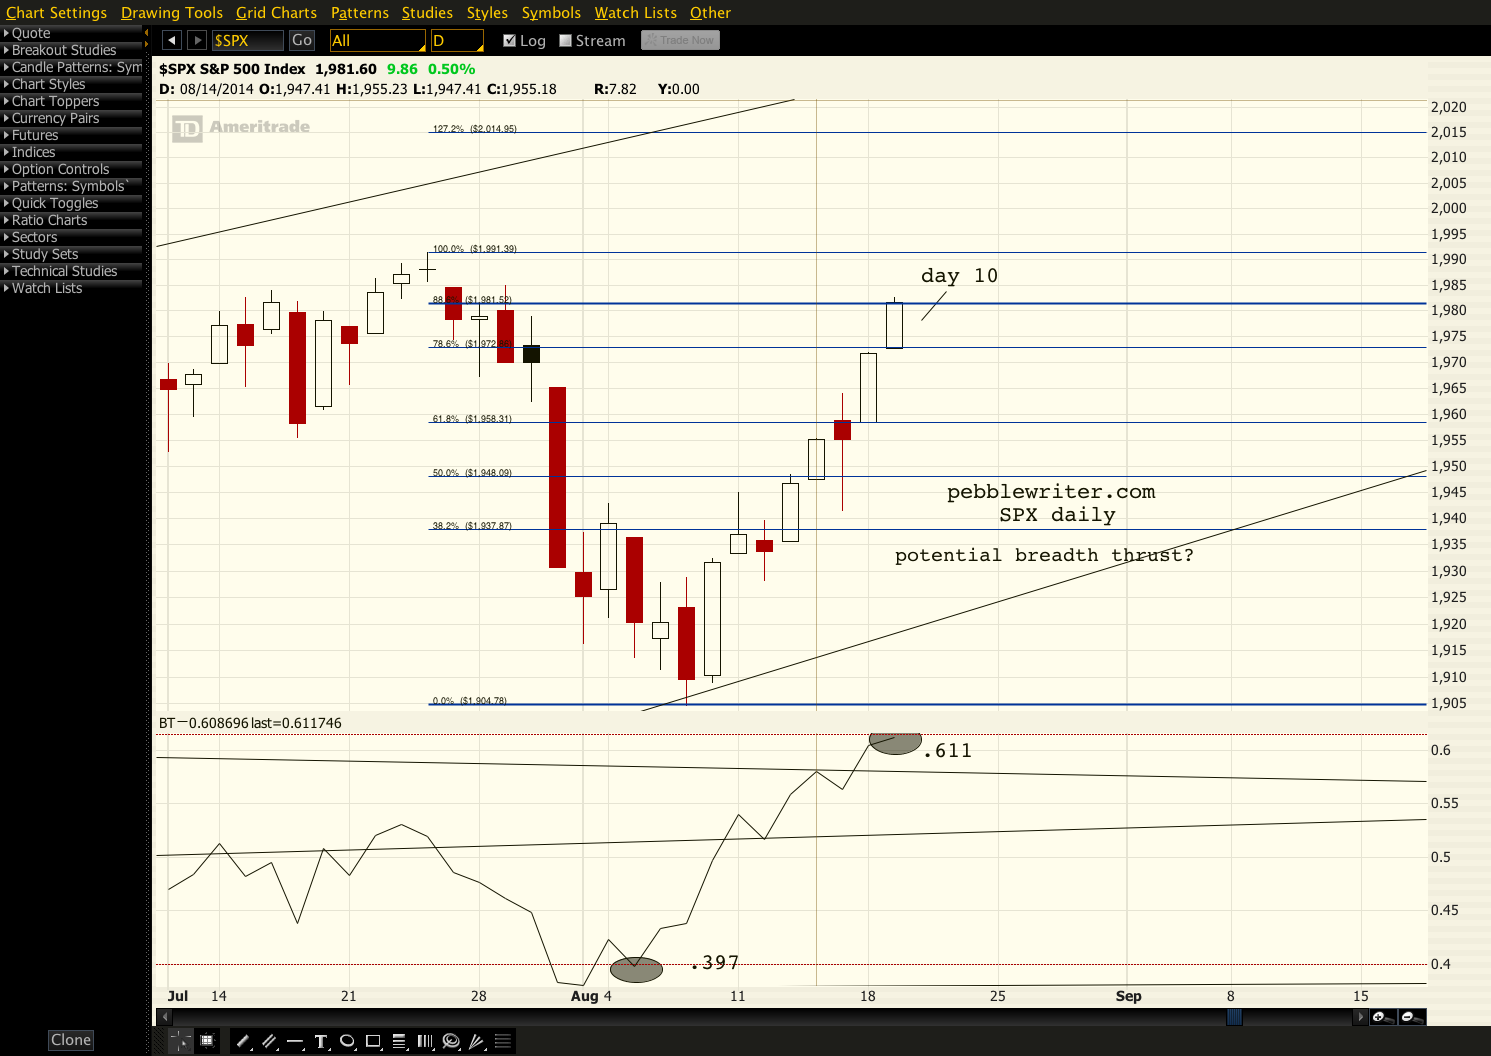
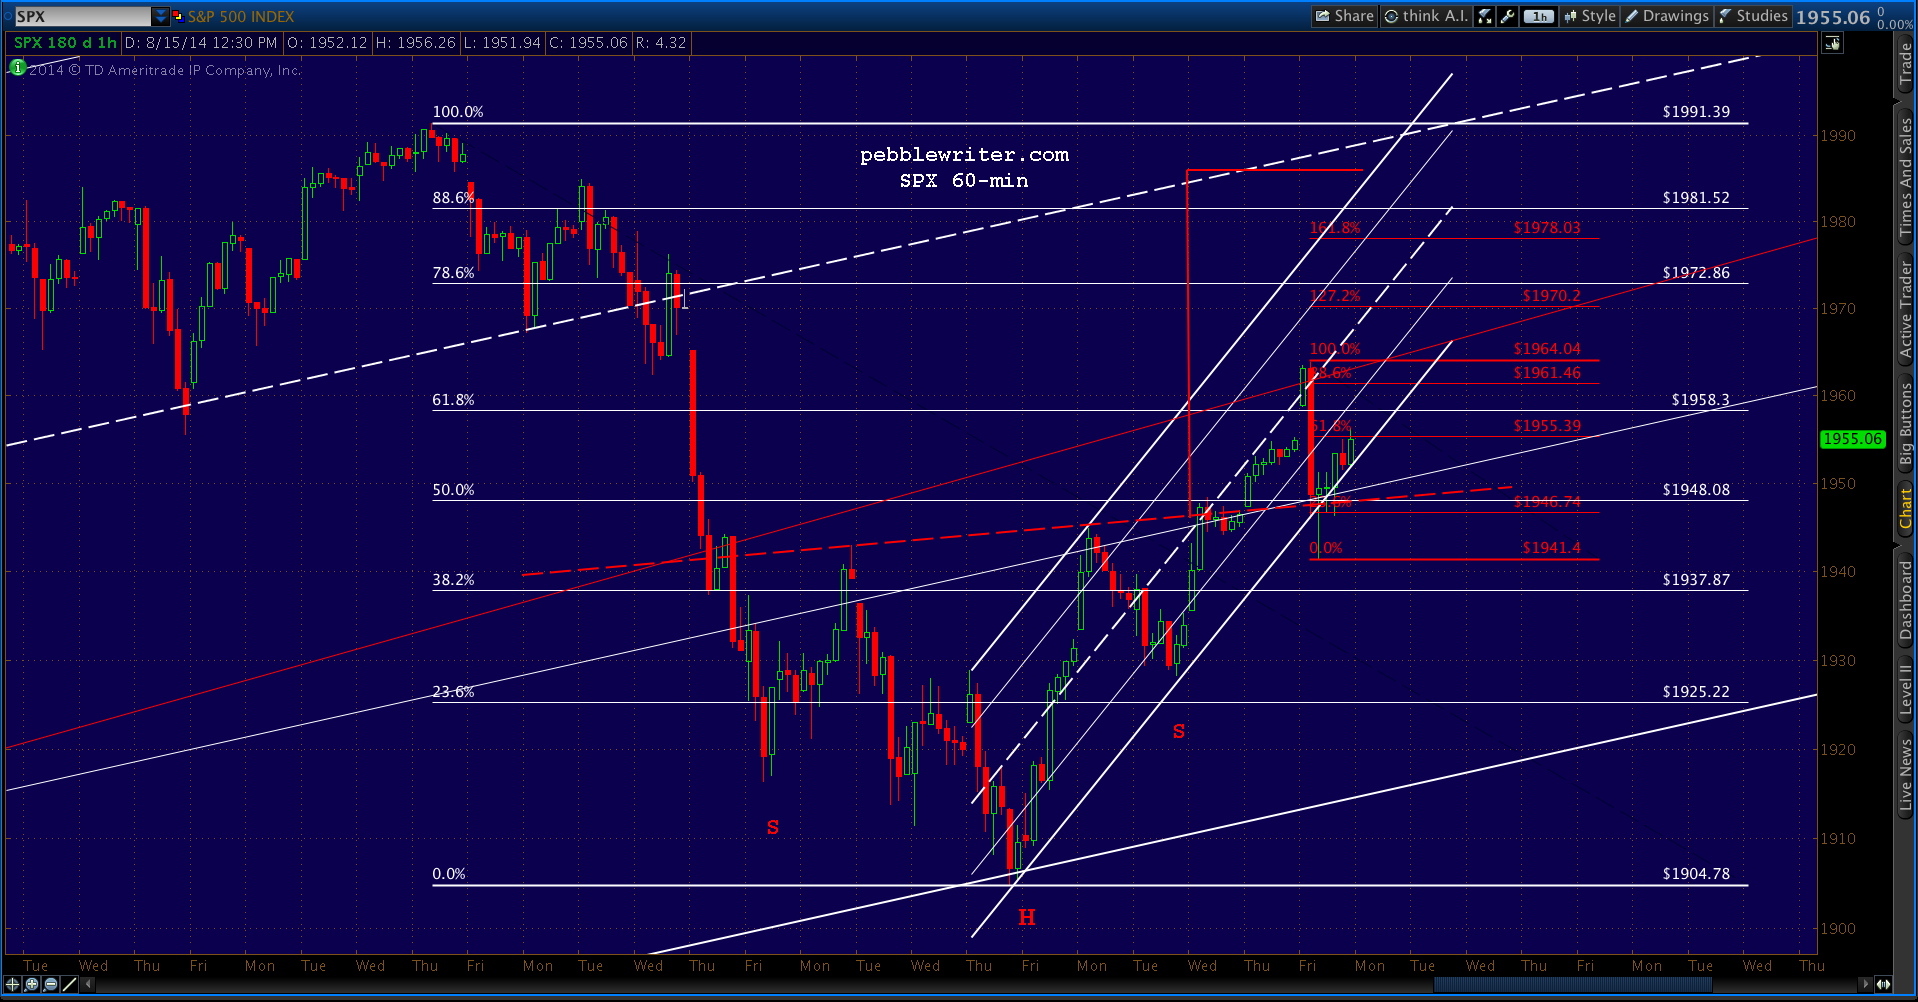
    In an unrigged market, one might expect both ES and USDJPY to turn lower in the last half-hour of trading.  From a harmonic standpoint, ES was aiming for a very mild 38.2% retracement (1921.61) of its rise from last week’s low.  It broke through the .236 (1929) without too much fanfare, and was backtesting it at 3:30 (shown below.)

    But, the USDJPY reversed higher when ES arrived at 1923.50.  And, when ES reached its trend line and the bottom of the Imoku Cloud for what should have been the start of another downturn, USDJPY suddenly spurted higher – breaking out of its downtrend (the top of its cloud, its trend line, a fan line, and the SMA50) on absolutely no news.   See Point A below.

    140812_175136_CQG_Integrated_Client_Chart_USDJPY_-_Japan_(Yen)_5_Min

    The impact on ES was powerful.  Within a few minutes, it followed suit – pushing up through the bottom of the cloud, the 100-period moving average, and its trend line.  Again, no news…just a strong signal from USDJPY that it should move higher.  Just in case the signal wasn’t clear enough, it was accompanied by the sudden cancellation of large sell orders that were positioned a few ticks higher, a vicious monke- hammering of VIX and 10-year note futures, and a 25-pt gap higher on Nikkei futures on negligible volume.

    140812_174843_CQG_Integrated_Client_Chart_EPU4_-_E-Mini_S&P_500_Sep_14_5_Min

    The result: ES shot up through the falling cloud, where it lingered until the 10-period moving average (thin, red) could catch up and provide support.  Note that the SMA5 carried it up to the SMA200 (thick, red) where it lingered until (need we ask?) another spurt by USDJPY got it over the hump (Point B.)  I don’t know where it goes from here, as USDJPY is bumping up against its 200-day moving average (102.34.)  It’s not that the market makers and/or BOJ can’t push it on through.  But, for such major moves, they usually wait until the middle of the night after Tokyo is done for the day (4am ET.)

    More typically, they’ll bring USDJPY back down to earth while propping ES up directly.  The overnight volume is ridiculously low, and the afore-mentioned tricks will usually suffice without having to involve USDJPY.  It shouldn’t be too difficult, given that ES is now perched safely on top of the rising Imoku Cloud.

    140812_200441_CQG_Integrated_Client_Chart_EPU4_-_E-Mini_S&P_500_Sep_14_5_Min

    The chart below shows both instruments and the various turning points USDJPY provided during the day.

    2014-08-12-ES v USDJPY


    Again, there’s nothing like a real-time, side-by-side comparison to appreciate the actual impact.  After seeing this done nearly every day for many, many months, it’s become fairly depressing.  The talking heads lament the markets’ low volume, but rarely acknowledge HFT and algos, much less discuss the huge impact they’re having.  The big HFT firms have wised up a bit, especially after Michael Lewis’ Flash Boys exposed many of their dirty little secrets.  They’re careful which way they push the market.

    What’s the big deal, as long as HFT and algos are used to drive the market higher?  Who doesn’t want higher stock prices, even if it comes at the expense of the legitimacy of the market?  The regulators are certainly aware of what’s going on.  But, as one client asked earlier today, how can we expect the feds to do something about it, when The Fed is one of the primary enablers?

    No doubt, the scourge will continue on just as long as it drives prices higher and provides plenty of commissions to the exchanges – no matter how many traders are run over in the process.   Should it cause, say, another flash crash, you can bet your bottom dollar there will be a swift and thorough investigation.

    Sigh…


  • Charts I’m Watching: Aug 12, 2014

    The rebound yesterday held fairly well, but USDJPY weakness this morning is softening up the futures.  Here’s the recap on SPX, showing the TL from 2012 holding, and a probable test of the 20 and 50 day moving averages at the purple .618 if the bulls can keep it together.

    2014-08-12-SPX daily 0600

    There’s clearly much more downside potential if the red TL doesn’t hold — with the SMA200 coming up on the white .618 toward the end of the month.

    Whatever the impetus might be left in last week’s move, the USDJPY algos are clearly back in charge. The eminis won’t make a move without it — though sometimes the AUDUSD, VIX or ZN’s come into play.

    The USDJPY tagged its SMA100 this morning, after failing to retake the SMA200 yesterday. I don’t see any serious impediments on the chart, as the BOJ has reestablished an upward trend for the pair.  And, the Japanese economic data is worsening daily.  But, with all the moving averages bunched up like this, we’re likely to see plenty of chop in the days ahead.

    2014-08-12-USDJPY daily 0700

  • Charts I’m Watching: Aug 11, 2014

    Lots to catch up on after a week off… starting with last week’s big decline and (so far) recovery.  It wasn’t really that big.  But, when declines are so few and far between, it sure felt like it.  Check out SPX, which (finally) tested the trend line off the 2011 lows.

    2014-08-11-SPX daily 0600

    Looks pretty straight-forward, but it’s not.  In order to accommodate the Nov 2012 lows, the TL misses all of the 2013 and 2014 interim lows.  If we raise the TL a bit to catch at least the 2014 lows, then last week’s dip was below the TL, and the rebound through this morning is a backtest.

    2014-08-11-SPX daily 0650

    To further complicate matters, those are logarithmic charts.  In arithmetic mode, the TL fit is fairly bullish…

    2014-08-11-SPX daily 0700 arith

    …especially, when considering the moving averages.  Note the SMA100 tag, and the SMA10 which is being tested this morning.

    2014-08-11-SPX daily 0700 arith MAs

    It’s pretty clear to me that the algos are back in control this morning, with USDJPY/NKD ramps handily thwarting any attempts to digest any of the overnight gains. Bottom line, last week’s decline seemed rather contained/controlled.  My gut tells me it was permitted in order to bring a semblance of normality to the “markets” — to squelch the [quite accurate] criticism that the rally is being engineered.

    More later.