Month: July 2014

  • Charts I’m Watching: Jul 16, 2014

    Note: There will be no post tomorrow, July 17, as I have some pressing family medical issues to which to attend.

    *  *  *  *  *

    Watching the news on Fox/Time Warner this morning… I don’t know anyone in corporate at either shop, but know some of the studio folks very well.  Can’t think of a worse cultural fit…

    Another 1am ramp job last night with ES spurting 6-7 points after USDJPY broke out on several shorter-term clouds.

    2014-07-16-ES 15 0530

    The daily cloud still argues for a tough road ahead, as do the multiple moving averages just above.  The 10, 20, 50 and 200 are all between 101.7 and 101.92.  As always, it will come down to where the BOJ wants the pair to trade (if left to reflect market pressures, it would have plunged beneath 100 long ago.)

    2014-07-16-USDJPY 60 0500

    ES is pushing yesterday’s high which completed a Bat Pattern on the white grid and saw a reversal to nearly the .382.  Yesterday’s high also completed an IH&S; but, the subsequent reversal clearly did wiped out the right shoulder marked S1.  The question now is whether S2 — a much more appealing size/shape — might do the trick or we’re in for yet another head fake.

    continued for members(more…)

  • Charts I’m Watching: Jul 15, 2014

    Nothing new since yesterday’s chart.  Retail sales disappointed, Portugal’s banking crisis is worsening, etc.  The futures shook it all off because Yellen is testifying today, and nothing else matters.  If it’s like past testimonies, the Q&A will reveal nothing new; and, if there’s any kind of sell-off, it will be aggressively bought via USDJPY ramping and VIX pummeling.

    continued for members(more…)

  • Charts I’m Watching: Jul 14, 2014

    Sunday night ramp job (anyone surprised?) in force last night…  USDJPY, which collapsed Friday after ramping equities higher into the close, was pumped up from 101.23 to 101.52 by 3am EDT.

    2014-07-14-USDJPY 60 0610

    It’s another short-term bullish move in an otherwise still bearish longer-term picture.  But, the BOJ can keep this game afloat for much longer if they so choose.  And, the algos are definitely reinforcing its continuation.

    2014-07-14-USDJPY 4hr 0600

    ES fell in step and has tacked on 8 points since Friday’s close at the falling white channel top.  While the H&S Pattern isn’t officially kaput, it is hanging by a thread — especially given Yellen’s bullish testimony tomorrow and Wednesday.  In its place, an ever more convoluted IH&S pointing to 1982.

    2014-07-14-ES 60 0555

    This morning, Zerohedge ran an updated Merrill Lynch chart showing retail investors piling into the “market” as institutions continue to exit.  Retail participation is, of course, a contrary indicator.  When mom and pop finally overcome their fears from the last crash and jump in with both feet, it’s a pretty good sign that the party is winding down.  Here’s the chart:

    Screen Shot 2014-07-14 at 7.43.53 AM

  • Charts I’m Watching: Jul 11, 2014

    At the very least, we should se another test of the SMA20 (1959.40 in SPX.)  In a normal market, we would also test the white channel midline and perhaps the purple .886 at 1941.

    2014-07-11 ES 60 0630

  • Charts I’m Watching: Jul 10, 2014

    ES just completed a Gartley Pattern on the white scale, but has potential to the white .886/grey .618 at 1941ish — also the TL from Apr 14.  I would wait to see what USDJPY is going to do, however.   It inspired the dip from 1948 to 1945, and would no doubt instigate any further decline.

    Note that the irregularly-shaped H&S Pattern points to 1924 — the grey .886.

    2014-07-10-ES 30 0619

    UPDATE:  11:55 AM

    I have to duck out for a doctor’s appt, but a quick update first.  The bots have taken over (a shame, it was starting to feel like a real market there for a while) nudging ES up to a small IH&S target.

    2014-07-10-ES 1 0850

    In the process, ES is back to the neckline of the bearish pattern, and has been bouncing between it and the SMA20 ever since.  The rest of the day should be head fakes of one sort or another — with a possible dip to around 1951.50 between 12:15-12:30.

    Keep an eye on the USDJPY, NKD and the 10-yr futures, which have all established a bullish TL from this morning.  Breaks should be treated cautiously, but firm moves lower (higher in ZN) should be a sign of more downside we discussed earlier.

    The bots’ target is most likely the SMA10 at 1964ish (what banking crisis!?)

    GLTA.

    2014-07-10-ES 60 0850

  • Charts I’m Watching: Jul 9, 2014

    USDJPY and NKD are pointing higher…

    2014-07-07-USDJPY 60-min 0623


    2014-07-07-NKD 60 0700

    but, ES has yet to show its cards. (more…)

  • Charts I’m Watching: Jul 8, 2014

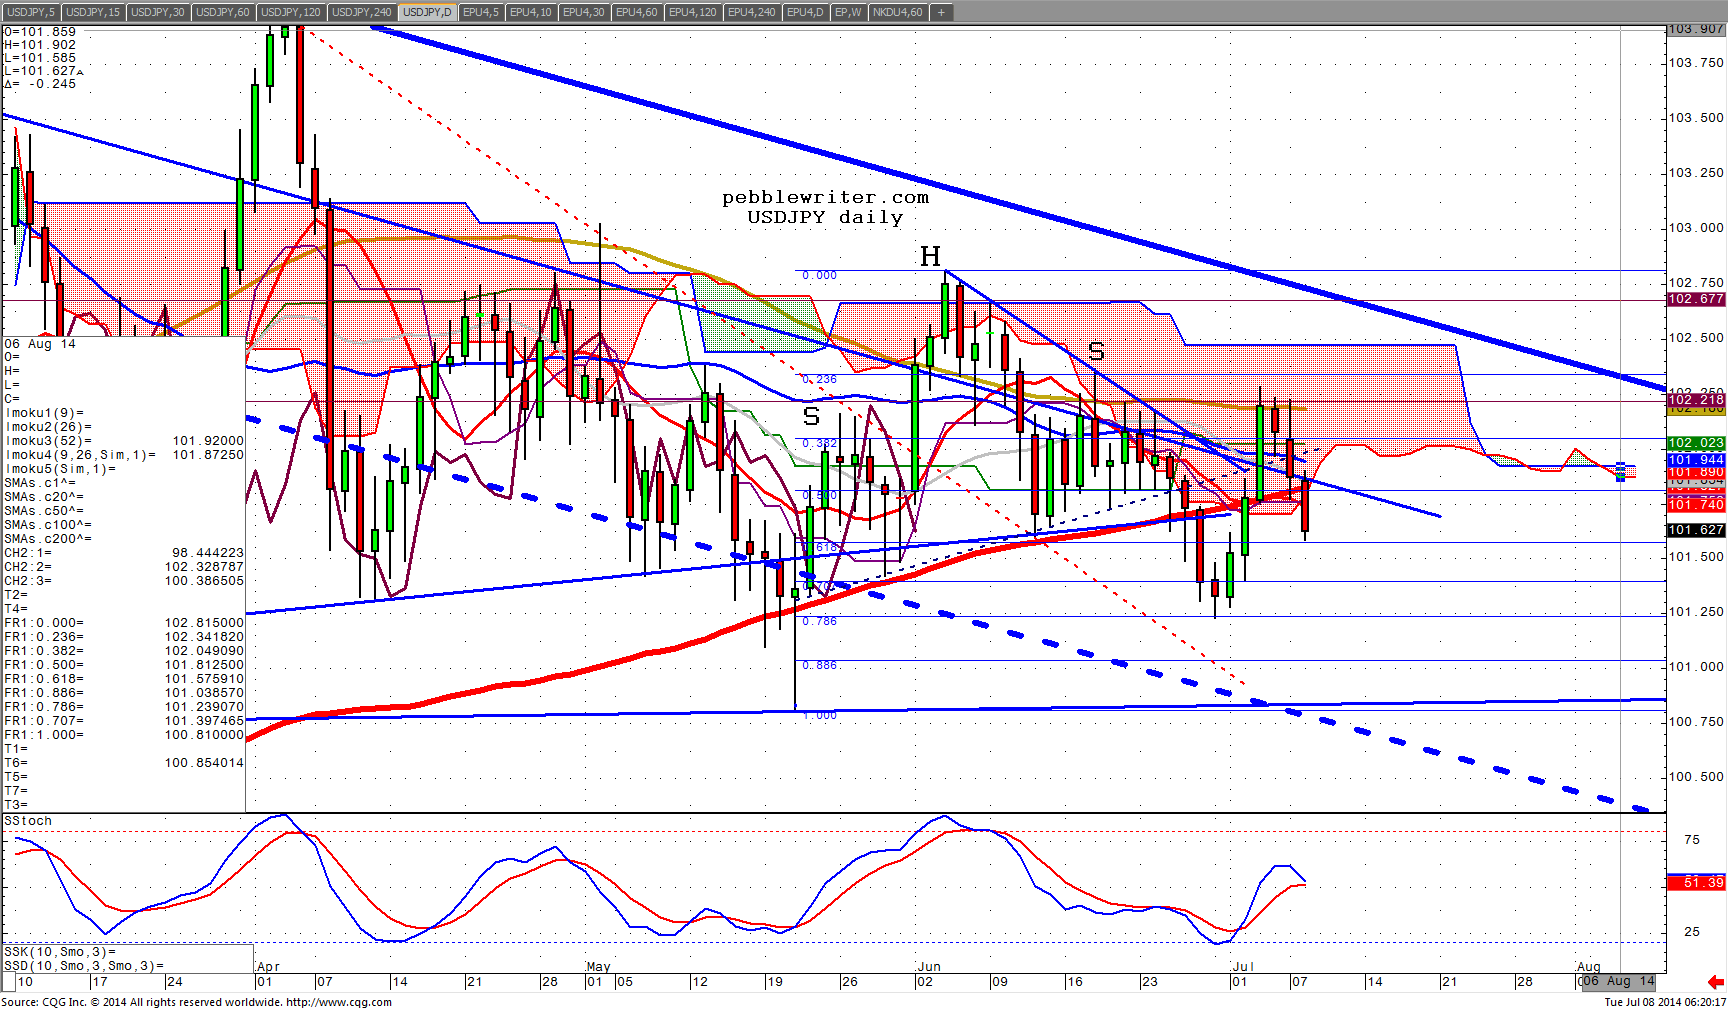
    USDJPY is back below the SMA200.  The assumption has been that the BOJ would maintain the pair in the 101-103 range going forward, but this development is clearly making traders nervous…


    USDJPY daily 0615

    …as is the strong reversal in 10-yr notes back into the falling channel.


    2014-07-08 TNX daily 0600

    Taking a look at VIX, it’s not hard to imagine a reversal of the market’s bullish fortunes.  Yet, TPTB have done a very good job of keeping the rally on track in spite of the glaring technical discrepancies.  I imagine SPX will get a bounce at its SMA10 down at 1967.

    NKD is finding support from the channel it has been tracing out since its break out in late May.

    2014-07-07-NKD 60 0700


    UPDATE: 12:40PM

    ES and SPX are both closing in on their SMA20’s (1951 and 1957), with ES’s .618 nearby at 1952.29 and SPX having already tagged its.  USDJPY is aimed at the .786 (101.45) or .886 (101.34), and NKD seems intent on 15200.  So, there’s a pretty good chance that ES/SPX reach their SMAs if the dip buying algos don’t get impatient.


  • Charts I’m Watching: Jul 7, 2014

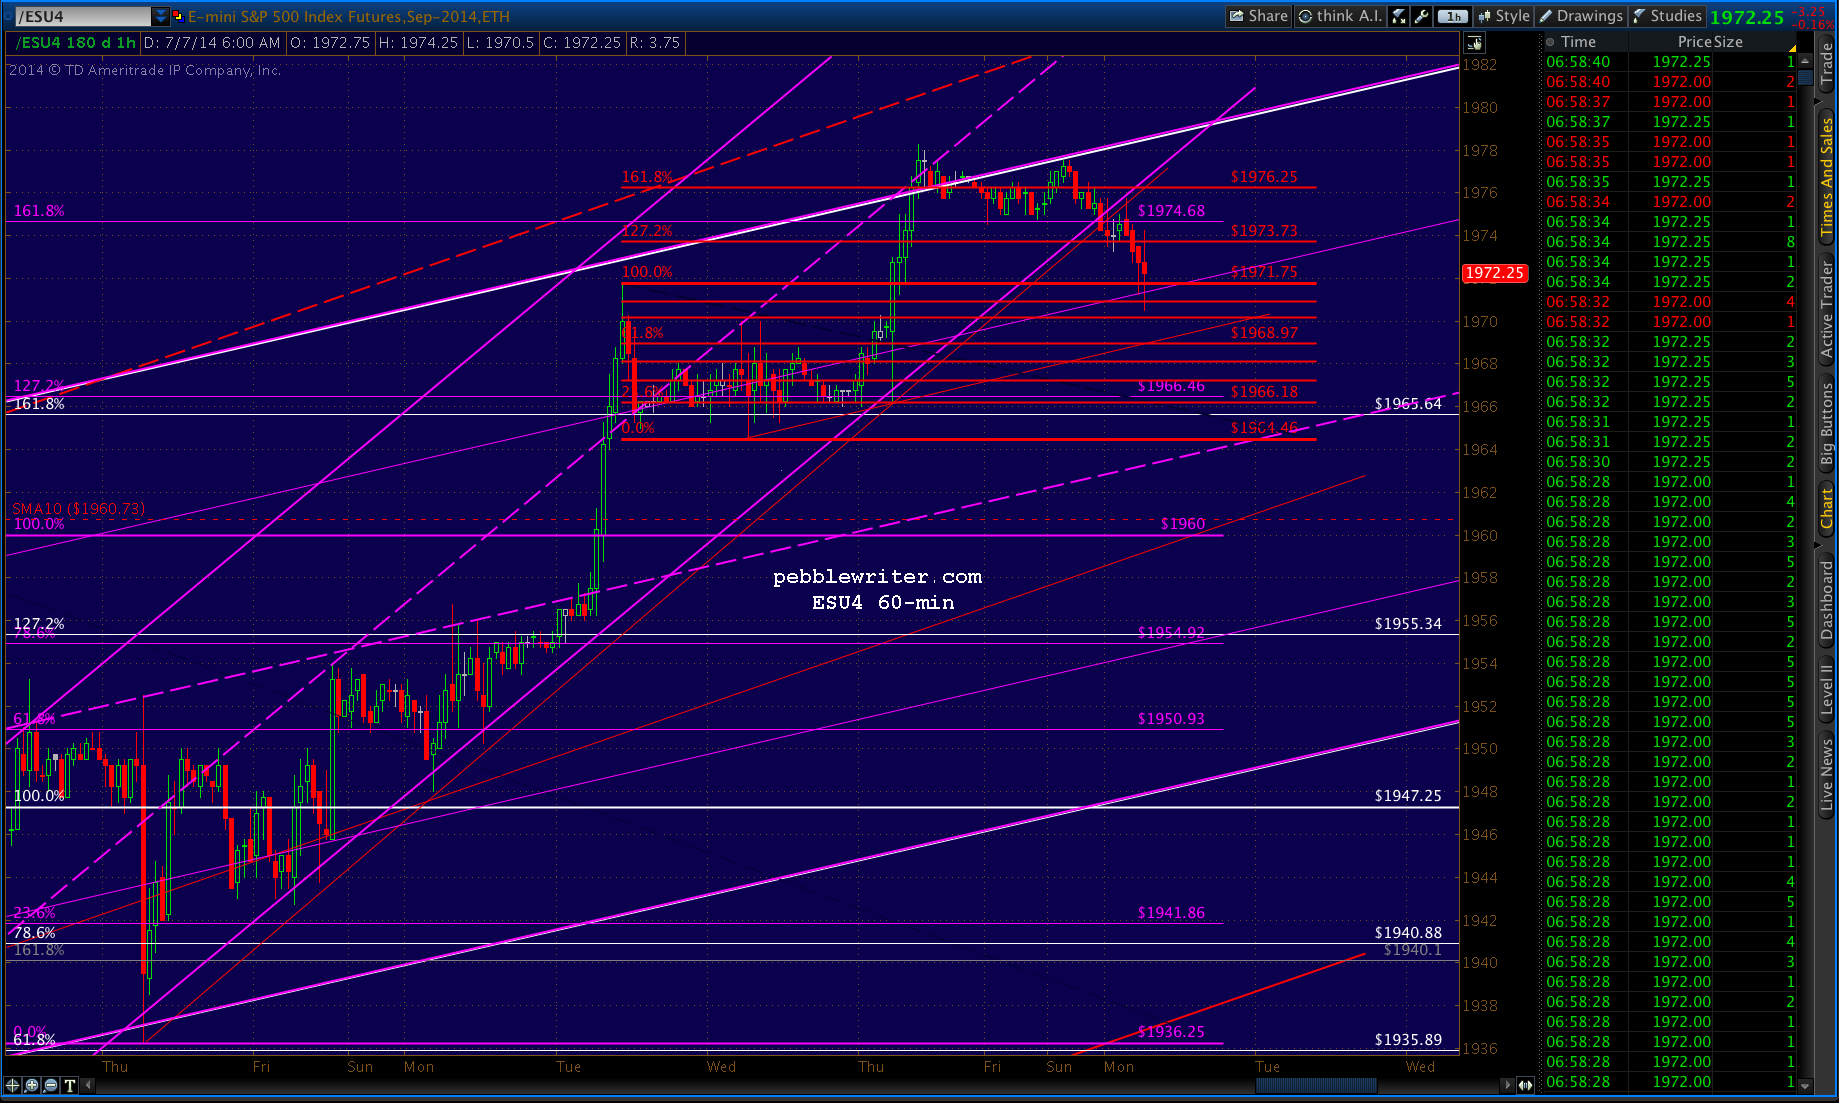
    USDJPY backtested its SMA200 this morning, leaving equities vulnerable to a pullback.

    2014-07-07-ES 60 0700

    The short-term picture:

    2014-07-07-ES 5 0730

  • Happy 4th of July

    I wish everyone a safe and enjoyable holiday weekend!

    The employment report boosted futures back to the point of resistance we discussed yesterday — the white channel top.  Stocks still face the decision of whether to reverse or break out.

    We often reach these points on the eve of holiday weekends, when volume is particularly low and TPTB can push it wherever they like.  I can’t remember the last time the “market” didn’t break out.  But, we should always be alert to the possibility that a big player will take advantage of the low volume/volatility to launch a bearish sneak attack a la this past New Year’s.

    It’s not likely though.  SPX gains on the days following all CME equity holidays in 2013 totaled 80 points, or about 5.6%.


    2014-07-03-ES 60 0600

    In addition to the white channel top, there is potential Fib resistance at both the purple 1.618 as well as the red 1.272 or 1.618.   Note the floor under prices this past week.

    2014-07-03-ES 15 0620

    Quick note on the payroll report itself…Not to throw a wet blanket on the report, but the total jobs increase of 288K includes almost 800K part-time jobs — the most since 2003.  Full-time jobs declined by 523K.  Real wages declined for the third month in a row.  Combined with the growing inflation we’re seeing, the stagflation argument is picking up steam.

    Screen Shot 2014-07-03 at 6.48.58 AM


  • Charts I’m Watching: Jul 2, 2014

    Break out or break down?  TPTB love holiday weekends, as they can push prices through resistance more easily while everyone’s on holiday.

    2014-07-02-ES daily 0500

    The bots are pushing USDJPY higher; but, a muted impact so far on ES.  Traders might be nervous after yesterday’s weak close (on an otherwise strong day for no reason whatsoever) that saw SPX return to the 1.272/1.618 Fib level we discussed.

    2014-07-02-USDJPY 15 0500

    Many of us have noted the shenanigans going on in VIX in the last minutes or even seconds of trading.  By slamming VIX lower, an algo forces prices higher — one of many manipulations occurring in the “markets” these days.

    2014-06-09-VIX 1 min three examples

    For those who haven’t seen it, yesterday’s Nanex article explains what’s going on:

    There is a new High Frequency Trading  (HFT) Algo afoot, probably designed to measure, or cause system latency. This algo sends extreme bursts of 1-share orders in a symbol to two different exchanges: Nasdaq and BATS. The result is a system-impacting surge of quote updates, similar to quote stuffing, but accompanied by an extremely high number of 1-share trade executions. These trade executions often consume the entire SIP output line, as indicated by continuous sequence numbers with no gaps. continued…