Month: July 2014

  • Charts I’m Watching: Jul 30, 2014

    Last night’s ramp job on the back of USDJPY, which sliced through the 100 and 200-day moving averages like they weren’t there, took ES most of the way.  The 4% GDP (ex-items?) print did the rest.  ES is sitting at an 8-pt gain prior to the open.

    2014-07-30-ESU4 15 0615

    Caution is warranted, as yesterday’s close marked the 3rd H&S Pattern in a row to complete without playing out (so far.)  The USDJPY/NKD ramp is BS, of course, as Japan’s industrial production fell 3.3% last month (versus 1.2% expectations.)

    2014-07-30-USDJPY 60 0615

    Still, the pair broke out.  If it can remain above the SMA200 long enough for the other averages to turn up and break the bearish alignment, it could drag stocks higher.  And, why shouldn’t it?  With the BOJ depressing the yen and actively buying stocks, it’s only a question of whether or not it fits their plans.

  • USDJPY’s Big Day

    USDJPY, having dutifully provided yet another overnight ramp job for ES, pushed up to tag the SMA200.  Note that the daily averages are still in a bearish alignment, though the 10 (red), 20 (gray) and 50 (blue) have recently curved up.

    140729_072038_CQG_Integrated_Client_Chart_USDJPY_-_Japan_(Yen)_Daily

    If the pair can push through the SMA200, stocks should follow.  If it pushed up much at all, it will have broken out of a very old triangle and would have potential to at least the .618 Fib at 112.37.  If not, the “market” is long overdue for a breather.  The last time USDJPY reversed off the SMA100 (July 3) and fell through the SMA200, SPX swooned by 33 points — a calamity by today’s Fed-inflated, volatility-deprived, algo-driven standards.

    2014-07-29-USDJPY daily MAs

    The BOJ and algo houses have propped up the USDJPY for months — particularly post May 2, when the rising white channel officially died.  The BOJ sees a lower yen as the key to increasing exports.  But, inflation is getting out of hand — killing off consumer spending at a time when tax revenue is sorely needed.  Algos use USDJPY as the basis for the largest carry trade out there — probably in the hundreds of billions if not trillions.  The cracks are starting to show.

    2014-07-29-USDJPY daily Chnl

  • Charts I’m Watching: Jul 28, 2014

    Friday’s conditions remain despite the late session VIX beat-down.  USDJPY’s SMA100 did, in fact, cross below the 200.  So, the daily SMA’s are all bearishly aligned — in addition to the TL resistance from the EOY highs.  The attempted break-outs over the past few sessions have gone nowhere.  Keep an eye on TL support at 101.76.

    2014-07-28-USDJPY 60 0530

    ES is playing its cards close to the vest, with the channel from Thursday and Friday yet to give up the ghost.  Our downside target remains until it can at least break out of the channel.  If things get going, ES 1959 is easily within reach, possibly 1956 or 1952.

    2014-07-28-ESU4 15 0600

  • Charts I’m Watching: July 25, 2014

    Amazon and Visa earnings should weight on markets today, but USDJPY is making a bid to blow through resistance.  This is critical, as the entire yen carry trade is at stake.  It was easy enough to burst through resistance overnight…

    2014-07-25-USDJPY 15 min 0625

    The daily chart shows the 100 and 200-day moving averages coming up on a potential cross, which would leave the 10, 20, 50, 100 and 200 all in a bearish alignment.

    2014-07-25-USDJPY daily

    ES has completed a little H&S Pattern, but has more downside potential if it’s permitted to get going.

    2014-07-25-ES 5 0545

    UPDATE:  2:00 PM

    ES tagged our H&S target, might be aiming for the Fib cluster at 1963-1964 (SPX 1968-1970.)  Decent channel support there, too.

    2014-0725-SPX 5 min 1100

  • Charts I’m Watching: Jul 24, 2014

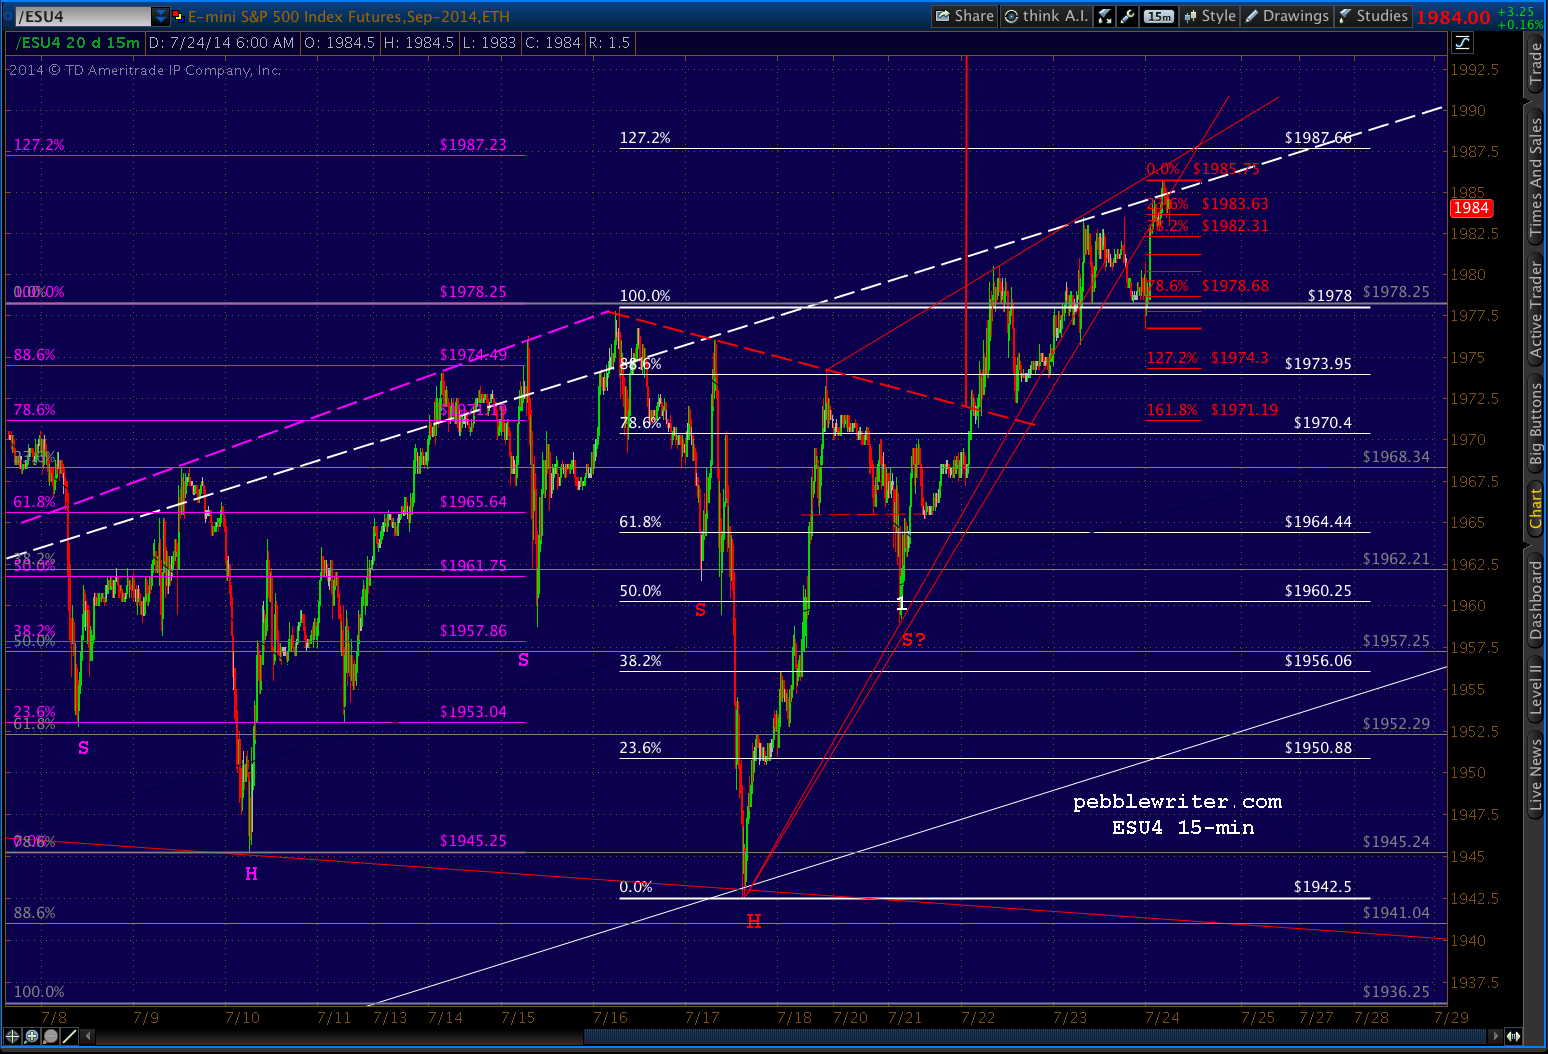
    Wednesday, the dip came early — with ES giving up 5 points early in the session before rebounding.  A Bat Pattern completed at 3am, sparking a 9-pt ramp job and continuing the “market’s” practice of making important reversals in the after-hours.  The net: hold overnight at your own risk, because the close is likely to be a head-fake.

    2014-07-24-ES 15 0615

    Interestingly, the futures have declined since the better than expected initial claims.  And, this on the biggest POMO day of the month. Go figure.

    UPDATE: 10:15AM

    Guess we know why the weakness on the opening, despite huge spikes in USDJPY and yields: the craptastic housing report was obviously well-known by some prior to the opening.  Like last June, no polar vortex, high interest rates or boogie man to blame it on…  From Zerohedge:

    Screen Shot 2014-07-24 at 7.16.38 AM

    In fact, it probably explains yesterday’s weak close, below the TL for SPX.  It’ll be interesting to see whether such dismal economic news can provoke even a small sell-off.

    Interesting historical note: the even worse July 2013 report was released on Aug 16.  SPX, in the middle of an 83-point, 18-day slump, fell 9 points on the day.  It was on the heels of a month-long correction that began on May 22 and knocked 126 points  (7.5%) off SPX.  At the time, the Fed was pumping $85 billion per month into the banks’ coffers (though Bernanke had already used the “T word” in June.)


  • Charts I’m Watching: Jul 23, 2014

    The Fed is pumping $4.5-5.75 into the “markets” today and tomorrow — making it easy for stocks to ignore war, earnings, inflation, interest rates, etc.  The past two days have been almost carbon copies of one another:

    1. sharp dip on the opening on bearish news to head-fake any bears left standing
    2. relentless algo-driven melt-up for several hours (USDJPY and VIX based)
    3. strong sell-off near the close to head-fake weak bulls into selling
    4. ramp job overnight to punish them for selling


    2014-07-23-ES 5 0600

    As usual lately, the reversals are coming at seemingly random spots.  But, a closer examination reveals what I believe is a calculated attempt to punish traders.   They’ll put the brakes on just short of Fib levels, blow through back tests, reverse before reaching established trend lines, and sell off immediately after making new highs — which leaves those of us who rely on chart patterns or technical analysis grasping for straws.

    For a while, they were targeting only bears.  Now, it’s grown to include anyone who doesn’t simply buy every dip and hold long overnight.  The answer is simple: buy every dip and always hold long, right?  That strategy has certainly paid off better than trying to exploit any downside moves. The chart below shows just how treacherous trading has been for the past month.

    The purple grid, including a completed IH&S Pattern that never failed at the neckline, was a total head-fake to bulls and bears alike.  It remains to be seen whether the red IH&S, also completed, will play out or whether we’ll churn some more.  The larger channels, BTW, have become almost meaningless lately.

    2014-07-23-ES 4hr 0600

    History tells us that a crack in the markets is a question of “when” and not “if.”  In the past, whenever bearish capitulation was complete, TPTB have allowed (or engineered) a strong downturn that flushed buy-the-dippers into oblivion — the better to induce the Fed into continuing the gravy train.  Will this time be any different?

    I will be out most of the day tending to family health matters.  Any prayers would be much appreciated.

    *  *  *  *  *

    USDJPY reacted at the falling TL we discussed yesterday, but immediately rebounded to push stocks higher.  It plummeted overnight, when it didn’t matter to ES, and will probably rally up through its moving averages again today in order to facilitate the continuing melt-up.


    2014-07-23-USDJPY 60 0600


  • July 22, 2014

    As discussed yesterday, the dip at the close was yet another head-fake.  Is it any wonder volume has dropped to laughable levels?  It was followed by the USDJPY driven algo which kicked in around 4am ET.  Keep an eye on USDJPY this morning, as it just tagged a TL off the Jul 3 highs and might have trouble punching through during market hours.

    2014-07-22-USDJPY 15 0456

    Also in a position to break out or break down: ESU4.  It topped the IH&S neckline we’ve been discussing (also overnight, naturally.) It targets ES 2005.  But, remember, these patterns have been extraordinarily unreliable of late.

    2014-07-22-ESU4 15 0456

    We have CPI at 8:30 and Existing Home Sales at 10:00.  No POMO today, but a big day tomorrow. GLTA.

    UPDATE: 8:50AM

    USDJPY in plunging, 10-yr rates are plunging, EURUSD is soaring — but ES is being propped up like there’s no tomorrow — defending that IH&S neckline after gaining 3.5 points on the news that (IMHO) we’re entering stagflation territory.

    2014-07-22-ESU4 5 0556

    Looks like another day of the “market” being run by the programmers…


  • Charts I’m Watching: Jul 21, 2014

    USDJPY continues to consolidate, with a likely 100/200 SMA cross coming up in the next few days.  This would leave the 10, 20, 50 in bearish alignment, all below the SMA 200.  Yet, the chart shows clearly that — even in the absence of increased QQE — the BOJ has zealously guarded the 101 price level.

    2014-07-21-USDJPY daily 0530

    ES continues to benefit from the daily ramps, while suffering none of the after-hours corrections.

    2014-07-21-ES daily 0530

    Friday’s ridiculous melt-up came benefit of the algos, with no discernible dips on the way to a 88.6 retrace.  While an IH&S appears a possibility, hardly any of these patterns have played out lately.  The most likely next step is a continuation of the whipsawing that has characterized the past 7 months…

    2014-07-21-ES 15 0600

    …driving SPX ever higher without any economic or earnings justification, on multiple expansion and Fed backing alone.

    2014-07-21-SPX daily 0600

    UPDATE: EOD

    The close was weak, but a manufactured weakness as the obvious target of ES 1972.50 was easily in range…had USDJPY merely gone sideways. Seems like the market makers didn’t want any company on the upside, and forced the ES dip-buying crowd out with a USDJPY/NKD (on 4 whole contracts!) dip and the sudden withdrawal of large limit orders just beneath ES’s trading level.

    2014-07-21-ES 5 1322

    Gotta say, this is getting really, really old: early morning dip (most of it coming in the after-hours, and not quite reaching the logical target) followed by a melt-up driven by easily manipulated USDJPY/NDX, 10-yr futures, VIX and of course the algos.   The question isn’t “is the market rigged?”, but “is there ever more than a moment when it isn’t rigged?”

    2014-07-21-ES 15 1322


  • Charts I’m Watching: Jul 18, 2014

    Back in the saddle today, but lots of catching up to do.  Here’s the basic situation:

    2014-07-18-ES 60 0600

    SPX fell to a TL and Fib that could legitimately serve as a bottom for this move.  On the other hand, a drop to the purple .886 — also a channel midline — would be more definitive.

    We got the usual ramp job overnight, though it started very early in the afternoon this time.  It was good for a 16-pt bounce off yesterday’s bottom — completely based on USDJPY manipulation.  ES has almost reached the SMA20 at 1961.  SPX’s is at 1967.

    The bottom, BTW, would have been more appropriate at 1940-1941 — a trio of Fib levels.  But, the algos don’t much care about Fibs…  If you’re a cash market trader who stayed short into the close based on the huge geopolitical events going on, you have HFT/algos to thank for screwing you over yet again.  It’s a big reason for why the “market” is broken, and volume has disappeared. Write your congressman.  Seriously.

    2014-07-18-ES 5 0615

    No POMO today, but it is OPEX.  More later if there’s time.  GLTA.

  • Charts I’m Watching: Jul 16, 2014

    Note: There will be no post today, as I have some pressing family medical issues to which to attend.  I’ll hopefully have a chance to do a wrap-up later this evening.

    GLTA.