Month: June 2014

  • Charts I’m Watching: Jun 16, 2014

    Stocks have some decisions to make this morning.  Key channel for ESU4:


    2014-06-16-ES 4hr 0640

    The close-up:

    2014-06-16-ES 5 0640

    As long as the BOJ is explicitly managing USDJPY, it will probably continue to move sideways.  But, sooner or later, it’ll have to either break out or break down below the SMA200.

    2014-0616 USDJPY daily

  • Charts I’m Watching: Jun 13, 2014

    Powerful forces at work this morning. We’ll see which one wins out…

    a) Friday the 13th
    b) full moon
    c) mass coronal ejection
    d) wars in Iraq and Ukraine
    e) USDJPY/NKD ramp job


    2014-06-13-USDJPY 60 0611

    2014-06-09-NKD 60 0630

    2014-06-13-ES 5 0611


  • Charts I’m Watching: Jun 12, 2014

    The little IH&S that was setting up yesterday afternoon might still be in play. Keep an eye on 1838.50.

    The trouble in Iraq is one of those game-changers.  We’ll see if TPTB decide whether or not it matters.  Lousy retail sales…but, since when does economic data matter to the market?


    2014-06-12 ES 15 0600

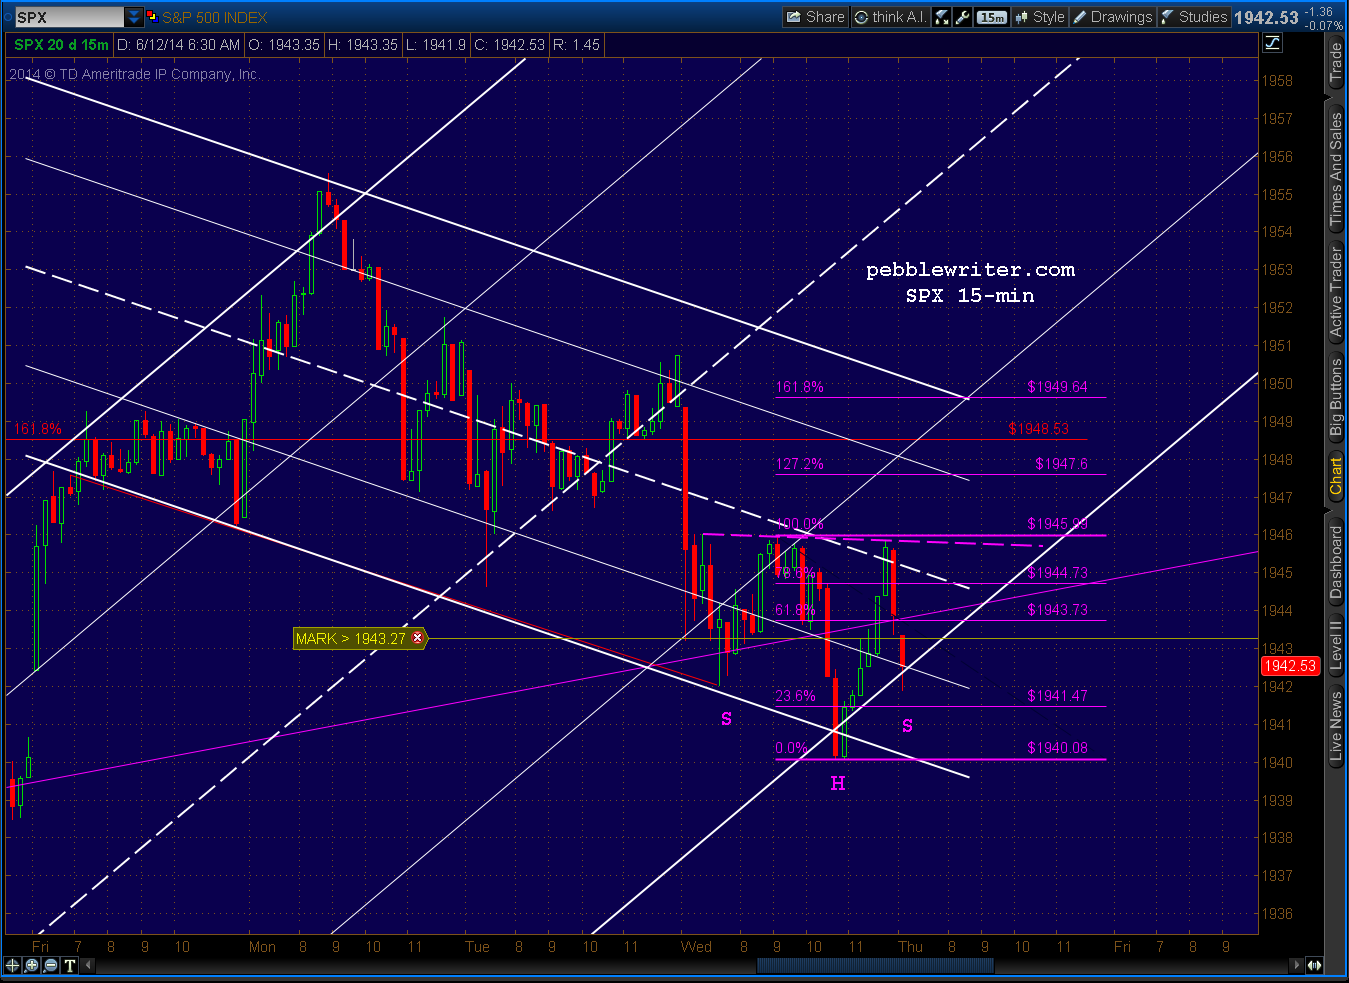
    Here’s a look at SPX now that the market is open.

    2014-06-12 SPX 15 0635

    UPDATE:  9:50 AM

    Another absolutely non-sensical day from a charting standpoint.  Remember when breaking a significant low used to mean something?

    2014-06-12 ES 5 0645

    What could turn things around like that?  Here’s the culprit…about 200 contracts of NKD, nominal value around $15 million.  In this bot, NKD drives USDJPY which drives ES (140,000 contracts, nominal value $13.5 billion in the last hour) which drives SPX.

    Welcome to the wonderful world of algos…where the tail not only wags the dog, it makes the dog its bitch.

    2014-06-09-NKD 15 min 0650

    UPDATE: 1:55 PM

    Downside after all…led by the 10YR (hitting channel resistance and an important .618) and the USDJPY (approaching its SMA200 and a .886 at 101.57.)  NKD reaches channel and Fib support at 14,835.

    SPX has dipped below the TL connecting the 2011 top to the .Dec 31 top, but approaching a combo .786/.886/1.618 of support at 1926.77.

  • Charts I’m Watching: Jun 10, 2014

    Another VIX beat-down in the final seconds of trading yesterday, interestingly right to a .786 retrace.

    2014-06-09-VIX 1 0500

    USDJPY corrected overnight, testing the SMA100 yet again.

    2014-06-09-USDJPY daily 0600

    And the little channel on NKD broke down, yielding a whopping 4-point decline in ES.  The red channel is a regression channel.  If it doesn’t hold, the .618 is just below at 14836.

    2014-06-09-NKD 15 0600

    ES is bumping along a gently sloping TL/neckline.  The SMA10 is down around 1931, but that would mean a departure from the acceleration channel and actual downside. It is back below the white 1.618, but lately these declines have a shelf life of around 15 minutes.  We’ll see…

    2014-06-09-ES 15 0620

  • Charts I’m Watching: Jun 9, 2014

    SPX/ES topped their 1.618s at the close Friday…

    2014-06-09-15 in 0605

    … thanks to an increasingly common vicious VIX bang in the final minutes of trading.  Zerohedge put out an interesting commentary tying it to Citadel and the Fed.  Don’t have any details on this, but where there’s smoke…

    2014-06-09-VIX 1 min 0600

    Perhaps it’s just coincidence, but murdering the VIX like this got SPX barely back over its 1.618 (1948.52) in the last 30 seconds of trading on Friday.  A close north of an important Fib level damages the harmonic pattern and, in this case, also negated a tiny H&S pattern that pointed a whopping 3 points lower.

    2014-06-09-SPX 1 min 0800

    Bottom line, folks, it’s an all-out assault on any bearish pattern that pops up.  St Louis Fed President Bullard was quoted this morning as saying that the Fed “shouldn’t be intervening all the time” in the markets.

    A careful reading of the remark would indicate that even he believes it should be intervening some of the time.  As in Japan — where the BOJ is directly purchasing equities with freshly printed yen — intervention at any time renders the market no longer a market, but a scripted outcome.

    The Nikkei reached the .886 we were watching – several times.  Keep an eye on the little white channel, as a breakout or breakdown will likely determine the next major moves for US stocks.  Sure it’s ridiculous, but it’s been working.

    2014-06-09-NKD 60 0600

  • Charts I’m Watching: Jun 6, 2014

    A lot of chop this morning in the futures following the jobs report.  In addition to USDJPY — which is mired in between all its daily moving averages,  keep an eye on SPX’s acceleration channel.

    2014-06-06-SPX 60 0600

    UPDATE:  11:20 AM

    FWIW, SPX just tagged the purple 1.618 set up by the drop from 1897 to 1814 in early April.  In an unrigged market, not run by algos, I’d say this is a good spot for a reversal to at least the yellow 1.618 at 1918.36.  In a more normal market, maybe even the purple .786/yellow 1.272 at 1879.  In a market reflecting the real economic state of affairs, interest rates, earnings, etc. — more like 1800 or lower.

    2014-06-06-SPX 60 0819

    Enough “what-ifs.”  The bears will be lucky to get a gap fill at 1940.66.

  • Charts I’m Watching: Jun 5, 2014

    SPX has broken through the previous highs and appears headed for the purple 1.618 at 1848.52.  On the other hand, it just reached the TL connecting May 2, 2011 and Dec 31, 2013 again.

    2014-06-05-SPX daily 0906

    Watch how the bell cows of NKD and USDJPY behave at this juncture.  USDJPY, in particular, has had trouble breaking out — even after successfully backtesting its SMA100 again.  Probably just needs to consolidate a bit.

    The e-minis have reached a minor 1.272 in what has been essentially a straight shot higher.

    2014-06-04-ES 5 915

  • Charts I’m Watching: Jun 4, 2014

    Another day, another snap-back rally to test the top.  This one reversed exactly at yesterday’s lows (probably just a coincidence.)  SPX’s Crab Pattern target of 1926.77 is still out there, so be careful of any new highs here on SPX/ES.

    2014-06-04-ES 30 0715S

    USDJPY may have topped out for now, but the white .618 is still a possibility — and, a likely ally in any push higher in the “market.”

    2014-06-04-USDJPY 30 0715

    We should see more of this chop until Draghi’s big announcement tomorrow.  What will the ECB do?  Smarter guys than me are certain it’ll be negative interest rates.  I happen to believe more LTRO s and an expansion of relieving the “dead banks walking” of more of their crappy paper/derivatives.  Whatever the announcement, the “market” will probably sell off viciously for all of 30 seconds before rallying to new highs.  Sigh…

    I have more Comcast issues, so will sign off now.  GLTA.

    UPDATE:  11:15 AM

    Quick update…ES and SPX just made new highs, so all those pretty harmonic patterns showing potential downside targets are garbage. Remember the SPX 1926.77 target, though.  If SPX should reach it during trading hours, we could see a decent sell-off.

    The way the algos have been working lately, however, is to push to a new high (to stop out the shorts, if there are any still alive) and then linger there near an obvious harmonic or chart pattern reversal point to keep the newly minted bulls in the game until the rug can be pulled out from under them — preferably in the after-hours.

    If the talking heads on the boob tube really wanted to discuss where all the traders went (why this is the most-hated bull market in history) they’d spend a day or two talking about algorithmic trading.  It is undermining the integrity of the “market” just as surely as is the Fed and is slightly more important than driverless cars or the latest funny-money acquisition.


  • Charts I’m Watching: Jun 3, 2014

    Watching the USDJPY this morning, as it tries to decide whether to push through the SMA100.  A reaction off the channel line and .500 Fib would make sense.

    2014-06-03-USDJPY daily 0600

    The direction should determine whether stocks continue their run or not.

    2014-06-03-USDJPY 30 0600

    The Nikkei had a big day yesterday, breaking out of the triangle it’s been in since the beginning of the year as well as the SMA200.  Now, it’s bumping up against some potentially important Fibs.  Backtest of the SMA200 at 14811 or the triangle itself?

    2014-06-02-pebble

    Harmonics haven’t been terribly effective lately, but there is a potential Gartley Pattern at work in ES.  If it’s to play out, we could see a backtest of the broken white midline first.

    2014-06-03-ES 30 0600

    GLTA.