Month: February 2014

  • Charts I’m Watching: Feb 28, 2014

    USDJPY is back below the TL, but having a very hard time letting go.

    As well-defined as the yellow channel is (the white, not so much), there have been numerous slips beyond the midline over the past few years since Abe created it.

    But, the immediate challenge will be surviving the backtest sure to arrive with the pre-opening ramp…

    UPDATE:  10:00 AM

    Looks like a slight bump in Michigan Sentiment (81.6 vs 81.5) expected is worth more than the GDP miss (2.4% vs 2.6% expected) and existing home sales miss (0.1% vs 0.8% expected.)  Preposterous.  Of course, USDJPY broke through the TL again.

    And, even more preposterous, EURJPY spiked (though it tagged a tasty .886.)

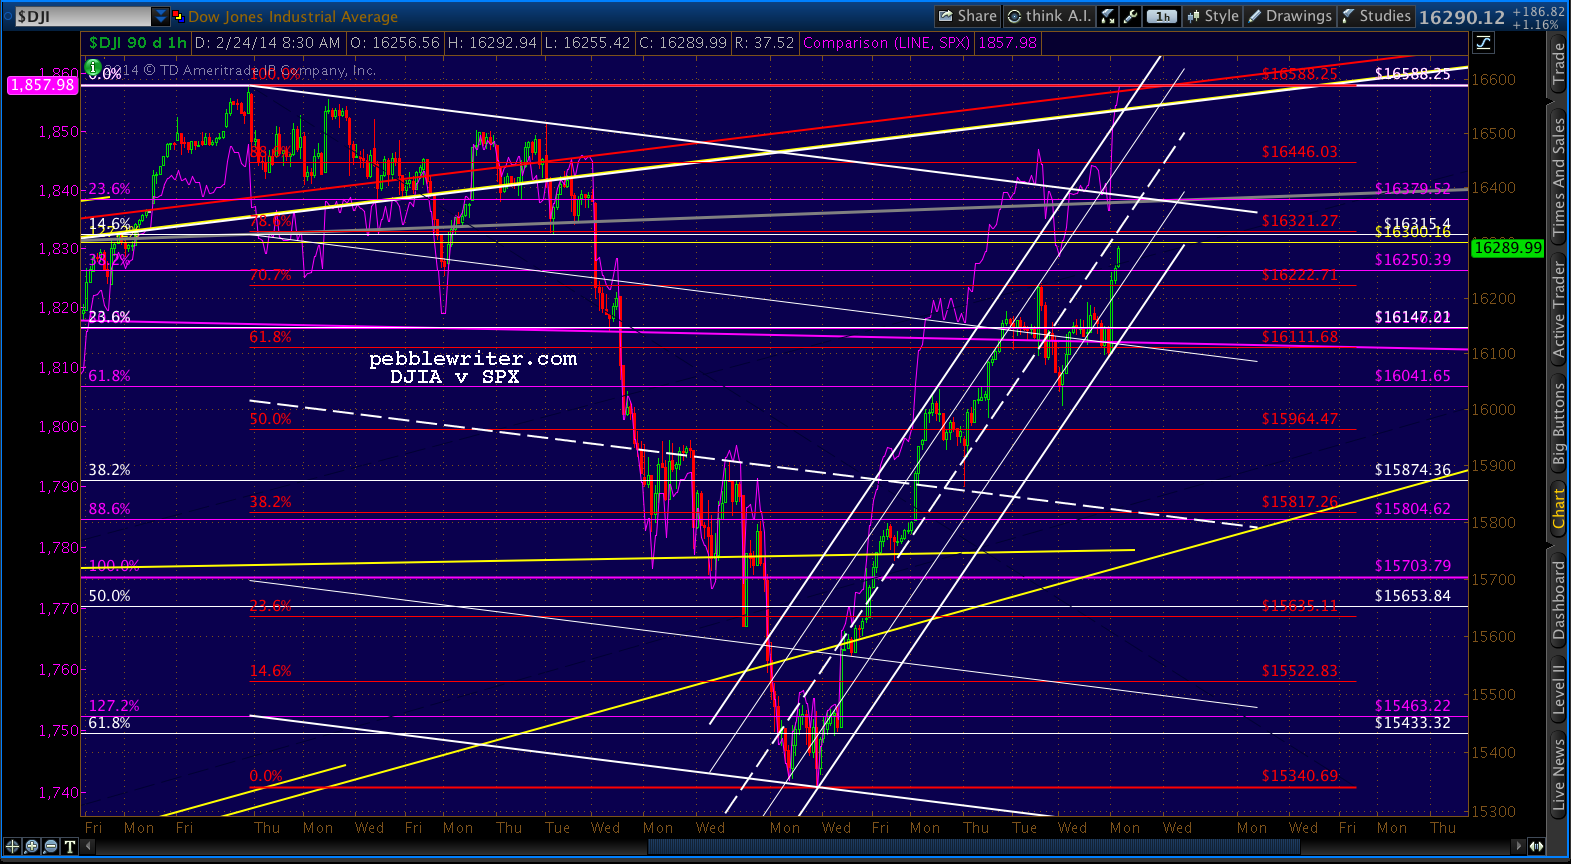
    At least DJIA finally tagged the .786, which it came up just short of earlier in the week.  It’s backtesting the well-formed channel — which, in the real world, should provide resistance.  But, this is a fairy-tale, make-believe world where unicorns soar through the sky farting rainbow-colored good news and bad news (Ukraine, Argentina, China, housing, GDP, retail sales, etc.) simply doesn’t exist.

    The Bernanke put redux.

    Ditto for ES, but at ludicrous levels.


    continued

  • Charts I’m Watching: Feb 26, 2014

    I’ve been watching the THBJPY as an indicator of our EM thesis playing out.  It’s been a pretty good measure of risk appetite (aka Abe’s ability to trash the yen and send hot money scurrying into peripheral markets.)

    Like USDJPY, it has rolled over but is being propped up.  The latest stick save came moments ago.

    It’s tough to do when the Nikkei is under the kind of pressure it is to complete the right shoulder of its H&S Pattern…

    …not to mention the pressure the yen faces since the EURJPY channel broke down.

    And, yes, that’s a backtest of the .618 fib of the 2008 to 2012 plunge from 169 to 93.  But, I digress…

    THBJPY’s small, white rising channel is trying to hold back a very serious plunge to 2.8 or lower.  Since the rising purple channel broke down around New Years (when most equity markets topped out) the falling white channel has been in charge — but, ran into the midline of the rising white channel for a third time.

    It looks like a bit of a standoff until you look at the moving averages.  The SMA50 (blue) fell below the SMA100 (yellow) in July 2012 and the SMA200 (thick red) in Sept 2012.  It bounced back above the SMA100 in November, but crossed back below on Tuesday.

    At present, it’s a very bearish alignment of the 20, 50, 100 and 200 — with the SMA10 threatening to roll over.  The last time even the 10, 20 and 50 were in perfect alignment and plunged below the 100, the THBJPY dropped 12%.  This time, they’re below the 100 and the 200 — which, to my eyes, is rolling over big time.

    A similar move would take the pair down near the purple .618 at 2.80.  But, of course, it depends on how many fingers the BOJ can come up with.  At present, they’re plugging holes in JGBs (witness yesterday’s bought auction of 40 years at 1.75%), USD (another stick save at 1.20 today for USDJPY), bhat, won, ringgit, rupiah, rupee, Thai and Singapore dollars, etc.  Debt:GDP was around 244% at YE2013.

    While Abe is doing all he can to trash the yen, events around the world are conspiring against him.  All those yen he created flooded into other economies, which are now rolling over (Thailand, Singapore, Philippines, etc.)  As risks elsewhere rise, that hot money flows back into the yen — now a safe haven.yen

    The afore-mentioned euro weakness will add to the challenge — as will the Chinese recent decision to join the beggar-thy-neighbor game.  Remember, China and Japan are each other’s biggest trading partners.  As the Renminbi slumps, it will also pressure the yen higher.

    Stay tuned…


  • Charts I’m Watching: Feb 25, 2014

    USDJPY backing off the .382 Fib…  Will this falling channel hold?

    The THBJPY is approaching another important test.  If the channel doesn’t hold, the downside is considerable.

  • Charts I’m Watching: Feb 24, 2014

    The last time SPX made a new high (1850.84 on Jan 15) it promptly dropped 113 points (6.1%.)  Is there reason to believe the new highs will stick this time?

    Let’s start with the carry trade on USDJPY — which has retraced barely 38% of its drop from its EOY highs.  Remember, 105.43 represented a .618 retrace of the 2007-2012 plunge and the .618 retrace of the 1996-1998 gains and a TL from the 1998, 2002 and 2007 highs.  This was a very significant top.

    The carry trade has been in place since mid 2012, providing very strong correlations between SPX and USDJPY.

    Why the decoupling since the 2013 year-end highs?  And, which will revert to the other’s trend?

    Likewise, the 10-year note stalled at the .382, a serious decoupling vs the SPX.

    And, it’s having trouble climbing back above the TL connecting the June 2007, April 2010 and Feb 2011 TNX highs.

    Speaking of decoupling, how about the DJIA and SPX?   The Dow, which is approaching a .786 retrace of its EOY highs at 16,315 and the Butterfly Pattern target of 16,300, is well off the pace set by SPX.

    more later…

  • Charts I’m Watching: Feb 21, 2014

    USDJPY got the usual overnight ramp…

    …which produced a somewhat muted response in ES (so far.)

    We’ll know soon enough whether or not equities are due for a new high.  But, remember, every major index that I follow has reached an important Fib level (Bat, Butterfly, Crab Patterns) retracement of their 2007 highs.  And, many have reached an important Fib level retracement off their late Dec highs — as well as an important trend line off their 2011 and/or 2012 highs.

    Lots of choices in terms of downside Fib levels — both within the rising purple channel and beyond.

    Given that today is OPEX, we might not see any movement until Sunday/Monday.  Coming up, my favorites.

    Quick aside, is Meg Whitman’s head really that large?

    Maybe a psychosomatic reaction to repeating the mantra that the PC business is going just great…

    source: macrumors.com

    continued for members(more…)

  • Charts I’m Watching: Feb 20, 2014

    USDJPY provided the stick save overnight yet again, with the small flag pattern holding thus far.

    For equities, we’re at a crossroads of sorts.  The bulls are working very hard, and propping up markets everywhere to cast recent moves as signs of higher prices to come.  While, the harmonics argue otherwise.  Who’s right?

    continued for members(more…)

  • Charts I’m Watching: Feb 19, 2014

    A little movement this morning with the intensifying trouble in Ukraine and dreadful housing numbers here in the US.  Yesterday’s USDJPY ramp has largely vaporized.  Still, it changed the trajectory of the pair somewhat.

    The e-minis, which already left the acceleration channel with yesterday’s water treading, appear to be rolling over.  A break below 1830 would be a good start.  But, let’s not discount the obvious intent to prop this sucker up.  And, that’s where the headline news comes in.

    I often think of markets like elections.  The hardcore bulls and bears probably won’t be swayed.  It’s the folks in the middle who decide which way it goes.  If the headlines out of Ukraine, Thailand, China, Fed Minutes, etc. are bad enough, the selling pressure can become too intense for TPTB (and, for those opportunistic players who’d rather make more money than toe the “markets are fabulously healthy” line.)

    Otherwise, the bulls will top the Dec highs (on SPX and COMP anyway), as the Fed minutes are unlikely to provide the bears much useful ammunition.  The market, it seems, is more than willing to ignore the impact of the taper — or, to believe that it will vaporize at the first sign of trouble.

    UPDATE:  3:50 PM

    Dow’s off 75, SPX off 12…  Even the hint of rising interest rates is enough to spook the markets.  More importantly, the issues in Ukraine has refocused attention on EM.  The IMF is calling EM a crisis…

    Just took a fresh look at the transports…  Immediate support at 696.50 (an 8.25% decline from the top.)  If that doesn’t hold, no support until 639.87 — a 15% decline (equivalent of 1573 on SPX…the 2007 high.)

    Next test for ES should be 1800-1807.

  • Charts I’m Watching: Feb 18, 2013

    No real change from last Friday.  The holiday weekend ramp job hasn’t developed into anything yet, thanks to a dismal Empire State Manufacturing Survey.

    The USDJPY is helping to boost stocks, but is in danger of fading back into the falling purple channel.  Though SPX has retraced .886 of its 2014 losses, the USDJPY itself has barely topped .382.

  • Charts I’m Watching: Feb 14, 2014

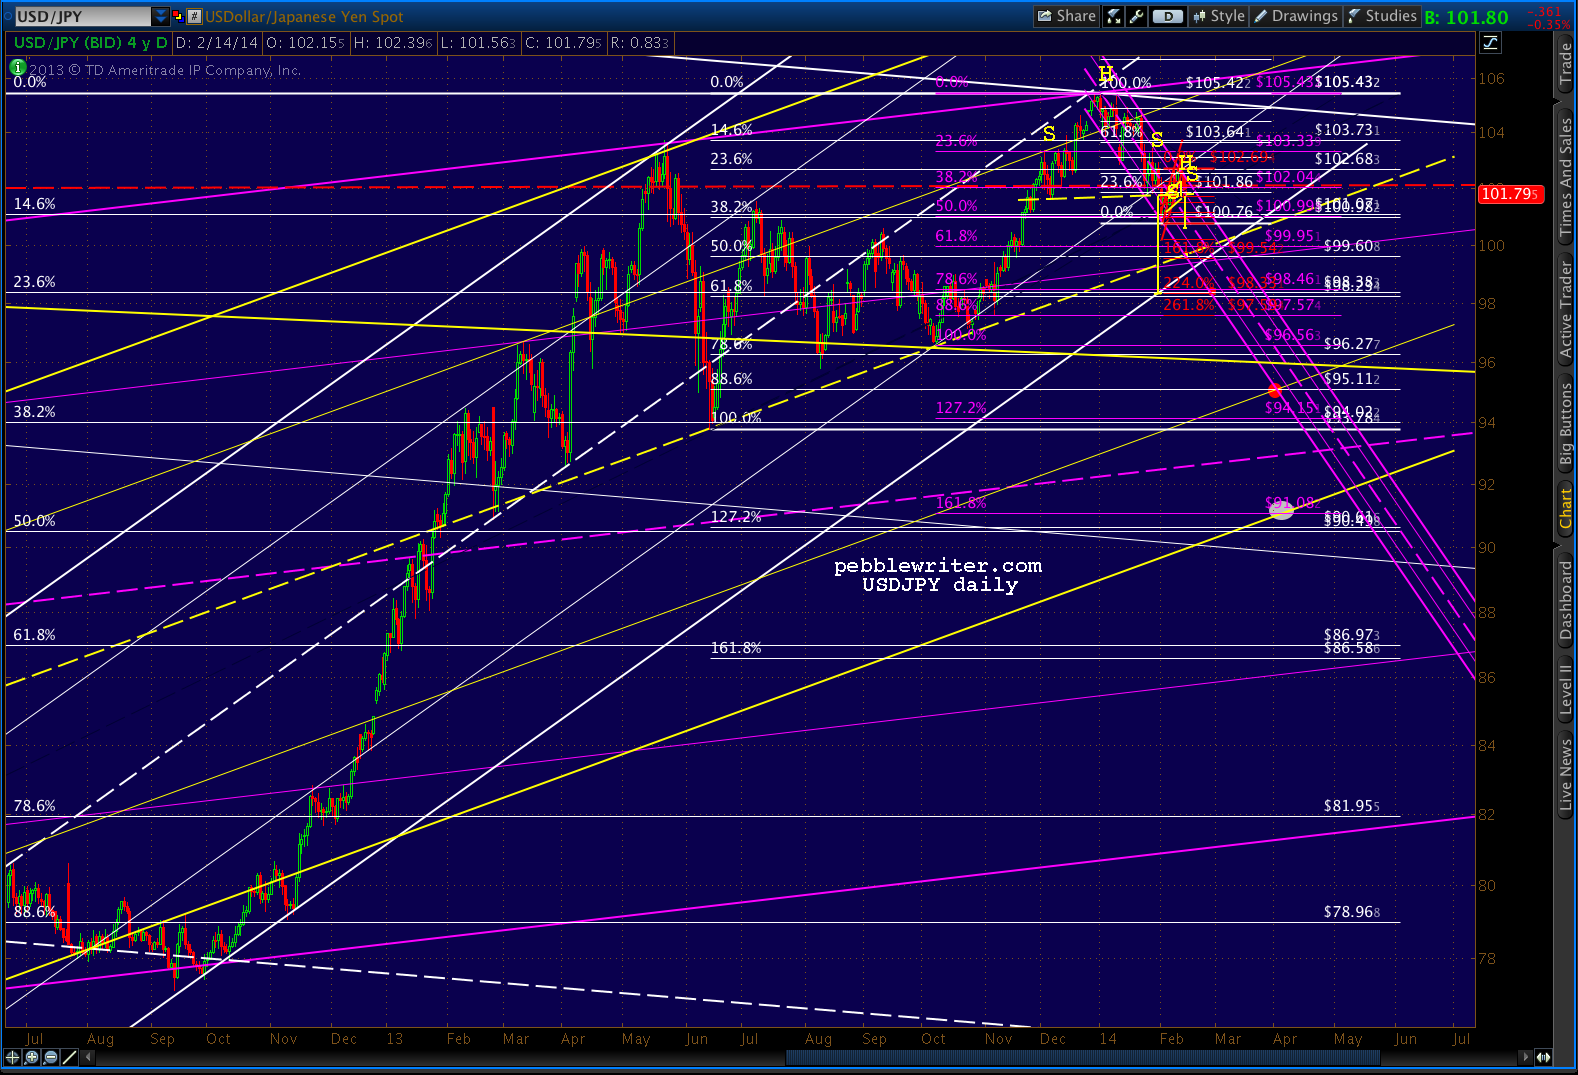
    The USDJPY completed another H&S Pattern — that hasn’t yet played out.

    A reminder of the bigger picture.  The yellow channel midline remains the next big test.

    Though the yellow channel is a sloppy turd of a channel, the midline has held repeatedly throughout Abe’s magic carpet ride.  The rising white channel — somewhat better defined — intersects with the yellow midline in late Feb/early Mar.  We’ve backtested the .236 line, so the bottom is the next support and should arrive sooner than later.

    If the pair pushes down through the yellow midline or white bottom, things get interesting real fast — with the purple midline down around 93-94 and a bunch of Fib lines gathered around the yellow channel bottom at 91ish.

    The falling Nikkei has obviously helped strengthen the yen.

    Support is coming in the form of the purple and yellow midlines.

    But, again, if those don’t hold — or if we merely get a bounce there — the downside is considerable.

    UPDATE:  1:26 PM

    ES just completed a Bat Pattern at its .886 (1833.50.) SPX should do the same shortly (1837.97.)

    DJIA finally tagged its .618… 16,158 should be about it.

    The big picture is compelling…beautiful symmetry around 10,000 in late August — about a 40% drop from the top. The intersection of the purple channel midline, the grey channel midline, the red channel bottom and about a 61.8% retrace of the 2009-2014 rise at a psychologically important number.

    But, TPTB would never allow it, right?  That would be nearly a 40% drop from the top — comparable to Sep 08-Mar 09 (but, perfectly in keeping with our USDJPY model.)  Unthinkable.

    How about 13,317 (-19%.7%) in the same time frame?  Say, at the intersection of the yellow .886, red channel midline, purple channel .786 line, and grey channel .786 line.  A pullback to the .886 is very commonplace for completed Butterfly Patterns.

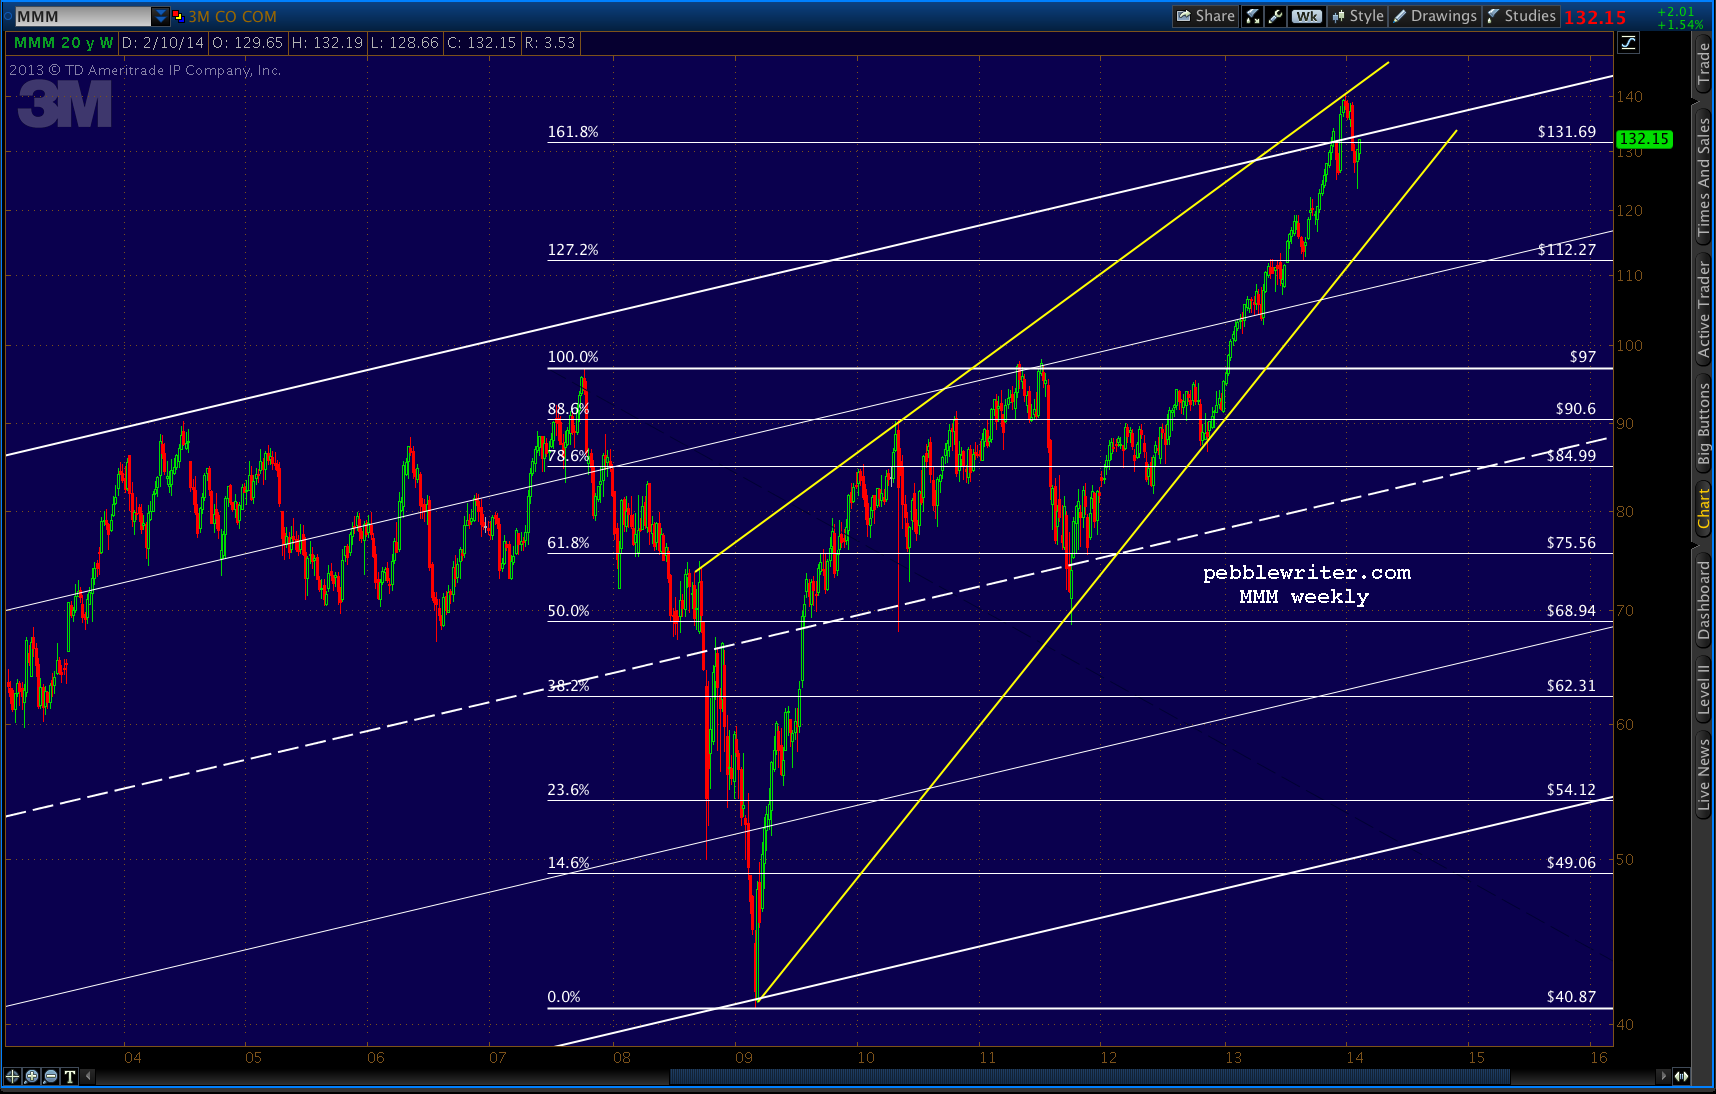
    Even a boring old company like MMM (a great proxy for the broad markets) looks like it’s corrected its year-end excesses and is ready to return to earth.

    Will the market fall apart Monday?  Will Tom DeMark’s 1929 play out?  I have no idea, but the charts are certainly quite negative, and complacency (along with margin debt) is very high.  The risk of something ugly happening is very, very real.

    Oh, yeah.  Happy Valentine’s Day.