

Month: February 2014

  • Charts I’m Watching: Feb 13, 2014

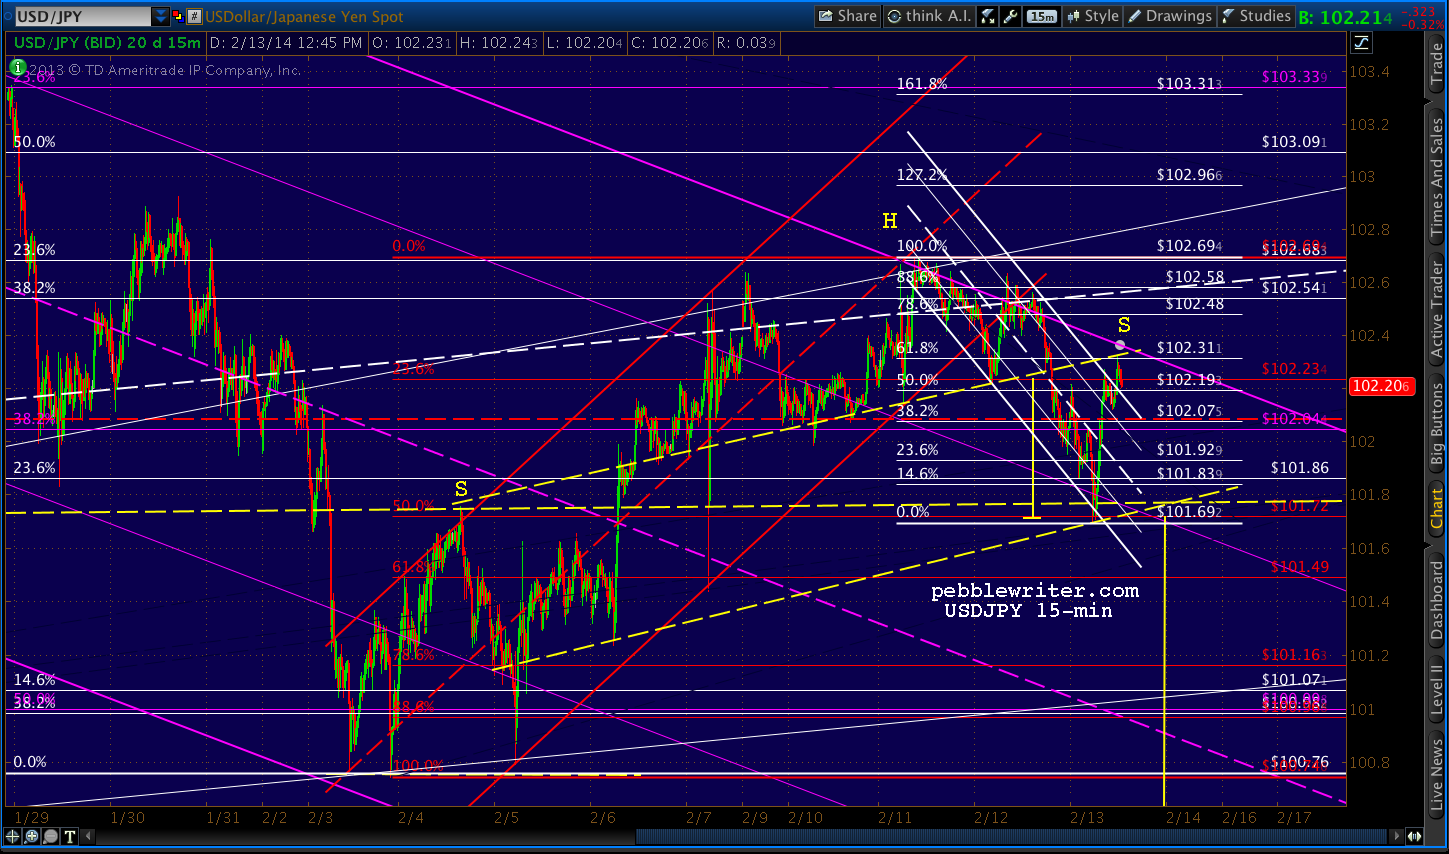
    USDJPY is on the move, back below the long-term TL at 102.  There should be some support at the previous low of 100.76, but the yellow channel midline is the next major test — probably today or tomorrow.

    The e-minis have been stingy in giving back gains — with, so far, just half of USDJPY’s  .500 retrace of the run up between Feb 5-11.  Most important is the broken white rising channel line.  Potential support at 1801, 1793 and 1787 with major support at 1775-1777.

    Still, this was a .786 retrace of the move down from 1846 to 1732 and, as such, might be complete.  Our thesis remains that EM weakness will drive yen strength relative to the dollar and dollar strength relative to the euro — a combination that, in the past, has produced some stellar shorting opportunities.

    It’s also worth noting that the 1929 analog discovered by DeMark and popularized by McClellan is supposed to be playing out today.  From Spindrift Capital’s January investor letter:

    From the Sep 3, 1929 top, the Dow declined for 25 sessions, then retraced 58% of its losses by session #30.  The bottom then fell out, and it lost 50% of its initial value by November 13.

    By comparison, the modern-day Dow declined for 24 sessions following the Dec 31, 2013 high (25 if not for the MLK holiday.)  As of today – the 29/30th day – it has retraced 56% of its losses.  A 50% decline from its recent highs would land the modern Dow at 8,294 – erasing about 80% of its gains since 2009.

    However, the analog doesn’t suggest an apples-to-apples comparison.  The 1920’s runup was much steeper than we’ve recently experienced.  The Dow quintupled, averaging 25.2% between 1921 and 1929.  That initial 25-day drop was 18%.  Since 2009, the modern Dow averaged a measley 20.6%.  And, the drop since the recent top has been only 7.5%.  So, both the price and timing are off at least a little.

    In case you’re wondering, the 1929 Dow survived its 9-week 50% decline, retracing about 50% of it over the next five months – before really getting started.  By the time it finally bottomed in July 1932, it had shed about 90% of its value.  It took 25 years for prices to return to their 1929 highs.

    While the 1929 analog is interesting, I’m partial to the period of 1963-1978 as a guide to the next year or two.

    UPDATE:  2:45 PM

    USDJPY bounced off a potential neckline and is approaching the .618 of the last little leg down as it backtests the neckline of this morning’s H&S pattern.

    The key remains the red, dashed TL — which is once again below the pair.  Interestingly, DJIA is getting enough of a boost that it’s approaching the exact retracement exhibited in the Sep 1929 analog: 58.38%, or 16,069.

    Note its more docile behavior relative to the irrationally exuberant SPX, which seems intent on reaching its .886 at 1837.

    Even high-flying AAPL has only recouped 61.8% of its losses from 575 — backtesting the broken neckline and running into a TL from the top in the process.  Next downside target: 460-475, followed by 408 in May if the rising white channel breaks down.

    UPDATE:  3:50 PM

    BTW,  financials have only retraced about .618 of their losses since reaching our .500/.886 Fib combo target.

    In short, SPX is going it alone based on the USDJPY bounce that — after all is said and done — is merely creating another H&S Pattern.
  • Charts I’m Watching: Feb 12, 2014

    USDJPY has backtested the broken .236 channel line.  It has recovered  about .382 of its 12/31 high…

    …while SPX (1826) and ES (1822) are coming up on their .786’s.

    Unlike the Dow, which is having trouble punching through the .500.

    EURUSD is showing weakness this morning.  If the 1.355 level doesn’t hold, it’s a long way to the other side of the channel to 1.29.

    Update:  3:30 PM

    Trouble in store for the Nikkei.  Remember, it just tagged the top of a channel dating back to 1991.

    In this close-up, we see that the 2013 leg up recently broke down.  Now, that rising channel has been back-tested and is ready for a reversal.

    Just in time to contribute to the USDJPY plunge to below 100 — looks like it could be any time now.

  • Charts I’m Watching: Feb 11, 2014

    ES reached our .618 target overnight…

    While, the USDJPY is merely treading water.

    Yellen’s testimony is due out at 8:30ET.

    UPDATE:  3:50 PM

    USDJPY has reached a potential channel top — though 102.85 or 103.12 intraday would also make sense.  I like the idea of a fifth wave down here.

    SPX has come within a few points of the .786 and has tagged the .786 from below.

  • Charts I’m Watching: Feb 10, 2014

    Do ya’ suppose the TL we’ve been watching on USDJPY is important?  Someone’s sure supporting it…

    EURUSD has probably reached an interim (at least) reversal spot.  The purple .618 at 1.3733 would be more persuasive, as it intersects with the multi-year channel top.

    The little ES channel — which neatly contains last Friday’s 30-second correction — needs at least a fleshing out.  A .786 corrective wave would take prices back to the falling white midline at 1745.  The near-term objective remains the .618 at 1803.

  • Charts I’m Watching: Feb 7, 2014

    The craptastic NFP report undid the overnight ramp — for all of two minutes.  The futures bounced strongly and are trying to find some equilibrium.  The USDJPY, back above the red TL for now, continues to drive equity prices.  Very reminiscent of the taper pop — with the PPT’s hand clearly caught in frame…

    Even the talking heads can’t explain the melt-up — just like back on Dec 18 — because the honest explanation would be bad for business: the market’s going up because TPTB need it to go up in the face of really bad news.  They are buying everything in sight in order to ramp it right on through into the close and, ideally, scare the bears into capitulation.

    continued for members… (more…)

  • What Currencies are Saying about Equities

    This seems like a breakout, but is probably just a backtest of the all-important and recently broken red dashed TL on the USDJPY (note also the channel midline coming into play.)  If so, this rally should be faded.

    The TL’s impact be seen quite clearly on the long-term USDJPY vs SPX chart.

    Backtests have led to rallies, but those rallies have failed when the backtest completed and the pair continued falling — as it should this time.

    The yen is falling because the euro is strengthening.  Why?  The ECB didn’t further crush the common currency as widely expected.  These days, a falling yen equates to stocks rallying.  If the euro continues to rally, stocks should follow.  But, it don’t believe it will.

    Look at the long-term EURUSD chart.  Remember, dollar strength drives the the pair lower; euro strength drives it higher.  The yellow channel is the most dominant over the past 20 years, but the falling white channel is currently guiding the euro lower.  The pair just tagged the top of the channel on Dec 27 — the same day USDJPY topped out.

    The pair had dropped through the yellow midline and the white midline in early 2012, but rallied back above both after QE3 was introduced.  On Dec 27, it reached the .618 retracement of the last big drop (from the last time it tagged the channel top) as well as the white channel top itself.

    In so doing, it also backtested the yellow channel .618 line (a fourth time) and the .382 Fib of the rise from 1.18 to 1.49.   Close-up, it appears to have a chance at rising further, but should at least flesh out the purple channel bottom first — likely the red .618 at 1.3406.

    Regardless, the path ahead is not rosy for the euro.  As tough as things are elsewhere, the EU economy and banking system is still on very shake ground.  A stronger euro would decimate the exporting countries which are the worst off.  The ECB will ease, and the EURUSD will tumble.

    Japan, which has done all the easing they possibly can (to no avail) is probably done — which leaves the yen as the strongest (technically speaking) and the euro the weakest — with the USD representing the middle ground with a QE iron still in the fire.

    Keep an eye on the USDJPY, which in addition to the red trend line is coming up on the .618 of the last major drop (from 102.92 to 100.74.)  If its rally fails here, SPX — which is also approaching a .618 at 1772.37 — should also fall back in line.

    UPDATE:  3:00 PM

    Both USDJPY and SPX have reached the .618’s discussed earlier.  Do or die time for the rally…


  • Charts I’m Watching: Feb 5, 2014

    USDJPY completed a little Bat Pattern…

    …but, this was the backtest of a broken channel bottom.  There’s plenty more downside, with the immediate objective the yellow midline.

    It might provide a good bounce spot, as it has several times in the past year.  Look for it to line up with an SPX bounce such as the Sep 19 high (1729.86) or the purple channel bottom/yellow .618 combo.

    At 1724, the S&P 500 will have dropped 6.8% from its high — a breather not unlike the others of the past 16 months.  If the purple channel should fail, however, things get real ugly real fast.  I think it will — as the USDJPY chart that confirmed Dec 31 as an important top is still very much in play.

    The e-minis narrowly escaped one H&S Pattern, but are threatening to form another which targets 1714ish.


  • Ramping

    The usual overnight low-volume ramp job — this one into a flag pattern that got ES back to the falling red channel midline and backtested the broken white 1.618 Fib.

    So, last Friday, I’m channel surfing and hear an unbelievable rant from everyone’s favorite cheerleader Jim Cramer:

    You know what? I’m getting pretty darned tired of the tyranny of the S&P futures, where the market gets hammered from the get-go for no particular reason. And people panic simply because they figure those futures traders must know something.

    He goes on to exhort his followers to ignore the futures action and buy the dip because Monday (yesterday) would be up big…but, that’s another story.

    The part that flabbergasted me was the notion that low-volume overnight futures trading was somehow unfairly depressing the markets.  This was the same day another CNBC  bobble-head (Pisani) was going on about how investors should ignore the ugliness in the DJIA since it was more sensitive to disappointing earnings reports than was the SPX (we wouldn’t want earnings to affect stock prices, would we?)

    So, I was excited to tune in this morning and hear him rant about the futures action unfairly propping up prices overnight…except it didn’t happen.  In fact, it never happens.  In all the years I have suffered through MSM coverage of the stock market, I don’t think I’ve ever heard anyone talk about the nightly ramp job that has become a staple of the market.

    In the past week alone, the futures have ramped higher 5 out of 7 times.  It’s almost a certainty after a big decline during market hours, as last night’s action demonstrates.

    Here’s the previous week’s.  Note the pattern from last weekend, which is practically a template for last night.

    Lest anyone believe that even two weeks doesn’t a pattern make, here’s the past month of ramp jobs — many featuring the exact same slope.  I wonder if Cramer will put this chart on Mad Money.

    A reminder to our readers: CNBC and its ilk exist simply to display ads paid for by you when you patronize the firms whose continued existence relies on an ever-increasing market.  When the market goes up, it’s proof that all is well in the economy.  When the market goes down, it’s just the market taking a breather after rising so much, so fast.  Or, so they say.

    More later.

  • Charts I’m Watching: Feb 3, 2014

    The falling purple channel in USDJPY has broken, and the third H&S Pattern has completed as expected.  In other words, the yen’s appreciation has accelerated — a definite negative for stocks.

    Yet, ES has reached the bottom of one rising purple channel.  So, the market is clearly at a crossroads.  The problem for bulls is that the rising purple channel is the most bullish scenario.  There’s a more bearish option that argues the bounce isn’t yet here.  Note the white channel has plenty of downside to go.  The bottom is currently around 1724.

    And, if neither channel holds, there’s always the larger channel that has guided prices from the 2009 lows; the bottom is currently around 1670.  And, lest anyone forget, the recent top was a very large Butterfly Pattern completion.  A mild reaction would be back to the prior top: in this case, 1546.75 on ES.

    A common reaction would be to the .886 (1441) or .786 (1350) — which would fit nicely with the attractive alternative to the big rising white channel.  And, for the uber-bears, how about the .618 at 1194?  Would the Fed permit it?  Probably not.  But, unlikely as it is, if the Fed somehow took a hands off approach to the markets, it’s the best looking outcome on the charts.

    Coming up, targets.

    continued for members(more…)