Month: September 2013

  • Friday the 13th

    ORIGINAL POST 2:20 AM

    ES just reached the .618 Fib retracement (of the 1705-1624 drop) at the bottom of the red channel.  I’ll go long here at 1676 on the assumption that the channel and Fib will hold.  Stops at 1666ish.

    UPDATE:  7:30 AM

    Rising red channel or purple?  We’ll know soon enough by whether ES can climb back above 1680.48.

    The canary in the coal mine, the USDJPY, is back above the yellow midline and white channel top (for now) which is bullish for US equities.

    The red IH&S neckline held its recent test, and we have two higher highs and higher lows so far.  I’d be more confident in the pair’s upside if it could break through the purple midline.  But, the yellow channel could tack on quite a few percent without its help.

    More later.

    UPDATE:  10:29 AM

    Getting a little sell off following the crummy consumer sentiment numbers.  Retraced .886 of the rise from 1674 to 1682, should hold here — stops at 1673ish.

    Re SPX, as long as 1681.96 holds, next stop should be 1692.08 — the .786 retrace of the drop from 1709 and the 1.272 of a well-formed Butterfly Pattern set up since yesterday.

    UPDATE:  3:15 PM

    I have to run out for an appointment.  I wouldn’t hold long over the weekend, but I would definitely hold long on any move through ES 1682.25 with an intial target of ES 1684 and ultimately 1686.  I would short on any weakness upon reaching those targets, but I suspect it will occur in the last few minutes of the session, so the more practical approach is to go directly to cash.

    More later.

  • Charts I’m Watching: Sep 12, 2013

    Initial claims plunged to the lowest level since 2006, but there are questions about the accuracy of the numbers.  In any case, it sure doesn’t hurt the prospects for a taper this month.

    The USDJPY has fallen back below the “breakout” point — the top of the white channel — after slightly exceeding the latest .786 and the purple channel midline.

    It appears to be backtesting the yellow channel midline, so we should see more weakness to back below 99 — perhaps 98.66 or lower.

    DX has fallen significantly in the past few days, testing the white channel midline and putting in a potential bottom in search of a Bat Pattern Point C.

    It dipped as low as 81.595 overnight, very close to the .618 (81.535) retracement of the gains from 80.77.

    ES poked up slightly higher in the after hours yesterday, but has since settled back down to its .786 and is still butting up against resistance at the red channel midline.

    UPDATE:  10:00 AM

    SPX is still reaching for its .786 after having closed the last remaining higher gap yesterday.  Its sweet spot could be up at 1695.  The purple 1.618 intersects there with the top of the falling red channel and the former H&S neckline (purple, dashed.)

    Note: another 8 points higher for SPX would mean ES tagging its .886 at 1695.85.  In either case, I see a possible drop here to flesh out the red channel bottom as we have a series of lower highs and lower lows since yesterday’s highs.

    I think it’s prudent to remain short, reconsidering if ES exceeds 1690.50.  ES target is 1679.20.

    UPDATE:  10:10 AM

    The EURUSD has reversed off its .618 at 1.33 at a channel top.

    However, the light blue channel line it tagged overnight is a potentially bullish support level.  It belongs to a channel dating back to Jul 2012, though this channel is notorious for its frequent excesses in both directions.

    UPDATE: 11:45 AM

  • Remembering

    This day means something different to each of us.  For many, it’s a touchstone: a reminder not to take life for granted, to make thoughtful choices.  Wishing all of you a thoughtful day…

    Don’t judge each day by the harvest you reap, but by the seeds that you plant.
    Robert Louis Stevenson

    *  *  *  *  *

    The USDJPY has backed off the .786 Fib line (white) and the purple channel midline and appears set to backtest the broken white channel top.

    DX bounced nicely off the rising white channel bottom on Monday, backtesting the falling white channel midline in the process.  It’s due for its rally to resume, but hasn’t yet made up its mind.

    And, ES has slipped below its red channel midline and backed off yesterday’s highs in the process.

    I’ll explore a short position here at 1681 and see if we can put together a few points to the downside to flesh out the red channel — the bottom of which is currently around 1667.  Stops around 1683.25.

    The 4-hr chart, as it often does, puts things into perspective a little better.

    continued for members(more…)

  • Charts I’m Watching: Sep 10, 2013

    We went long at 1669 yesterday afternoon when ES broke out of both the rising white channel (from the 1624.75 bottom) and the  falling white channel (from the 1705 high.)

    This morning, it also broke out of the rising wedge (red, below) and is closing in on the .786 retracement of the drop from 1705 to 1624.75.

    This move greatly increases the odds of the bullish scenario we discussed yesterday playing out:

    A strong reversal there (the white .618 at 1674.34) would set up a Gartley to the .786, but at this point the better candidate is a Bat Pattern up at the .886 (ES 1695.85, SPX 1700.)

    ES shot right through the .618, so the Bat Pattern to 1695.85 jumps to front and center.  Note that the purple 1.618 at 1693.92, lending credence to that price target.

    As always, a garden variety .786 Wave 2 is still on the table.  So, be cautious around 1687-1688.  A reversal at 1687.31 would set up juicy downside scenario, so bears could dig their heels in at that point.

    UPDATE:  8:30 AM

    Here’s the chart cleaned up a little.  I’ve sketched in a rising red channel that’s parallel to the two prior acceleration channels (1530-1685 and 1553-1695) just for grins.

    Those prior channels were insanely steep — producing 155-pt and 142-pt gains in about a month each.  It’s nice to have a frame of reference.

    Are bulls completely out of the woods?  Hardly.  That state of bliss is reserved for new highs and budget compromises.

    In fact, the last time ES pulled a rally out of a bear’s mouth (from 1596-1649 on Jun 6 and again on Jun 13 — the rally so nice, they did it twice) the market plunged 96 points in 4 days.

    Stay tuned.

    UPDATE:  9:20 AM

    Inside day for DX so far, still working on backtesting the falling purple channel top and falling white channel midline.

    And, USDJPY — while clearly breaking out of its falling white channel — is still having a tough time breaking back above the purple midline or back into the rising white channel.  The fact that it’s still backtesting both suggests that reaching the .786 (tagged today) or the .886 will prompt a decent downturn.

    Speculating here, but USDJPY .886 tag at 100.87 coincident with ES .886 tag of 1695.85?

    The EURUSD, meanwhile, is still trying to join the party.

    UPDATE:  9:45 AM

    Assuming ES/SPX retrace .886 of their losses from 1705/1709…then, what?

    continued for members(more…)

  • Charts I’m Watching: Sep 9, 2013

    A reminder: as discussed Friday, our focus on equity prices is now on the E-minis (ES.)  The overnight action is too important to leave out of the equation, and playing the cash markets only leaves anyone holding a position overnight susceptible to big moves without the ability to hedge or stop losses.

    Although the E-mini can easily be margined, I don’t recommend it.  Our focus on finding and exploiting turning points in equity markets works well most of the time, but occasionally I miss a call.  In an unleveraged portfolio, this could mean a

    *  *  *  *  *

    USDJPY has recouped some of its losses following the Bat Pattern completion Friday, but is still looking bearish.

    DX is back to Friday’s low, but is holding so far at the large falling white channel midline, the red neckline and the rising white channel .236.

    The E-minis are up 5 points this morning, but have yet to recover Friday’s losses.

    I’ll go long on any sustained move through 1660, but otherwise remain short.  Any such move higher is likely to run out of steam at the .786 of 1661.43 or .886 at 1662.63 — though the white channel top is drawn through 1664-1665 and could attract an intra-day push while still holding.

    A move through 1668, on the other hand, targets 1694 — the purple 1.618 — thanks to the substantial reversal (Point B) at the purple .886.

    The key levels on SPX are the tagged .886 at 1664.72 from Friday, and the Aug 26 high of 1669.51 (the white .500.)

    UPDATE:  7:00 AM

    Going short here at ES 1665 and SPX 1666.  The falling white channel tops have been tagged, and ES just finally tagged the white .500 Fib.  Neither has exceeded the Aug 26 highs — meaning the purple Bat Pattern held.

    SPX:

    continued for members(more…)

  • Charts I’m Watching: Sep 6, 2013

    The e-minis have reached the .886 retrace of the small drop from yesterday’s Gartley Pattern completion.  But, the pattern is more conducive to a Crab Pattern, which extends to the 1.618+ rather than a Bat Pattern due to the obvious Point B at the .707 (a Bat requires that it be <.618.)

    An extension to the 1.618 would put the larger pattern in the running for a Bat Pattern at its .886 of 1662.63.

    DX continues to show strength, having broken out of and now backtested the falling purple channel.

    The USDJPY has fallen back inside the white channel. It has been backtesting the purple channel midline for several days and has failed, so far, to punch through the psychologically important 100 level.

    Next move should be to backtest (at least) the red IH&S neckline at 98.53.

    NFP coming up…

    UPDATE:  8:33 AM

    Crappy numbers: 169,000 vs 180,000 estimates.  However, the participation rate dropped to 68.3% — the lowest since 1978 — so, unemployment dropped from 7.4 to 7.3%.  This top line number should give the Fed additional cover to begin tapering this month if they so choose.

    The e-minis took the opportunity to bag that .886/1662.63 Fib level, so the market should start backing off from here.

    The dollar briefly sold off, only to get a strong bounce off the purple channel again — another back test.

    The 10-yr, which reached our target range from several months ago yesterday, backed off slightly on the news.  It still has the potential to tag the .618/1.618 combo at 3.013-30.17, but for all intents and purposes, it should be close to an interim high here.

    If the futures can hold their gains for another 30 minutes, look for SPX to pop to the grey 1.618 at 1662.44 or the purple .886 at 1664.72 on the opening.  It shouldn’t last, but I can’t discount the possibility that SPX will tag the top of the white channel (the .500 at 1668.42?) before turning south.

    If so, it would set up the dip from 1669.51 as the head in a good-sized IH&S Pattern targeting the 1709 highs after a drop Monday to 1643 — the large purple channel bottom — to establish a right shoulder.

    If so, that channel top tag could come late in the day.  I’d be long on the opening and ride the rally as far as it’ll go.

    While I’m thinking about it… I’ve been battling the disadvantages of the S&P 500 index as a forecasting tool since I started the predecessor to this blog back on May 2, 2011.

    It works fine during the trading day, but as any regular reader of this blog knows, too much happens overnight (ramp jobs) in the futures markets for SPX to work well 24/7. It’s the bane of every cash market investor who dares to hold a position overnight.

    For that reason, I will be focusing more on the eminis going forward — both in trading and in forecasting.  They are quite liquid, do a better job of following the chart patterns and harmonic patterns that I use, and offer the ability to set stops overnight that actually mean anything.

    They are a futures contract, to be sure.  And, investors can use them to greatly leverage an investment if they so choose.  But, as I’ve said many times on these pages, our strategy does not lend itself to using leverage.

    I’m always looking for turning points.  When we’re right, life is good.  When we’re wrong, we might take a 1/2 or 1% hit before being stopped out and switching sides — no big deal.  But, for an options or leveraged futures trader, being wrong regarding a turning point can wipe out your portfolio.  Don’t do it.

    I will use them on an unleveraged basis only in our new fund and in forecasting the markets in these pages, and would suggest the same to anyone who asks.  Beginning next week, look for daily charts and forecasts to focus more on ES.

    continued for members(more…)

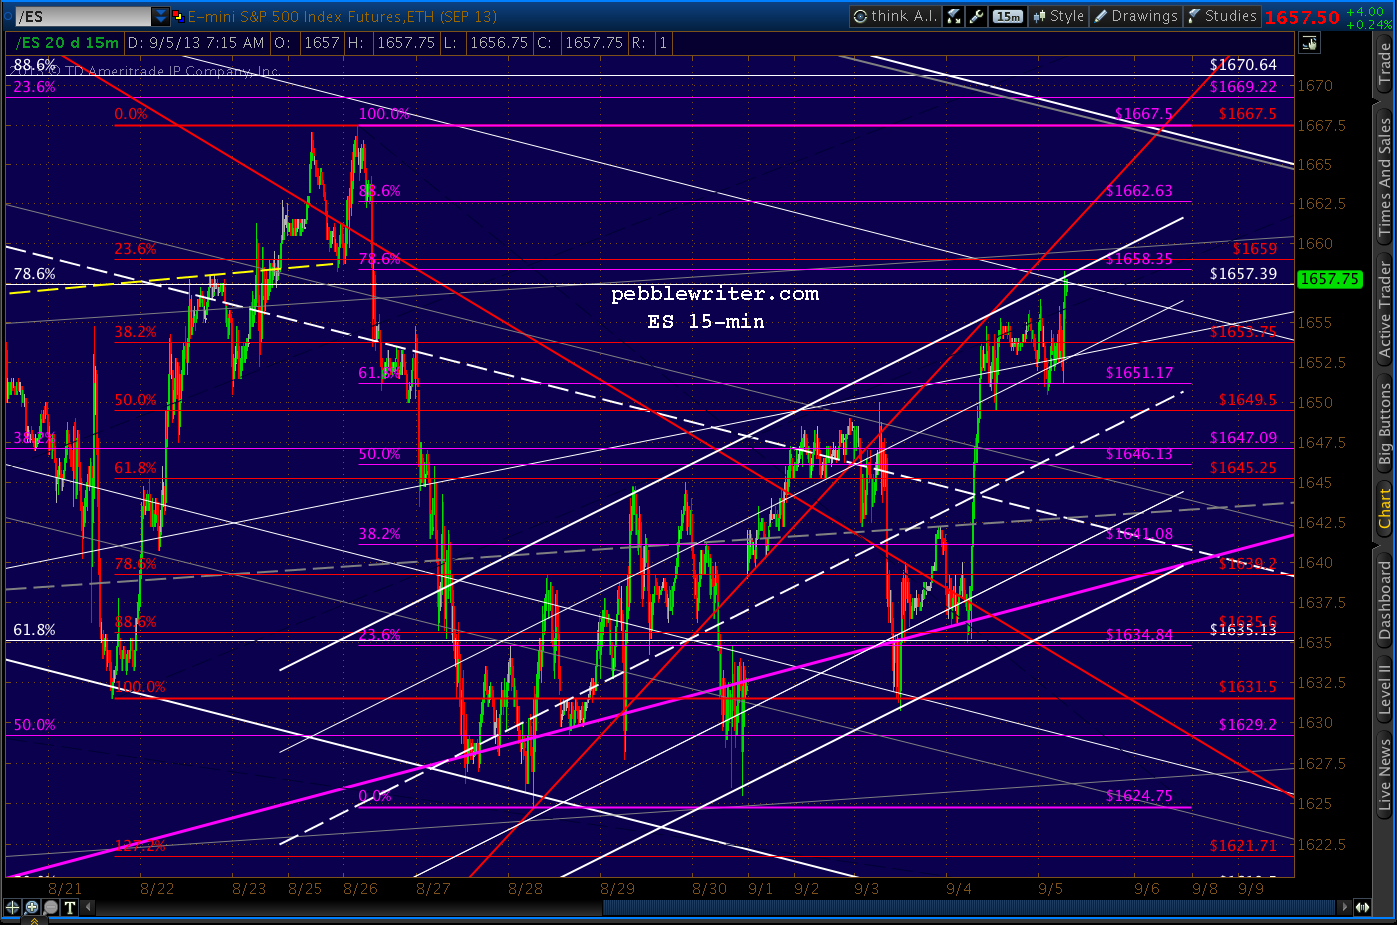
  • Charts I’m Watching: Sep 5, 2013

    Sep 5 is another of those days we pegged a while back as potentially “big.”  You wouldn’t know it from the markets’ overnight action.

    The USDJPY is still lurking at a key breakout or breakdown level.  Though it did finally tag the white .707 exactly — not to mention the purple .618 Fib and the rising purple channel’s midline.

    The EURUSD is still settling back after falling below the rising light blue channel .236 line and the falling white channel’s .786 line.  Draghi isn’t doing much to help the QE bandwagon with his fiscally conservative comments this morning (no more money for Greece?  Really, Mario?)

    And, the dollar continues to hold support after breaking out of the falling purple channel and above the red channel .146 line and white channel midline.

    We took a core short position yesterday afternoon, thinking it might play out overnight.  It didn’t, so odds are SPX will go up and tag the .786 at 1660.51 to complete a Gartley Pattern this morning (or at least close the gap at 1656.02.)

    I’ll play along on the long side from 1655, expecting to re-short at that point.

    If it gathers steam, the pair of .382’s is at 1658-1659, the grey 1.618 is at 1662.44, and the purple .886 is at 1664.72 — which is also where I show the intersection of several channels.

    UPDATE:  9:41 AM

    SPX just closed the gap and tagged the purple .707 and the potential neckline (red, dashed.)  I’ll hazard a short position here at 1657 if it doesn’t punch through.

    UPDATE:  9:47 AM

    There’s the white .382 Fib.  I’ll try shorting here at 1659.

    Now that SPX has pushed above the neckline of the potential IH&S Pattern, it needs to close above it in order for the pattern to be valid.

    That equates to roughly 1660.51 — the .786 — at today’s close.  The pattern target would be 1681 — just above the white .618 of the grid whose .382 SPX just tagged.

    It’s tough when SPX opens to know exactly which of multiple, tightly packed turning points it might select.  These are all close enough that, if I’m wrong, the damage will be minimal — even if we didn’t use stops (banish the thought!)

    But, we can look to other issues for confirmation.  The e-mini, for instance, just tagged its .786 for a well-formed Gartley Pattern at the top of a small but decent-looking channel while also tagging the .786 of a larger falling channel.

    Unlike SPX, it has definitely not completed an IH&S.  It could go on and complete the purple Bat Pattern up to 1662.63 and, thus, tag the top of the white channel before the next significant downturn.  But, that’s only 4 points away and could easily come after a test of the white midline down around 1640.

    With beats on factory orders and ISM services this morning, and NFP coming out in the morning, I’d not want to be on the wrong side of the taper trade overnight for the sake of 4 points.

    continued for members... (more…)

  • Charts I’m Watching: Sep 4, 2013

    DX has pulled back from the .500 retrace of the drop from 84.965 and a tag of the red channel .236 line and appears to have its sights set on a Bat Pattern — though it’s too early to say for sure.

    The red channel — while not exactly a thing of beauty — has simply continued to chug along.  But, as an indicator of equity prices, DX has been a schizophrenic indicator at best.

    The USDJPY, on the other hand, has journeyed as far as it can without breaking out or breaking down.  The red H&S Pattern in still in play, but so is a smaller IH&S Pattern.

    It reached our target price zone a day early — representing a backtest of the broken purple midline, a completed Bat Pattern (small purple grid), and a tag of the tops of the short yellow and grey channels — not to mention the 3rd backtest of the white channel from Jul 2012.

    At the very least, I would expect a pullback here — if only to the .618 at 98.35 to backtest the IH&S neckline.

    To be clear, few of these H&S Patterns have produced significant payoffs.  But, the necklines have proven to be good indicators of turning points.

    In contrast with DX, USDJPY has been a very good indicator of equity prices — as shown in the chart below.

    So, when its chart indicates a critical possible turning point — as it does now — we should pay attention.  Note the pennant/triangle tag at the purple channel midline.

    As to SPX, it has designs on completing a Bat up at 1664.72 or at least closing the gap at 1656.02, but has to do better than yesterday when the white channel .146 smacked it back down.

    I’ll play along on the upside here, but will watch for signs of weakness.  As the daily RSI chart shows, SPX faces its own moment of truth.

    UPDATE:  10:45 AM

    SPX is approaching the .886 (1649.30) of yesterday’s drop from 1651 to 1633, at which point it will have also reached the purple channel top and the same falling white channel .886 that stopped yesterday’s rally.  I’ll try a short position with any weakness here.

    I think 1649 is close enough.  Full short, with stops at 1651.36ish.

    UPDATE:  11:13 AM

    Got  very close to our stop, but seems to be backing off now — a pattern we saw with the Aug 30 lows.  Stay tuned.

    UPDATE:  11:40 AM

    Just stopped out on the short position, back to full long.  This price range is a little tricky, as the white midline still represents resistance, and the white .618 is just overhead at 1653.45.  Tight trailing stops make sense.  But, be aware that there may be some chop here.

    If SPX can punch through, 1660-1664 could arrive later today.

    UPDATE:  12:55 PM

    It doesn’t make a lot of sense from a harmonic standpoint, but it occurs to me that we could get a meaningul reversal here at the red .500 at 1654.47.

    Note how each of the previous declines going back to 11:15 ET on Aug 27 have come at key Fib levels on the red grid.  That particular one came at the .886.  The next came at the 1.000 (the smallest at 11 points), then at the .786, then the .618.

    If the pattern holds, we’ll see another here at the .500.  I say it doesn’t make much harmonic sense only because this rise is way out of character for a typical for a C-D leg of a Crab Pattern.  It’s still in the vicinity of a .618 retrace, however, so I’ll try a short position on any weakness here.

    If it doesn’t play out here, keep an eye on the red .382, which lines up with the white .382 at 1658.75 and the purple .786 at 1660.51.  I also show the neckline for the potential IH&S arriving any moment at the grey 1.272 at 1656.23.

    continued for members(more…)

  • Charts I’m Watching: Sep 3, 2013

    The futures again accomplished what the cash markets could not, ramping 15 points over the holiday weekend to present a mildly bullish view this morning.

    As we discussed Friday, there is a battle brewing between the harmonic picture — which still suggests lower prices — and the purple channel bottom.  So far, the purple channel is holding its own.

    But, this purple channel is subordinate to the white channel — which at present is being backtested.

    I’ll play along on the opening, but will watch for any signs of weakness.

    UPDATE:  9:33 AM

    SPX is approaching the .618 (1653.45) of the last leg down from 1669.51.  This should be the first test of the market’s ability to break out of consolidation.  Breaking through 1646 was a good start.

    UPDATE:  9:59 AM

    We’re getting a pause here, resistance from the small rising purple channel midline.  Look for a backtest of the red midline at 1645-1646.

    UPDATE:  10:20 AM

    SPX has almost reached the red midline.  If this is only a B of C corrective wave, then we should see one last spurt higher to the .618 (1653.45) or possibly 1656.02 to close the gap from Aug 26.

    UPDATE:  11:20 AM

    Taking an interim short position here at the red midline at 1645.  The next support level is the .618 retracement of the latest wave up at 1636.96.  It also marks the bottom of the purple channel.

    However, a retrace to the .786 at 1633.04 would set up a measured move to close the 1656.02 gap.

    A reminder, the downside case presented last week is still very much on the table.  If 1627.47 should fail, we should see a quick decline to 1620.84 and, potentially 1577.

    UPDATE:  1:08 PM

    Going long here at 1635.  Tight stops, as this could be just a backtest of the purple channel bottom at 1637.   If so, the .786 at 1633.04 or the .886 at 1630.71 are up next.

    UPDATE:  1:12 PM

    I think I jumped the gun.  Short again at 1637 with stops around 1638.

    UPDATE:  2:57 PM

    Still inching down, very close to the .786 at 1633.41. The RSI charts suggest a little lower still.

    UPDATE:  3:05 PM

    Stopped out at 1638, back to the long side.  I suppose we’ll get the usual late-day bounce here, but don’t see the immediate upside other than a lackluster bounce off the purple channel bottom.

    The bounce at the bottom of the red and white channels on the daily RSI confirms the purple channel bounce.  It even shows a little positive divergence.  But, there are longer term channels whose midlines — just above — should be even more influential.

    It was this 15-min RSI chart that had me expecting a tag at 1633 or 1630.  Now that its daily candle has been magically transformed into a more bullish omen, the futures will probably gap down to tag one of those levels overnight.

    In sum, I still see plenty of downside potential.  I’m just not willing to hold short overnight to capture it — not without a little more clarity.  There’s a good chance of rallying up to 1643-1645 for a Point C to establish a Butterfly Pattern that targets 1621.70 — in line with the red 1.618 at 1620.84.

    I’ll likely go to cash at the close.

    UPDATE:  3:47 PM

    Closing out the long position and going to cash here at 1639.