Month: July 2013

  • Update on AAPL: Jul 31, 2013

    It’s not often I get the chance to plug a future competitor.  As some of you know, my son Kyle is helping me out this summer.  He will graduate in December with an Economics major and Personal Financial Planning minor from Texas Tech University in lovely Lubbock, TX.

    In addition to performing many rather thankless duties for me, he has spent a fair amount of time learning the ropes of charting and technical analysis.  I asked him his opinion on AAPL the other day, and am pleased to present his analysis.  FWIW, I think he did a very nice job.

    It wasn’t the easiest of assignments.  Since our bottom call on April 19 [see: Is it Safe?], the stock quickly rallied to our upside target (a nice 20% gain), then promptly gave back almost all of those gains.  After all is said and done, he feels bullish about the rally continuing – a forecast with which I agree.

    I hope to lure Kyle back after he graduates for more of the same.  Though, he seems pretty excited about the financial planning field.  Those of you in the biz who would like to chat with this bright young lad about his career plans, feel free to drop me a line.

    *  *  *  *  *

    AAPL rose sharply following its earnings release last Tuesday.  EPS was $7.47 on revenue of $35.3 billion. Both numbers beat Wall Street estimates. Analysts had been expecting EPS of $7.34 on revenue of $35.18 billion.

    It shot up 25 points, breaking through the midline of both the rising purple channel and a large falling channel (in white below) from the 705 high.  It backtested the white channel midline, then shot up yesterday to complete a Bat Pattern (yellow) at the .886 of the drop from 465 on May 7.

    The completed Bat Pattern could pay off with a drop to backtest the white channel midline around 430-433 (the last Bat Pattern – from 469.95 on March 25 – fell much more sharply, retracing .886 of its rise.)

    Such a pullback could ultimately be bullish, as it could form the right shoulder of another IH&S (red) that targets 525 – only a few points away from the 1.618 extension (522.39) of the 469-385 drop beginning March 25. This target intersects with the top of the white channel around August 5-12.

    But, given that the recent low was slightly higher than the April lows, a large IH&S Pattern has already completed.  It could go ahead and play out now.

    The current rising purple channel doesn’t intersect with the top of the white channel until lat August/early September, about the time it passes through the latest Bat Pattern’s extension to the 1.618 at 513.26.

    Both of these bullish scenarios assume that AAPL is able to beat its former highs of 465 and 469.95.  Many potential harmonic patterns on the way down from 705 have been unable to.  In fact, each successive high has been lower than the last.

    But, for now, we’ll remain bullish with a target of 514 by late August and 570 before the end of the year.

    GLTA.

  • Fedspeak: Jul 31, 2013

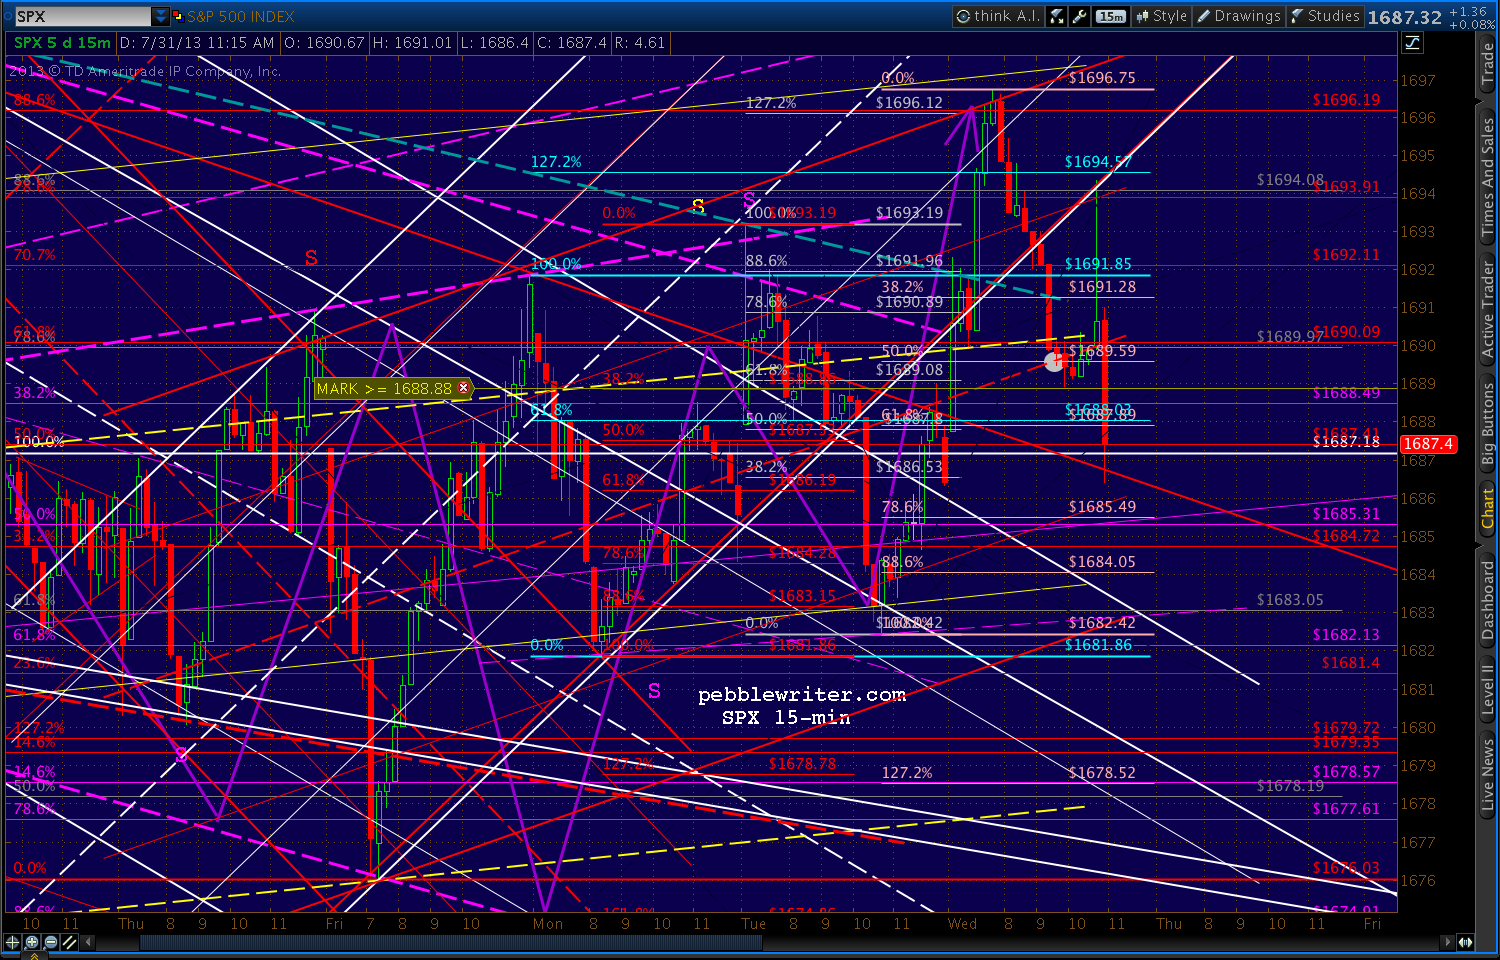
    Currencies are looking for some action, and so far it looks like dollar strengthening — not necessarily good for stocks.  I’ll start off short SPX today, preferably at 1690.89 or 1691.96.

    The EURUSD’s RW looks like it might be breaking down, though I’d rather the .886 had been tagged first.

    The dollar is hinting at a breakout, but that .886 would have been nice.

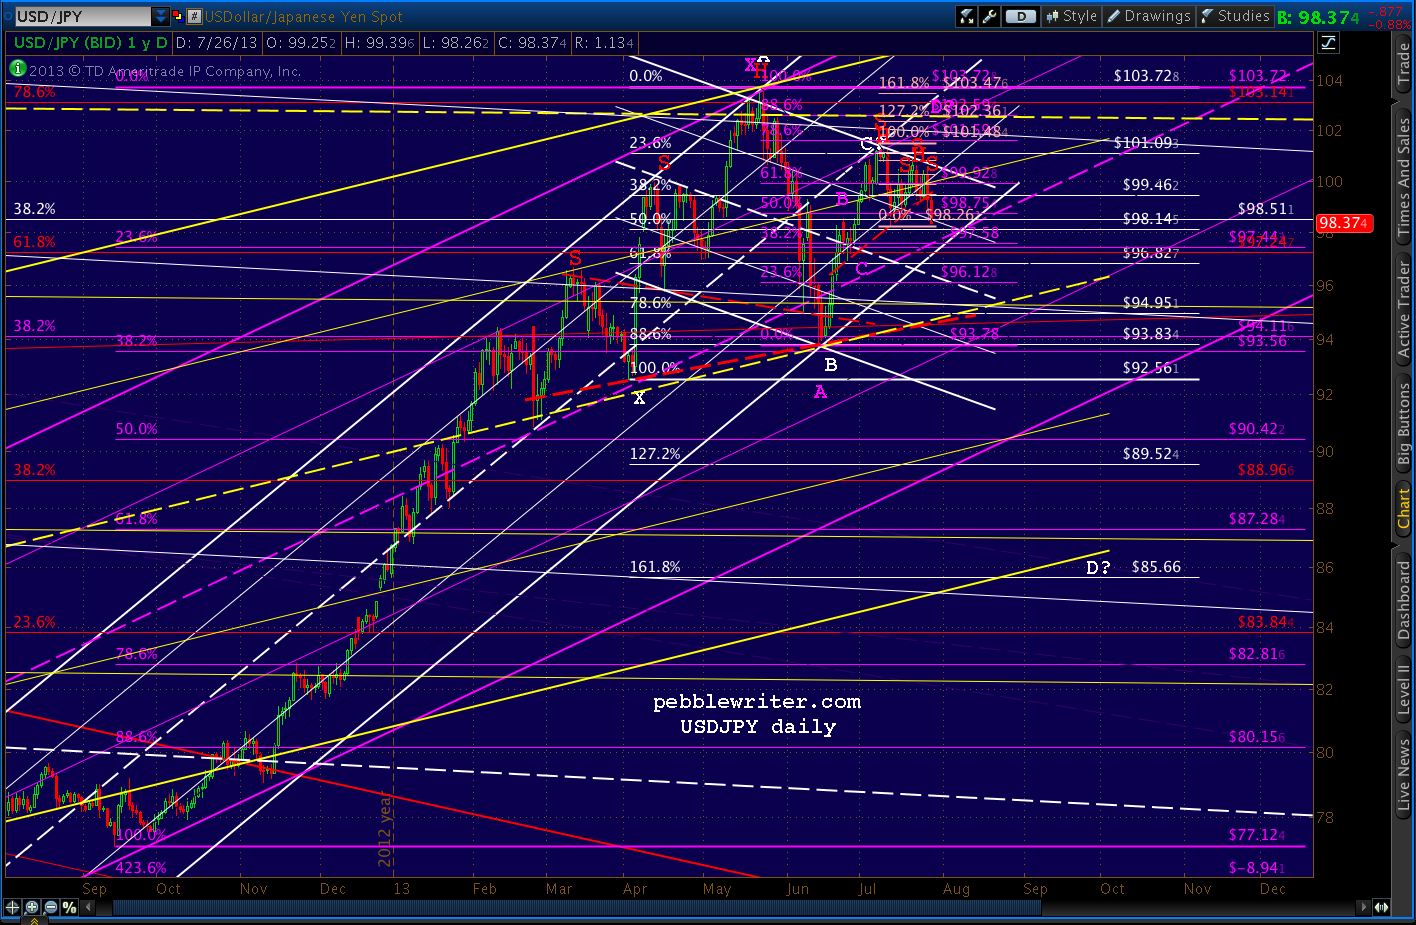
    And, the USDJPY is still looking very susceptible here, though it hasn’t yet broken through the purple midline.

    Given all this, we’ll pay close attention to our stops, as SPX might not yet be done.

    UPDATE:  9:31 AM

    SPX just tagged the latest .886 as we discussed yesterday.   Full short here at 1692.17, stops at 1693.20.

    ES tagged the top of its rising triangle on the 60 min chart, but the red channel remains busted for now.

    It could climb back in, so we’ll stay on our toes — particularly when the Fed comments are released.  If not, the purple channel charted below might be the red channel’s replacement.

    We got yet another rosy employment report (albeit from ADP), which adds fuel to the taper argument.  The GDP beat also gives cover to any stimulus reduction.

    Chicago PMI, though at 52.3 was a slight increase from last month’s 51.6, came up short of the 54.0 the Street expected.  New orders, employment and employment all fell, while prices paid increased.

    For those who missed it, ECRI put out a great piece on the longer-term trends in the US and other developed economies.  Check it out, along with the Lakshman Achuthan interview on Bloomberg.

    From ECRI:

    Notably, the U.S. and other major developed economies have experienced slower growth in the last five years (blue bars, front row) than Japan experienced in its lost decades (red bar).

    UPDATE:  10:26 AM

    SPX just pushed through the prior high and should go up to tag the larger pattern .786 at 1693.91 or the .886 at 1696.19.  I’ll take an interim long position here, but don’t expect too much from it.  Core short still in place, stops at 1693ish.

    UPDATE:  10:37 AM

    That should about do it for this move.  Closing the interim long here at 1696.25, back to full short. Stops at 1699ish, as we probably can’t get this close to 1700 without bagging it (probably a job for another interim long if/when…)  So, a double top within a double top?

    Next stop should be at least a backtest of the grey neckline around 1691.28.

    UPDATE:  12:45 PM

    SPX has followed through nicely, just reaching the .500 of the latest move up and the .618 of the drop from 1693 to 1682.  It’s also the midline of a small channel (red) that I think might provide the bulls with the opportunity to take a stand.

    I’ll take a long position here, but am more than happy to rejoin the short side if prices slip below 1689.

    *  *  *  *  *

    It’s not often I get the chance to plug a future competitor.  As some of you know, my son Kyle is helping me out this summer.  He will graduate in December with an Economics major and Personal Financial Planning minor from Texas Tech University in lovely Lubbock, TX.

    In addition to performing many rather thankless duties for me, he has spent a fair amount of time learning the ropes of charting and technical analysis.  I asked him his opinion on AAPL the other day, and am pleased to present his analysis.  FWIW, I think he did a very nice job.

    I hope to lure him back after he graduates for more of the same.  Though, he seems pretty excited about the financial planning field.  Those of you in the biz who would like to chat with this bright young lad about his career plans, feel free to drop me a line.

    Click HERE to read the report.

    *  *  *  *  *

    UPDATE:  2:04 PM

    No change to Fed policy.

    SPX just back tested the broken channel, a bearish development if it holds.   I’ll try a tentative short position here at 1693.64, stops at 1695.

    UPDATE:  2:18 PM

    SPX just back tested the top of the falling red channel — a bullish development if it holds.  Covering my short and trying a long position here at 1687.

    My bias is that the broken red channel will ultimately prove more important and the bears will win out.  But, TPTB have a very strong interest in propping portraying this as a positive announcement.  I imagine they’ll throw a bunch of freshly printed sawbucks at it as usual.

    But, I’ll have a hard time getting excited about further upside unless SPX can break back into the rising red channel — call it 1695.  Apparently, investors are having the same reaction, as SPX has again stalled back at its lower bound.

    Back to the short side unless it can break through. Of course, if it does, there’s the 1698.78 high, the 1696.19 .886, and the psychologically important 1700 to contend with.  Stay tuned.

    continued for members(more…)

  • Charts I’m Watching: Jul 30, 2013

    Futures are indicating several points higher, but it will probably be enough to take SPX right back into resistance.  I’ll play along on the upside, but be prepared to ditch the long position at any sign of trouble.

    The first challenge will likely come at the IH&S neckline around 1692.60.

    UPDATE:  9:33 AM

    SPX just notched higher than the neckline, but is just shy of either of the .786’s.  I’ll switch sides here at 1692.60 and see if we get much of a reaction.  Stops at 1693.25 — though the .786 and .886 are just above at 1694.08 and 1696.19 so would come into play rather quickly.

    So far, SPX is following the upside forecast we laid out last week [see: July 24 update] …just slightly out of phase from a time standpoint.  Of course, there are other less bullish scenarios we also charted.

    continued for members(more…)

  • Charts I’m Watching: Jul 29, 2013

    Short, my friends.

    Though ES climbed back into the purple channel by the end of the day Friday, it has since stayed in line with the falling white channel.

    UPDATE:  9:34 AM

    We’re getting a bounce here at the former 1687.18 high, so I’ll play the long side with tight stops (1686.75ish.)   I don’t necessarily expect a breakout, but it’s the logical play.

    The USDJPY has reached the purple channel midline as we discussed and should get a bounce here at 97.62.  Though a drop through it would also drop the pair from the white channel, which would target the yellow midline and H&S neckline at below 95.

    EURUSD reversed at the white .786 almost where it intersects with a falling channel top. The .886 at 1.3339 looks to be next up unless the purple channel line and narrow acceleration channel fails.

    UPDATE:  10:15 AM

    SPX just stopped out at 1686.75, back to short with target of 1680-1683 and stops at 1688ish.

    Bears are chomping at the bit, and bulls are likely thinking IH&S — the theme behind the bullish scenario on the above chart (last Thursday’s forecast shown in purple.)

    UPDATE:  11:20 AM

    SPX has reached our initial target area (1680-1683.).  The bottom of the red channel is just below at 1678-1679, but an IH&S from here would be well formed.  Watch your stops.

    UPDATE:  11:30 AM

    Should get a bounce here at 1682 — the .618 of 1676 to 1691.  Normal bounce should be to the last channel line at 1685ish.  But, keep your eyes open for any higher.

    continued for members(more…)

  • Update on Performance: June 2013

    June worked out very nicely for our strategy: +26% versus -1.7% for SPX.  This brings Q2 2013 to 53.56% and ytd 2013 to 76.99%.

    We continued to play things rather close to the vest with tight stops and very few overnight positions.  June continued the market’s practice of adding more than all of its net gains via ramp jobs.  Without the gains made in the first hour of trading following overnight ramp jobs, June would have dropped over 8% instead of posting a more modest loss.

    June far outperformed our average month returns of 10-11%.  I attribute this to a rather predictable correction to the bottom of a well-defined channel where, as expected, SPX bounced and continued its march higher.

    How predictable?  The first bottom made at 1598 on June 6 at 1598 was pretty much what we forecast on May 21.  An on-the-fly adjustment made on Jun 20 to accommodate the lower lows came in handy, too.

    While I welcome these kinds of months any time, we should consider them outliers and not become accustomed to them.  Here in July, for instance, we again face the question of whether the markets might make new highs.

    That same issue throttled performance in January and March of this year when we posted returns of only 4.5% and 8.3% respectively.

    As we’ve discussed before, the flip side of not holding positions overnight is more trading.  Beginning each day in cash, we are likely to take a position on the opening bell, play a reversal or two intra-day, and go to cash again at the end of the day — which translates into 4-6 trades per day.

    This isn’t a lot for day traders, but it’s hardly ideal for swing traders.  I will continue to try and find the right balance between the two.

    Thankfully, our results continue to come in without undue volatility.  Our largest single losing trade during the month was -0.93%, which was almost completely offset by concurrent offsetting trades.  And, we have yet to experience a negative month or even week.

    Again, there are trade offs.  We were able to limit losses by using tight stops and not holding positions overnight, but it meant a greater volume of trades.  In my estimation, it’s a reasonable price to pay.  But, I recognize that this won’t necessarily be the case for everyone.

    As we approach the startup date for the hedge fund, I have to make certain choices regarding risk and return, volatility and activity, etc.  My intent is to make choices that will be compatible with the average investor’s needs and competitive with other hedge funds.

    In HedgeCo.net’s universe of approximately 1300 funds, for instance, only 13 funds have never had a negative month.  And, of those 13, none comes remotely close to our performance figures.  Our 77% YTD through June would land us in 4th place overall; and, our 15 months of returns (approximately 175%) would land us in 12th place compared to the top funds ranked by their 36-months returns.

    None of this is to say we’ll be able to continue on such a streak.  As you will no doubt read many times in the documentation, past performance is no guarantee of future results.  But, enough of you have indicated interest in the fund that I feel we must be on the right track.

    I have been rather deliberate in preparing for its launch.  This past week was fruitful, as I finally found great office space that should be very convenient.  I have made similarly exciting finds regarding service providers, technology, and business partners.  I appreciate your patience as I work to ensure a smooth transition.

    A quick note about the fund:  I will offer only 100 slots initially.  If most of you who have expressed interest in the fund actually subscribe, then the majority of those slots will be spoken for.  Those current annual pebblewriter.com members who subscribe in the initial period (probably Sep 15-Oct 15) will be given first priority, as well as a 10% discount on their fees.

    After those slots are spoken for, I will open the fund up to others.  I don’t know how long the second period will be, but I intend to stop accepting new subscriptions once the total fund size reaches $100 million.  The fund may continue to grow, but it will be through existing investors and performance rather than through new sales.  I will probably do one last membership promotion for pebblewriter.com in the next day or two, so pass the word if you know other folks who might be interested.

    For those of you who are not accredited investors, I am exploring alternative structures — possibly registered — that will accommodate you, too.  I will pass along details as soon as I am able, but my plan is to get going on it as soon as the fund is well enough along.

    If you’re not yet on the mailing list for fund information, click here.


  • Playing Hard to Get

    SPX didn’t quite reach the .786 target I had picked out for it yesterday because the emini got to its first.  ES then bounce exactly to the .707 at the top of the channel we had been tracking and reversed, putting in a perfectly placed right shoulder for a H&S Pattern that, if it completes (1673ish), targets 1647.

    ES is now backtesting the intersection of the midline of the falling white channel and an important long-term channel line at 1678.  If it holds, the H&S should complete.

    Good time to be short — especially if 1673 falls.

    The other drama is with the USDJPY, which completed the little H&S we looked at yesterday morning and is threatening to lose support at 98.26 (hint: it will.)

    This would be a very bearish development as 98.26 is the pair’s best shot at maintaining the Crab Pattern (white) that would break it out of the falling white channel.  It’s already broken below key yellow and purple channel lines but is approaching potential support at the purple midline at 97.63.

    If the purple midline falls, it’s all the way back to the yellow midline — probably at the .786 (95.45) where the white midline and yellow midline intersect around Aug 25.  Of course, that would complete another H&S Pattern, wouldn’t it?

    Surely, the Japanese know this and are furiously buying dollars to keep the magic alive.  If they fail, a trip to 85-87 might be in cards.

    And, given the pair’s very high correlation with SPX (below in purple), this would hardly be good for US equities…

    …which, so far, are pretending not to notice that they’ve fallen out of step with the pair.

    As I wrote that last sentence, the pair broke through 98.26.  Next up, 97.65, then watch out below.

    As for the dollar itself, it is likely to reach the .786 at the falling red channel (81.546) or the .886 at the rising red channel bottom (81.111.)

    I have to get on the road shortly, but it’s appearing more and more likely that we’ll likely reach our downside target after all.  SPX completed a H&S yesterday (in red, below), but bounced hard and didn’t come close to closing below the neckline, which is required for confirmation.

    I suspect it will do the same thing again today.

    It’s working on a new one (in purple) that would target 1662ish.  All we’d need is a close below 1678 on the day.

    I think it’s likely we’ll reach not only the .786 at 1677.61, but probably 1674.91 too.  I’d take profits on my short position at either one if the market is firming up, but anyone taking a long position should be careful around that 1671.84 support.

    And, if 1680 holds, I’d have stops on the short position around 1683 — the purple channel line.

    I’ll check back in later if I get the chance — probably around 2-3PM.  GLTA.


  • Charts I’m Watching: Jul 25, 2013

    The futures are pointing toward a 7-pt drop on the opening, which would take SPX to the .786 Fib (1677.61) we identified as our initial downside target yesterday.  We remain short from 1698 on Tuesday, but will look for a bounce there.

    continued for members(more…)

  • Charts I’m Watching: Jul 24, 2013

    The eminis are up 5 pts overnight, but so far have produced only a completed Bat Pattern rather than a new high.

    The dollar is possibly breaking out of its falling wedge — though it’s too early to say for sure.

    The EURUSD has formed an interesting looking rising wedge and is coming up on a Gartley at the white .786 (not to mention a channel intersection.)

    And, USDJPY continues to stave off multiple H&S Patterns

    …with the bounce on its latest neckline Monday setting up a fractal of the Jul 5-18 Gartley Pattern.

    H&S Patterns aren’t always that reliable in currency trading, but it’s interesting that the target of the latest pattern (in the right shoulder of a much larger pattern) is the yellow channel midline back around 96 — which would spell the end of the rising white channel and complete the much larger pattern that targets the white 1.618 at 85.66.

    Indications are that SPX should reach its own .886 (1697.91) on the open.  But, no signs of follow through just yet.

    I’ll hold short unless we get a push through 1700.

    UPDATE:  9:32 AM

    SPX just tagged its own .886, so should be done here at 1698.38.

    Bears now need a drop below 1691 to officially break the rising pink channel (and purple midline.)

    continued for members

    (more…)

  • Update on NYA: Jul 23, 2013

    NYA features some of the best-formed channels of all the indices.

    It’s helpful because, when it comes to harmonics, NYA usually dances to SPX’s tune.  One recent notable exception was on May 22, when NYA completed its big Bat Pattern.

    NYA reversed at the .886 of its crash from 10,387 to 4,181 (Oct 2007 to Mar 2009) — providing excellent confirmation for our call for a top for SPX at 1687.  It performed the same duty in May 2011, Mar 2012 and Sep 2012.

    What should we read into the fact that it has now rebounded to the May 22 high?

    continued for members(more…)

  • The Fork in the Road

    The S&P 500 has one foot in the 1600’s and the other reaching for the 1700’s.  I’ll play along on the long side on the opening, but am still looking for a reversal — probably at or just above 1700.

    ES is finally trading above its own double top, but is running into a channel midline that should provide resistance around 1695.

    The dollar has found support at the .618 we pointed out yesterday but hasn’t yet broken out of the falling wedge.

    And, the EURUSD continues to waffle.

    The USDJPY fails to break out again (43 sessions since its May 22 high)…

    …and continues to run into trouble on the daily RSI chart: now stuck beneath another channel line (red .75.)  If it loses the white midline, there’s a very good chance of the H&S playing out (price chart) without the purple .886 tag (D, above) first.

    Summing it up, all the stars are aligned for a pullback here — if SPX will cooperate.

    UPDATE:  9:36 AM

    SPX gapped up to the small scale (red) 1.618, which forms a nice little rising wedge tag just shy of 1700.  I’ll drop the long position and go full short here at 1698.

    BTW, I have recently updated the RUT, COMP and NYA charts for anyone who’s interested.

    UPDATE:  1:15 PM

    SPX just broke through the midline of the small falling channel at 1694.  If the downside momentum from this morning’s reversal is to be maintained, this rise should be limited to the top of the channel: 1696-1698ish.

    While we’re waiting to find out whether the decline sticks or not, let’s take a look at the current forecast and the interesting next few weeks ahead of us.

    continued for members(more…)