
As SPX inches toward 2138, we should take another peek at the harmonic elephants in the room: the Crab Pattern and Butterfly Pattern that are about to complete.
 Some background on past Harmonic Patterns…
Harmonic Patterns can be very powerful and are the best way I know of to anticipate significant reversals in the markets. A glance at the chart above shows how the major Fibonacci price levels played key roles in SPX’s movement following the 57% decline between 2007 and 2009.
The 17% correction that began in April 2010 came after SPX approached to within 9 points of the .618 Fib level (61.8% of the decline from 1576 to 666.) That reversal, at the important .618 level, set up several subsequent reversals, and might be instrumental in how the market behaves in the coming weeks.
By first reversing at the .618 in 2010, SPX completed a Gartley Pattern when it reached the .786 in May of 2011. The ensuing 22% collapse (aided by a spectacular analog that is chronicled HERE) was fairly typical of a Gartley payoff (points X-A-B1-C1-D1 below.)
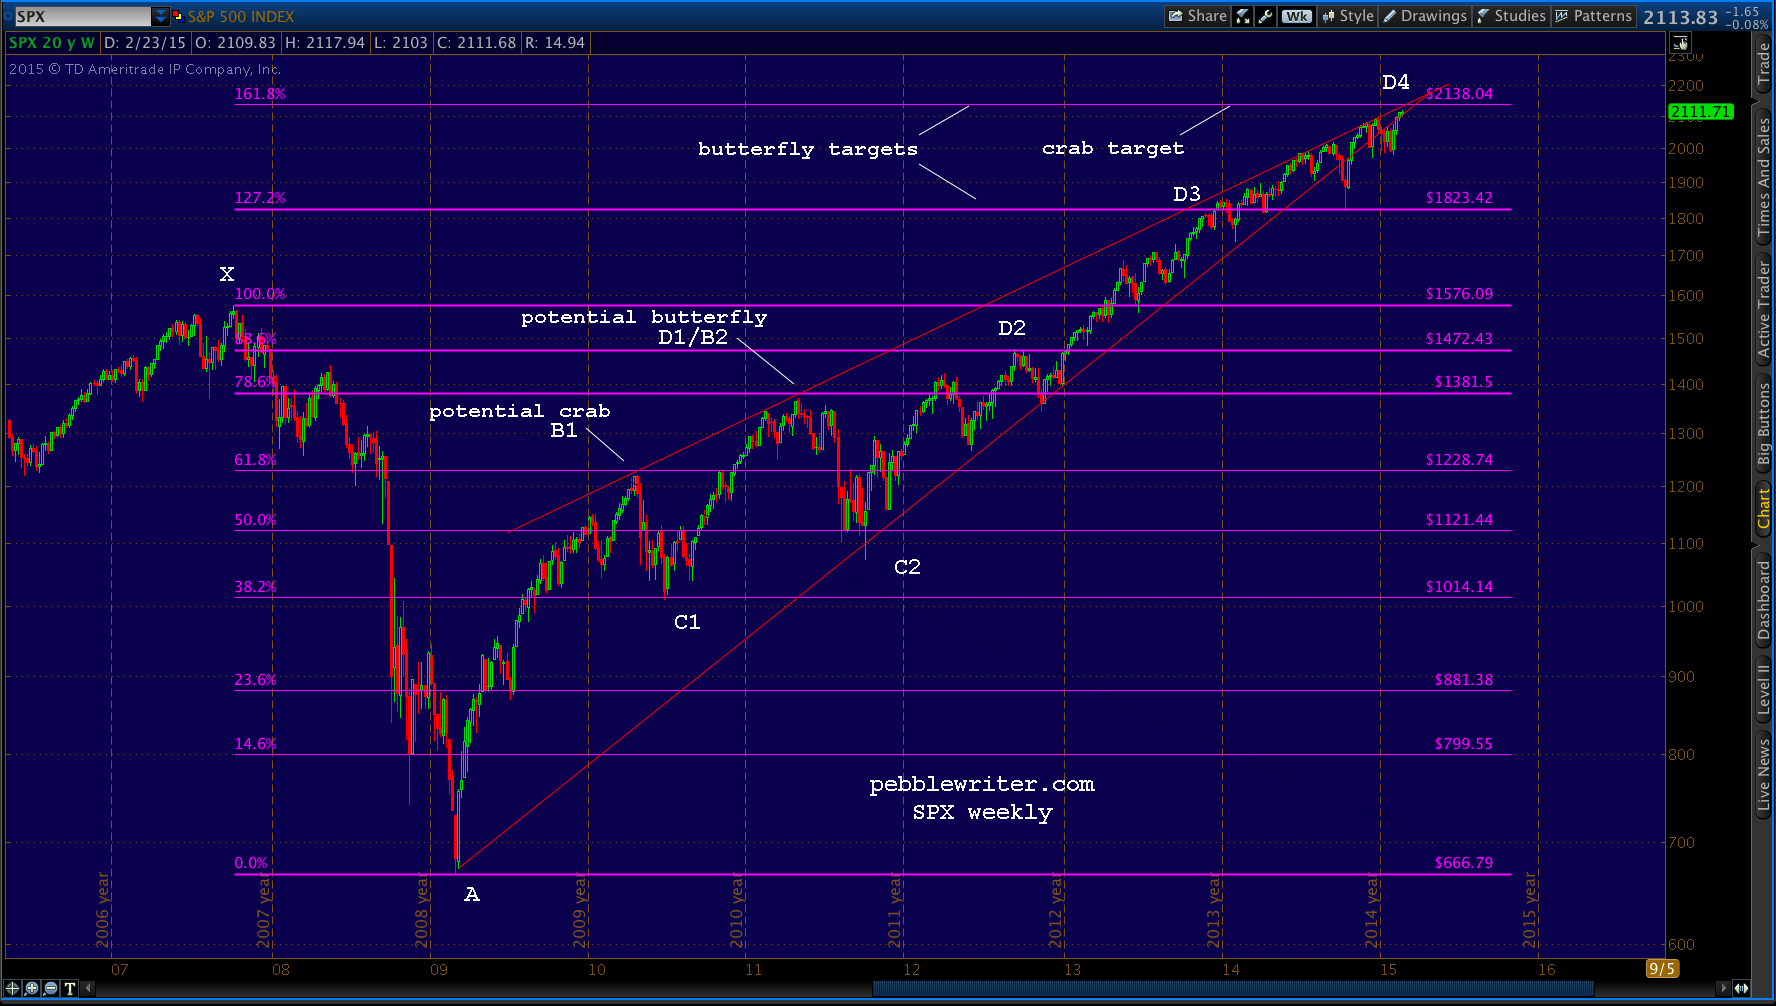 Likewise, the 9% correction that began in September 2012 following a tag of the .886 Fib — a Bat Pattern — was also set up by that original .618 reversal (X-A-B1-C1-D2.) The decline was muted, coming as it did in the wake of QE3’s introduction.
As SPX approached 1823 at the end of 2013, it was completing a potential Butterfly Pattern. Remember, a Butterfly’s defining characteristic is a significant reversal at the .786 Fib — in this case, the .786 tag in May 2011 (X-A-B2-C2-D3.) Its completion can come at either the 1.272 extension (1823) or the 1.618 extension (2138.)
SPX shot past 2138 in the week between Christmas and New Year’s in a series of carefully orchestrated ramp jobs revolving around USDJPY and VIX. When it finally reversed, the reaction was relatively minor at 6.1%.
Now, as it approaches 2138, SPX is completing both a Butterfly Pattern (X-A-B2-C2-D4) and a Crab Pattern (X-A-B1-C1-D4.) There are other, smaller patterns that coincide and tend to confirm the 2138 target; but, they are minor in comparison.
Will we get a significant reversal?
If there’s anything I’ve learned over the past two years, it’s that the folks who manage the financial markets — the central banks and their Wall Street accomplices — have the tools to make the markets do what they want, when they want, on a day-to-day basis, on pretty much any given day. We have only to examine what happened last October when Bullard hinted at QE4.
Forecasting the markets has sadly evolved from anticipating how a wide variety of market participants will react to price movement, economic news, earnings, etc. to anticipating what The Powers That Be have scripted. I have absolutely no doubt whatsoever that they can push and shove SPX right through 2138 if they so choose. Alternatively, they might allow a minor correction of 5-10% just to blunt the growing chorus of accusations that the market is rigged (it is.)
As a non-insider, I have no special insight into their day-to-day thinking. But, they do tend to fall back into certain patterns that can often be identified in advance — or at least as they’re unfolding.
I understand that most investors have never heard of harmonics, and many consider it to be on par with Ouija boards or throwing bones. I spend a lot of time ruminating about this, and bounce back and forth between Harmonics as some mystical manifestation of cosmic forces or merely a self-fulfilling prophecy.
But, to ignore it is to ignore the past 6 years of market action. And, as much as the TPTB would like us to believe it, all is not well in the economy or the “markets.”
Stay tuned.