

One of our favorite equity models is based on breakouts and breakdowns in the 2s10s. Breakdowns usually suggest corrections and breakouts suggest crashes. The last time we had a significant breakout was this past Feb-Apr, which saw SPX crash 21%.
 Should we worry about the breakout occurring now, with equities flirting with new highs?
continued for members…
Note that the 2s10s has popped up above the TL from 2023 and is nearing the highs last seen in April. In the past, the worst equity performance was associated with new highs as opposed to rising trend lines.
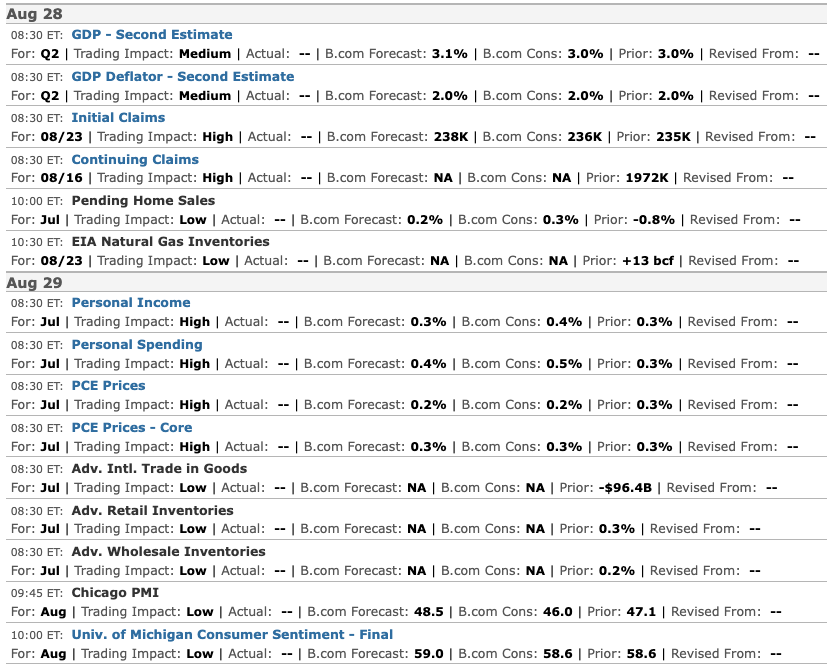
The 2s10s is currently at 65 bps, and the previous closing high was 67 bps. Between the PCE print due on Friday and the turmoil surrounding Trump’s assault on the Fed, it’s not hard to imagine the curve steepening even further.
 The 2s10s can steepen via 10Y yields rising or 2Y yields falling. At this point, the 2Y decline seems more likely. Though a hotter than expected PCE print could easily send the 10Y higher.
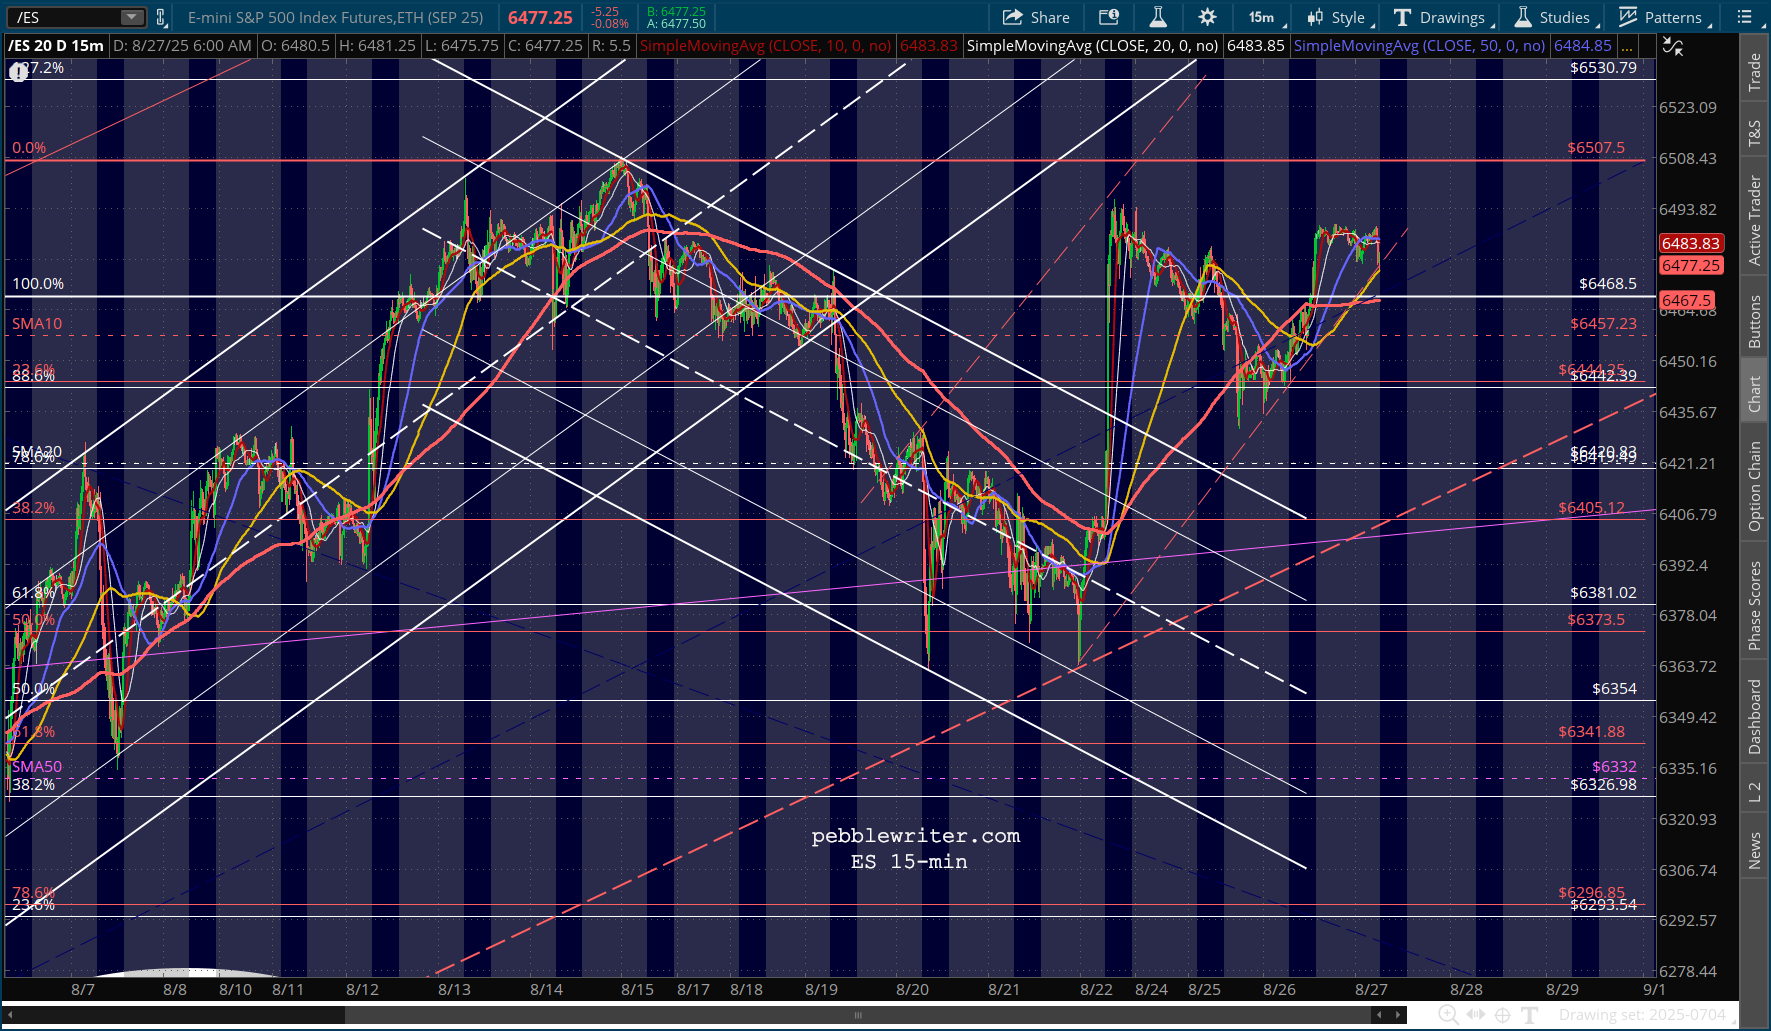
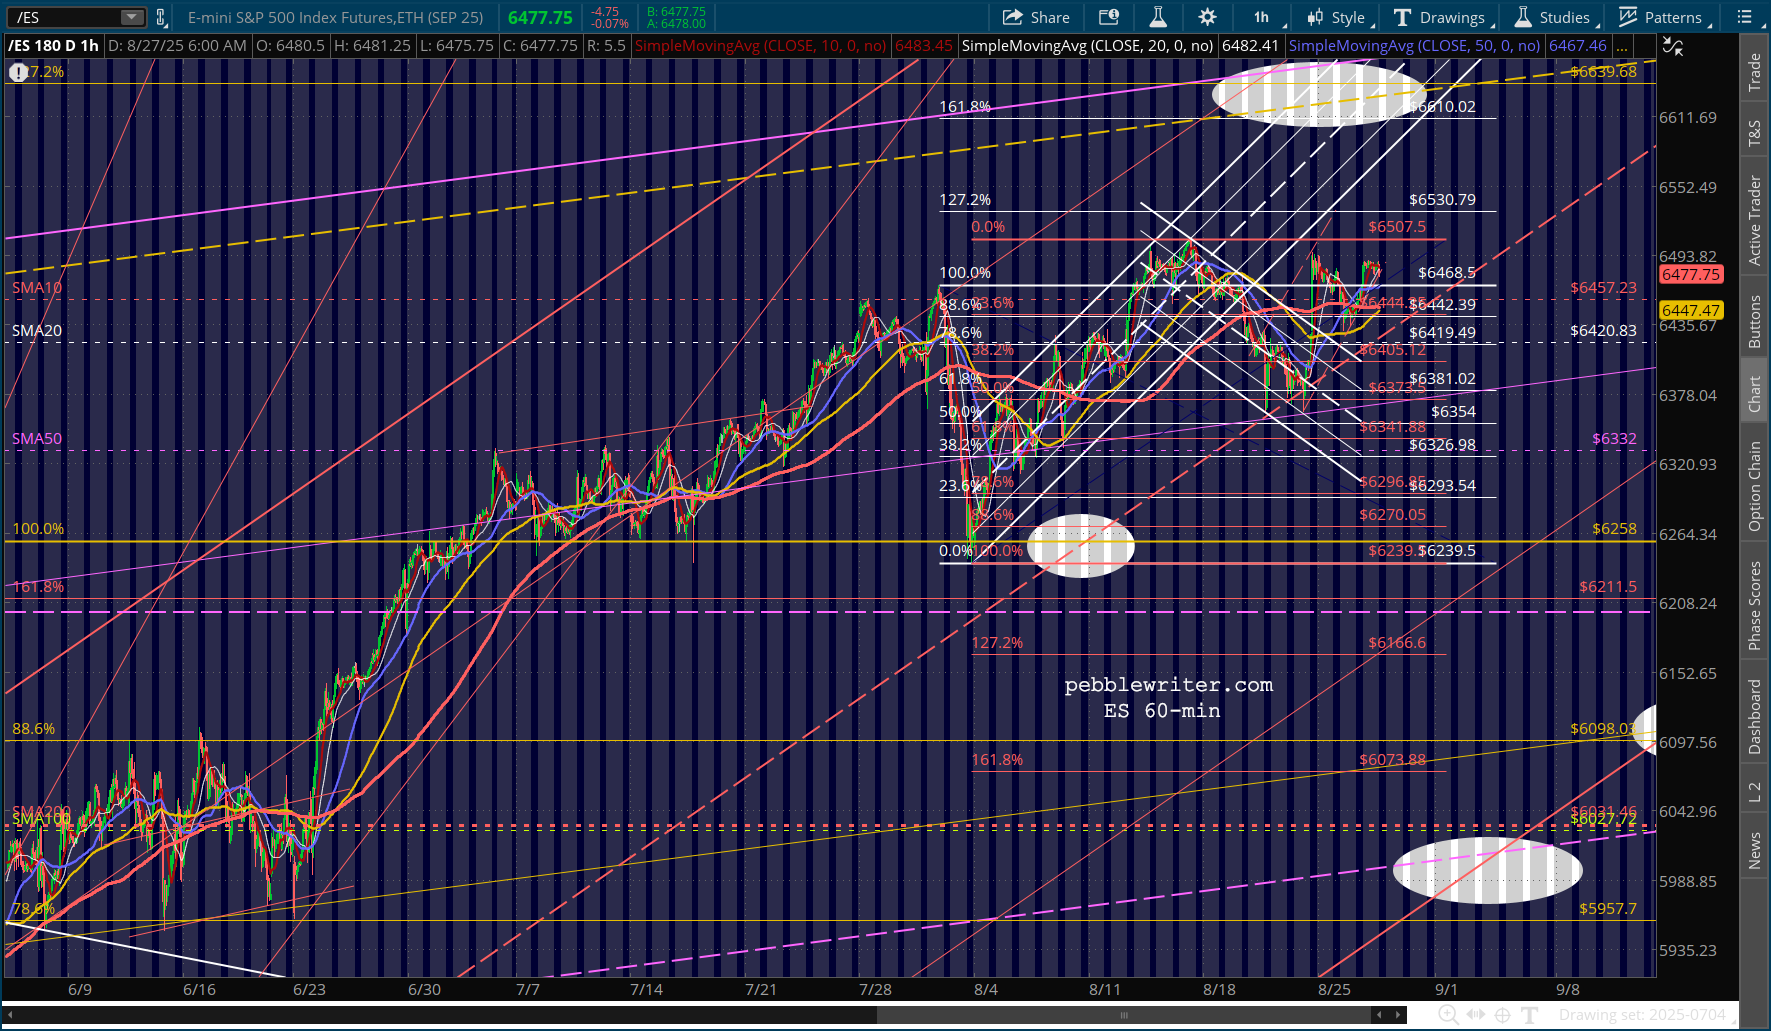
 ES is just shy of its 1.272.
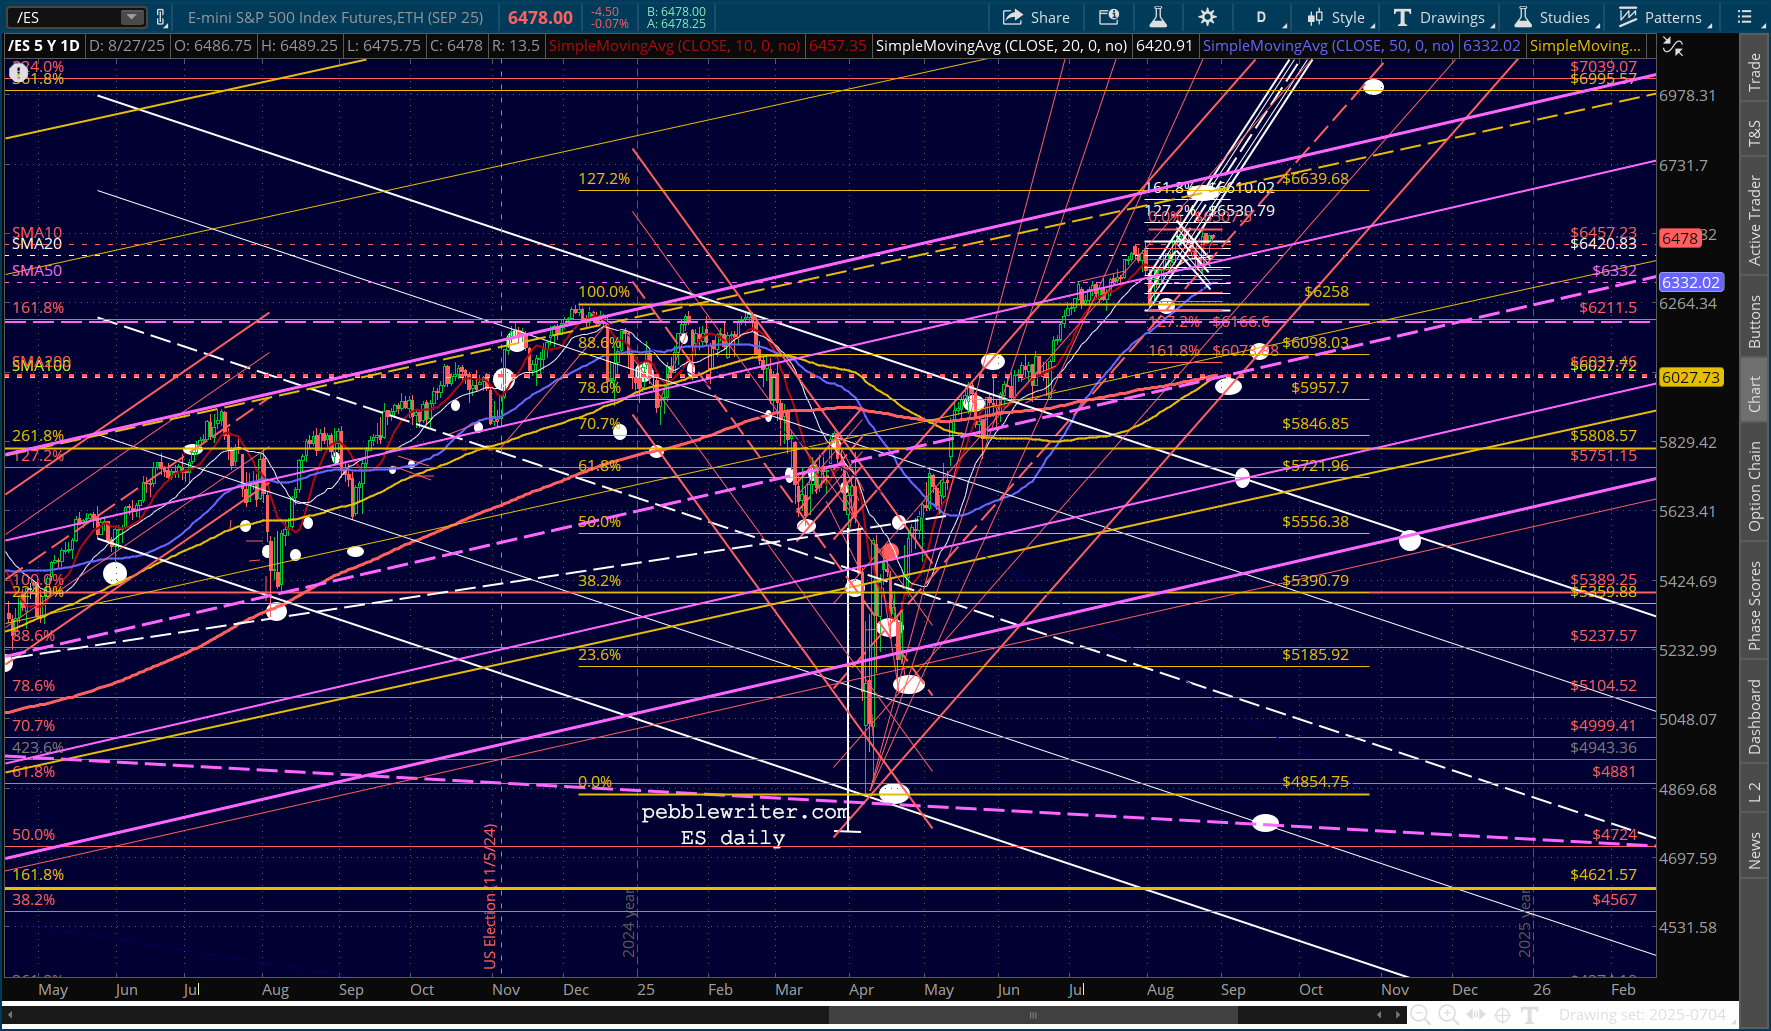 But, SPX has already reached a tangle of overhead resistance.
 Currencies continue to provide stability to DXY’s rise.
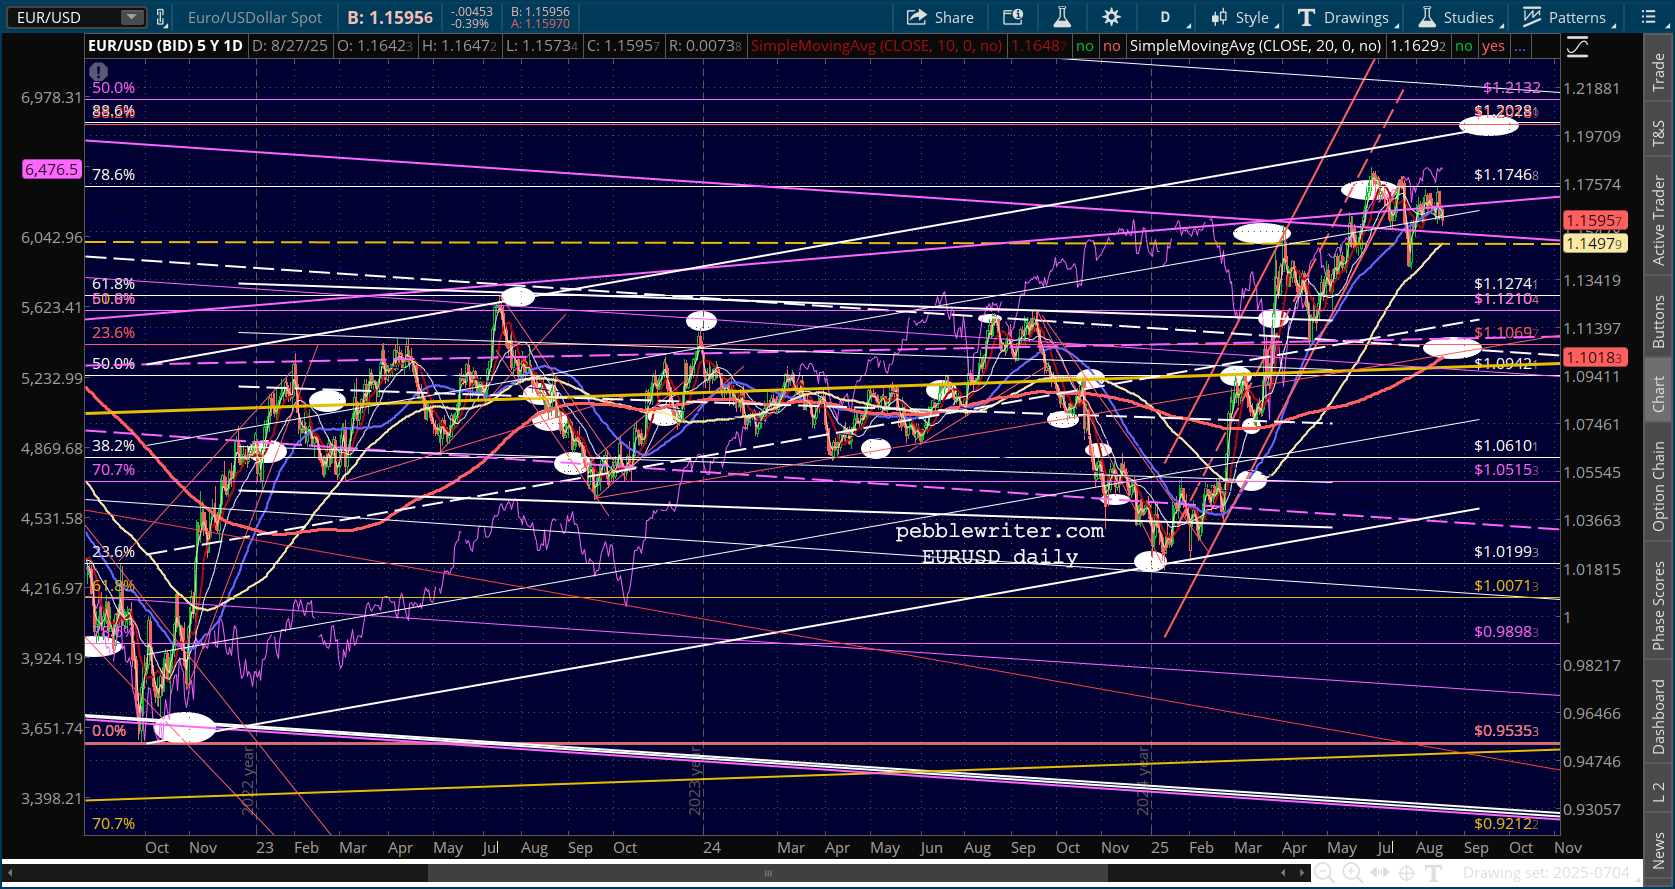

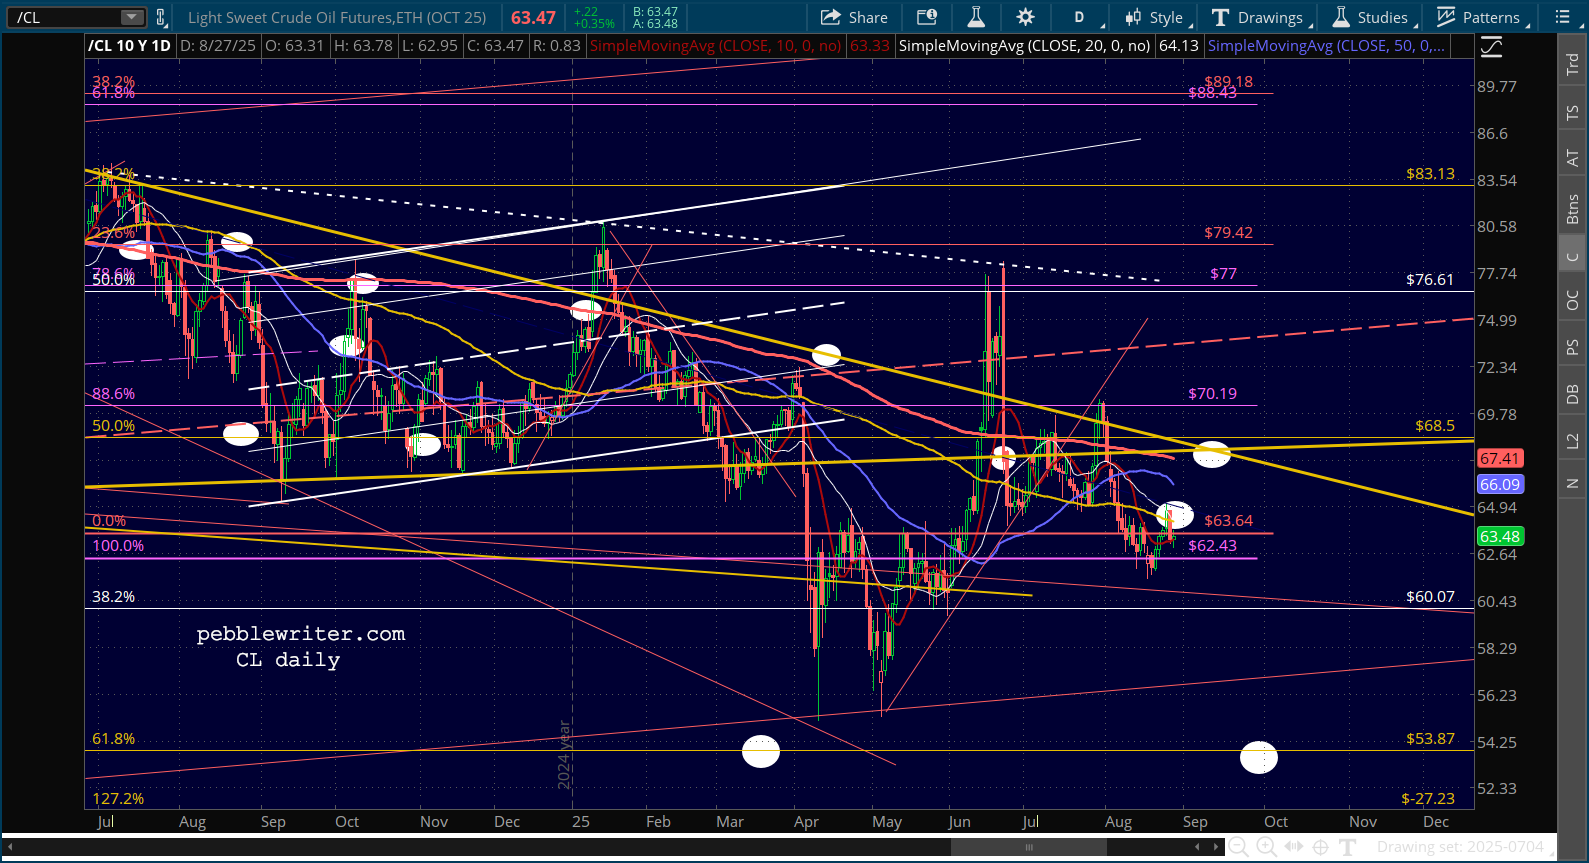
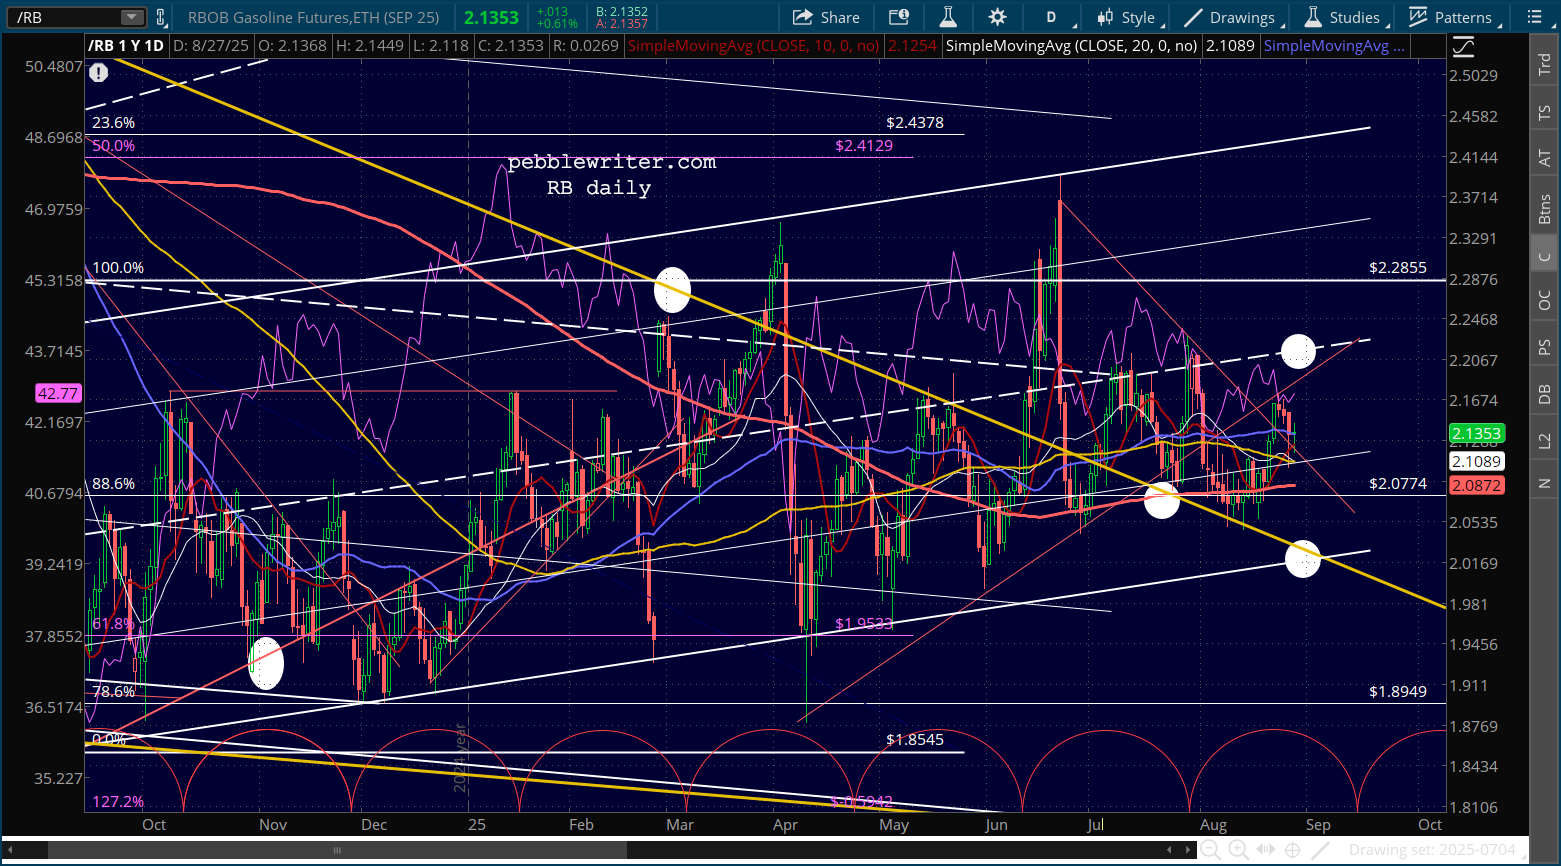
 CL and RB continue to help keep a lid on inflation expectations.
 The next two days will be very busy. NVDA reports after the bell today. And, then…
Stay tuned…