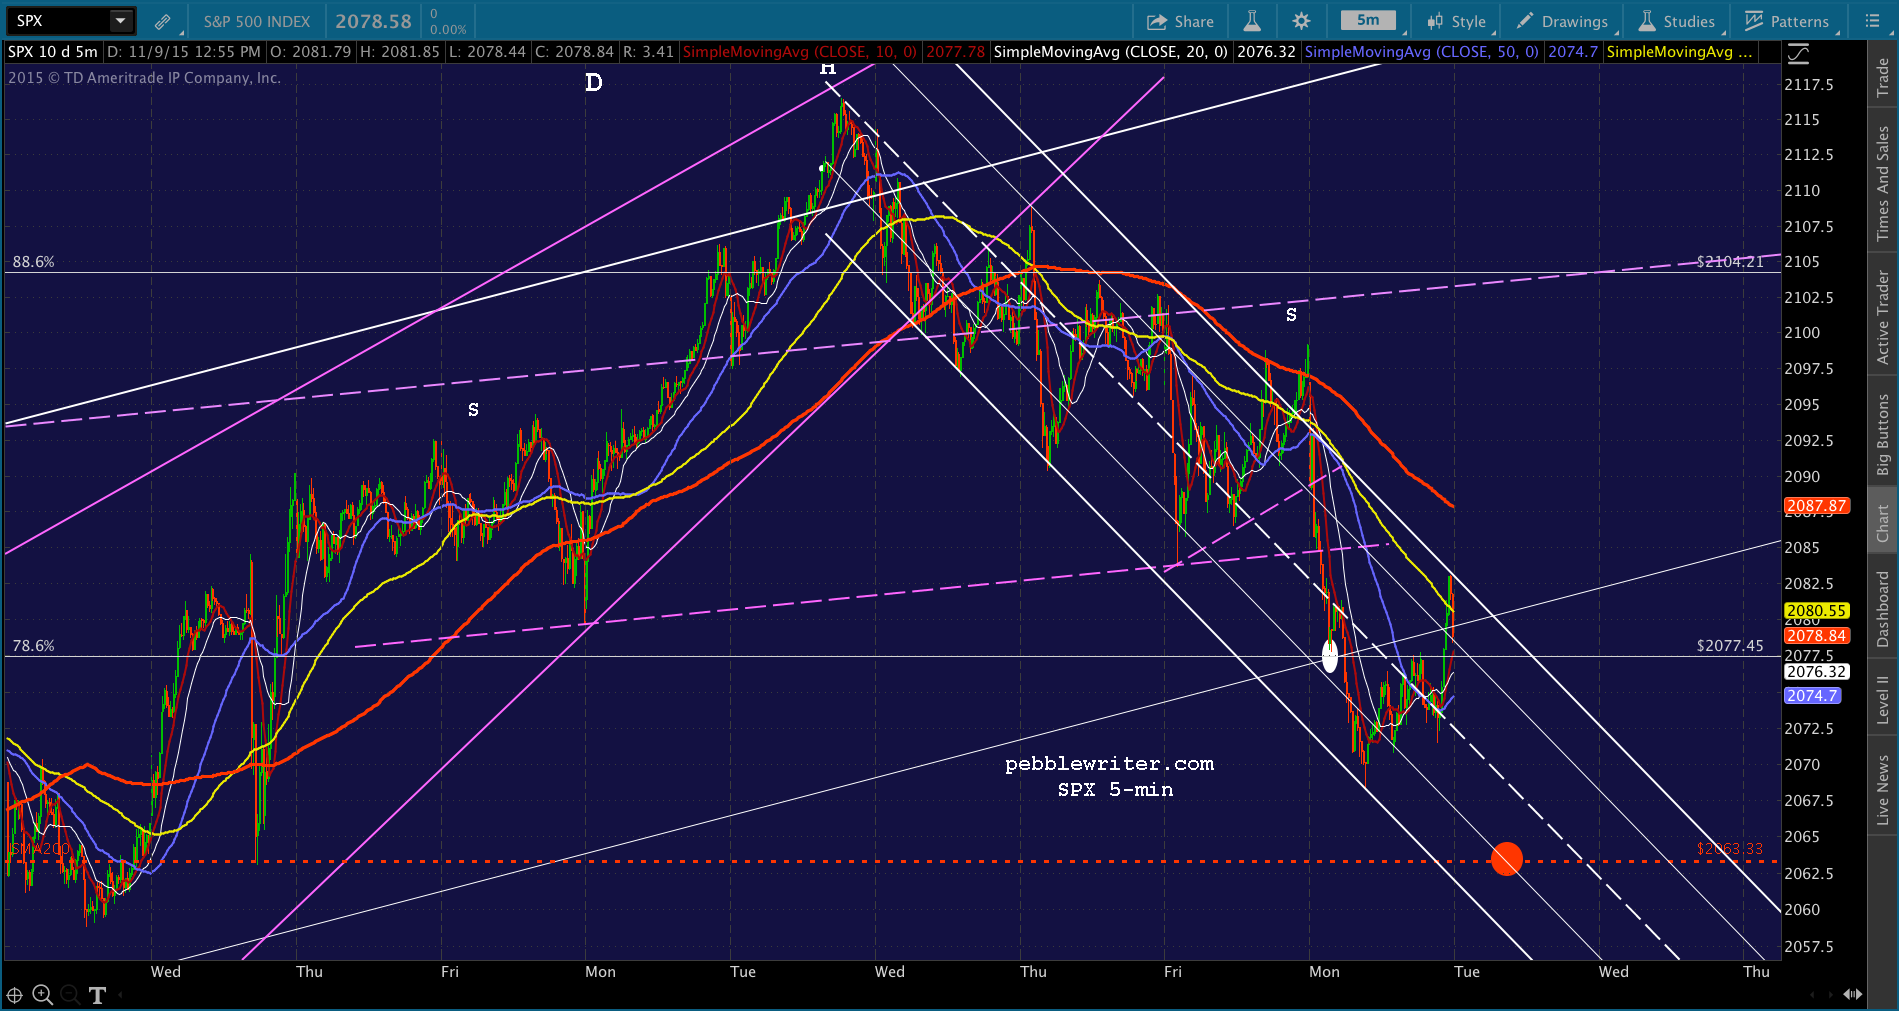
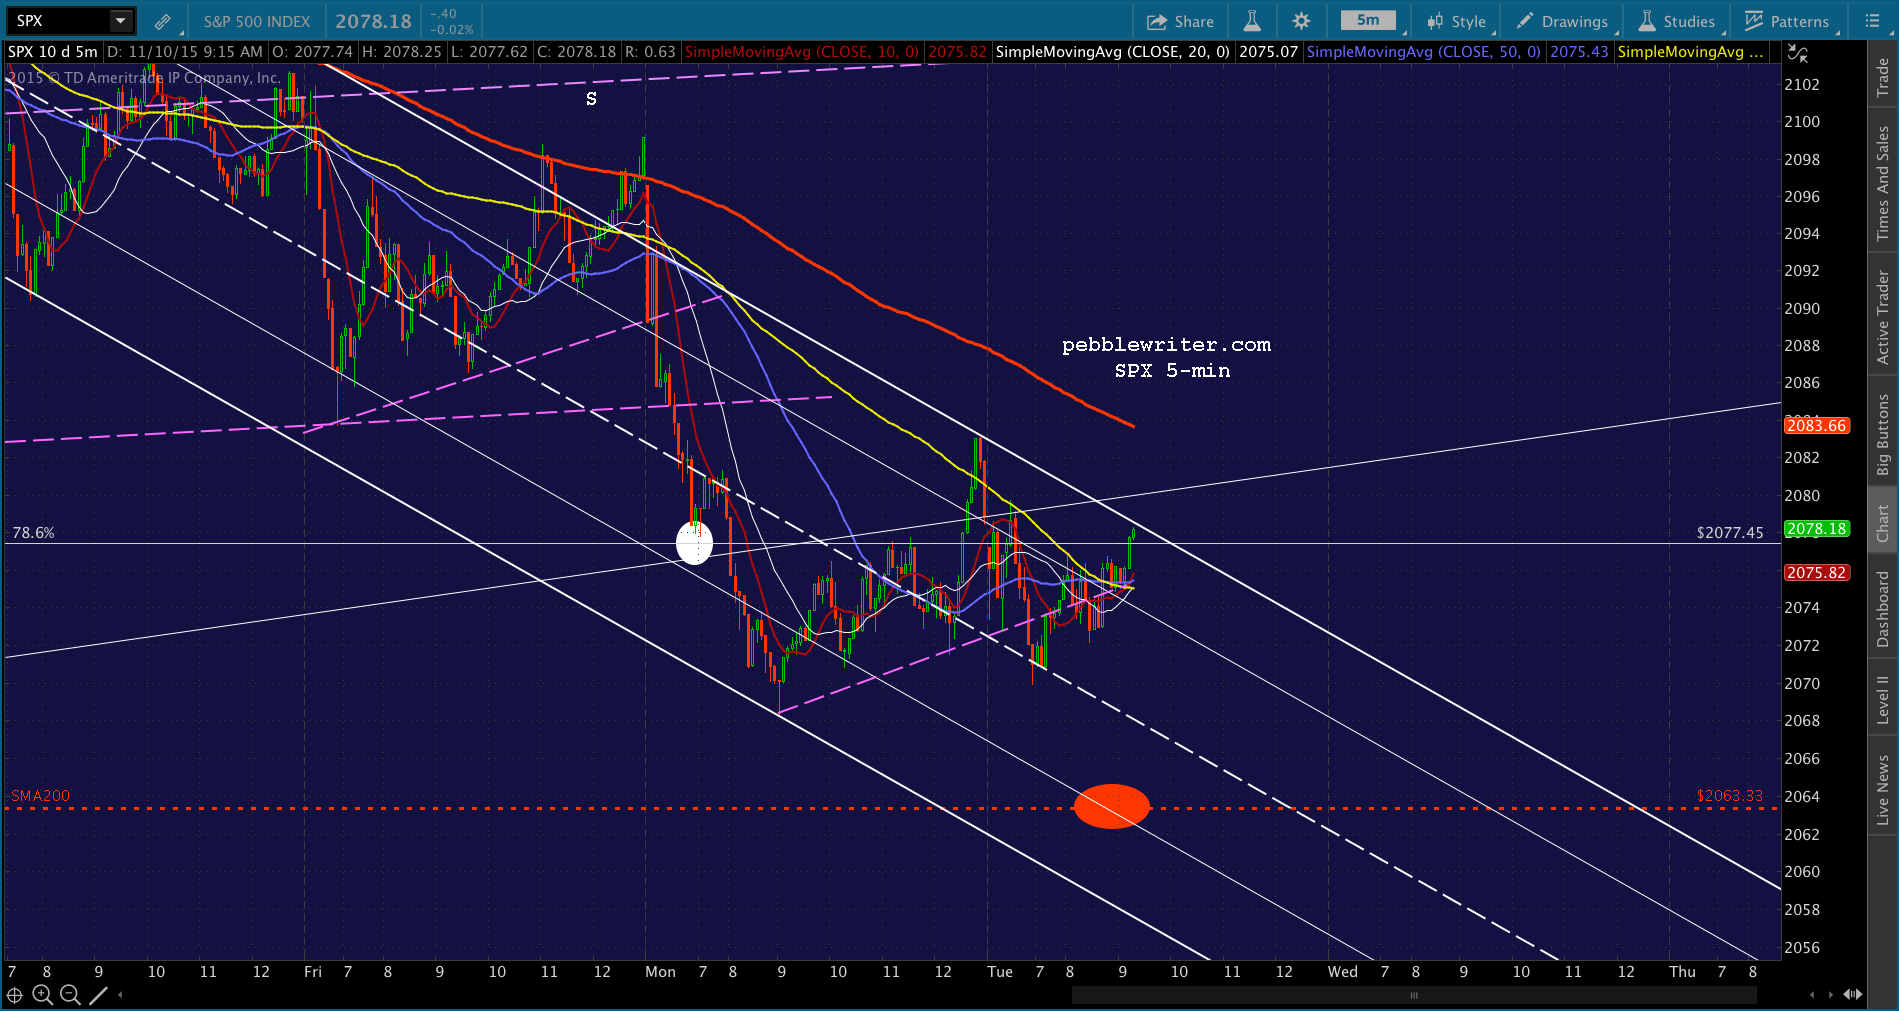
Yesterday, SPX reached our initial downside target with ease, then struggled to reach our second – coming within 5 points before the algos kicked in.
While there’s every chance in the world that this decline will be limited to a modest backtest, it’s worth focusing on the 10-yr rates chart (TNX) and what happened the last time it reversed off a trend line that dates back to 2007.
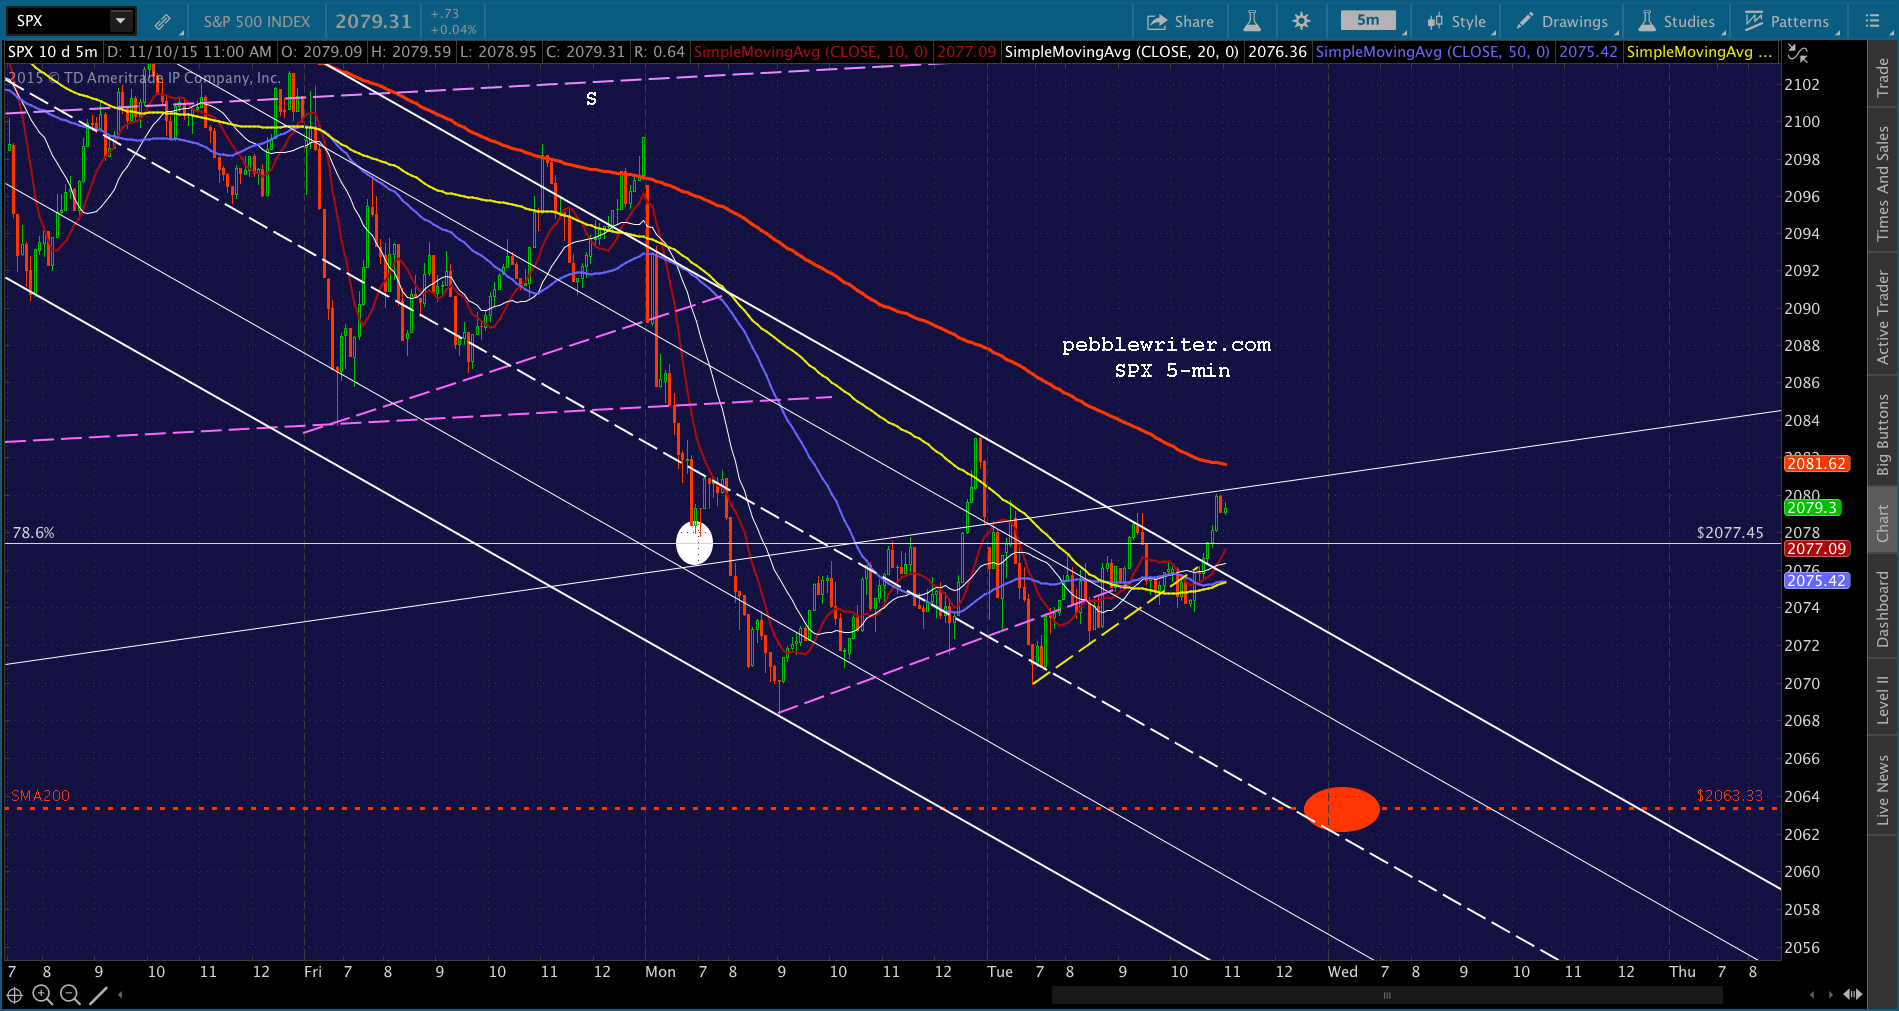
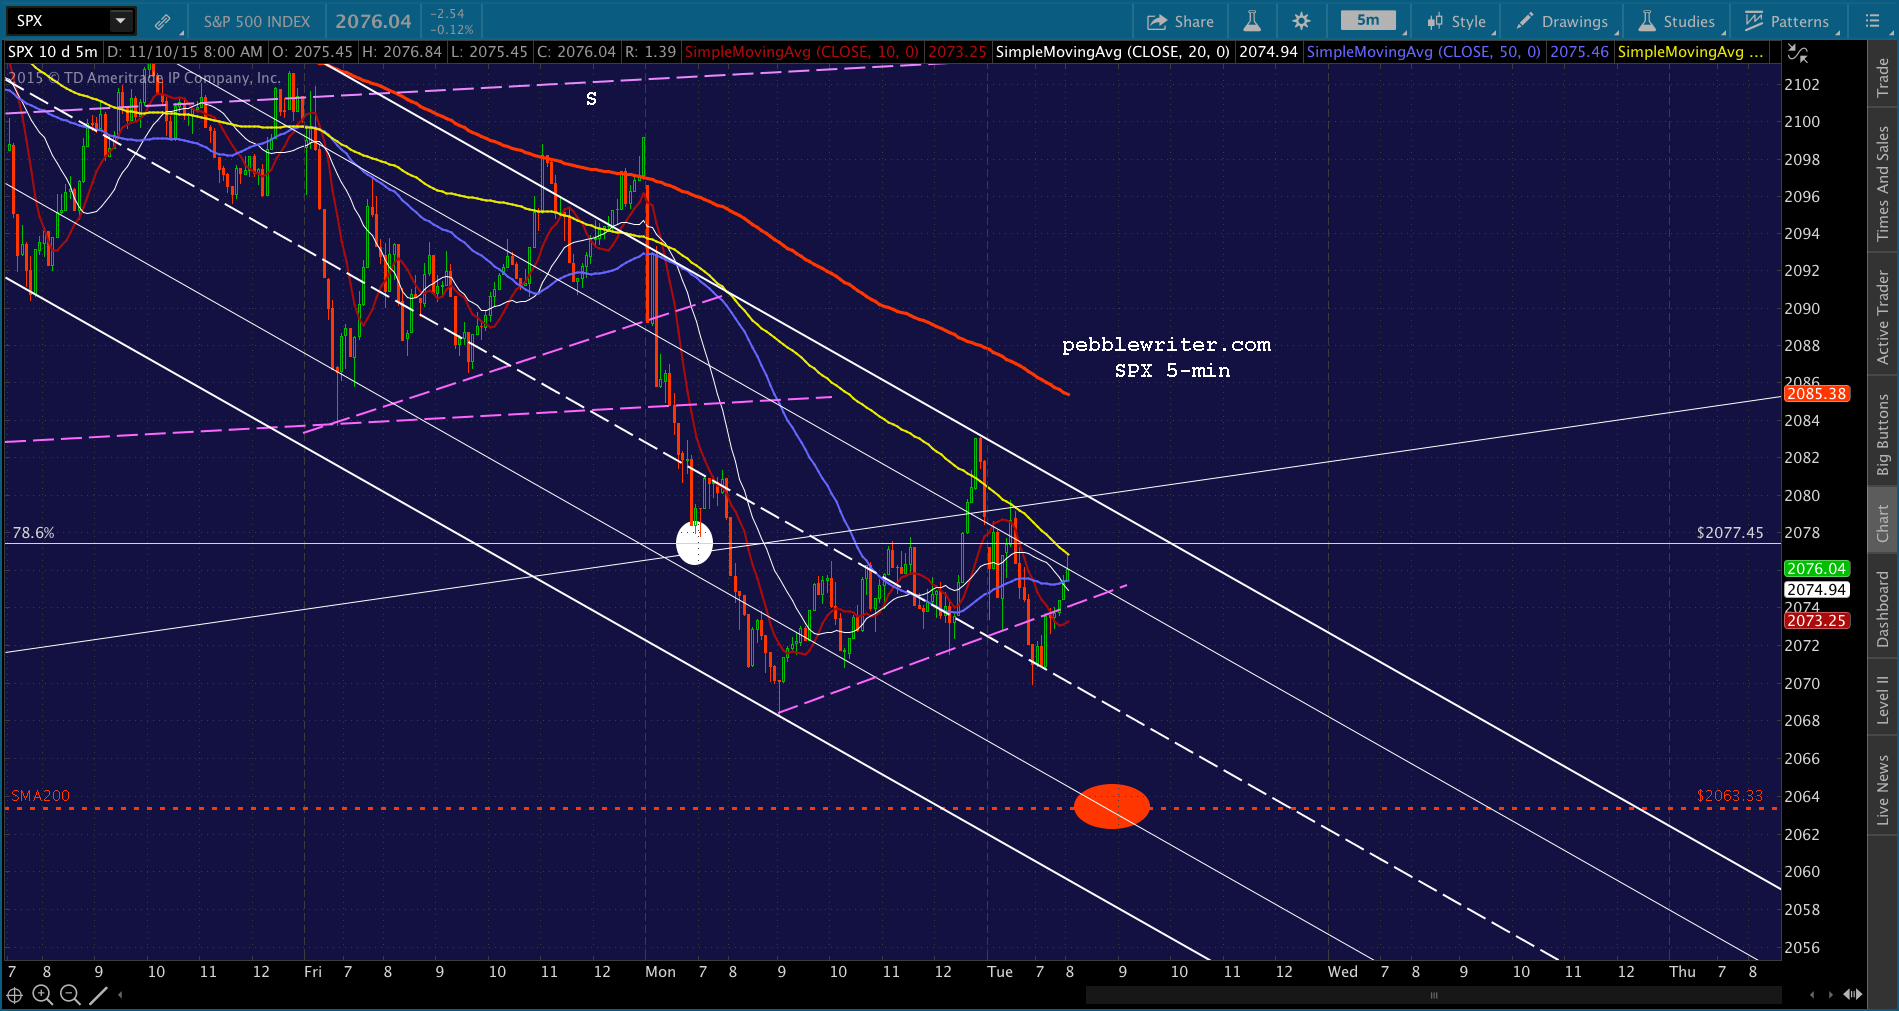
 continued for members…Our targets remain the same today, with the SMA200 at 2063.33 the initial downside bogey.
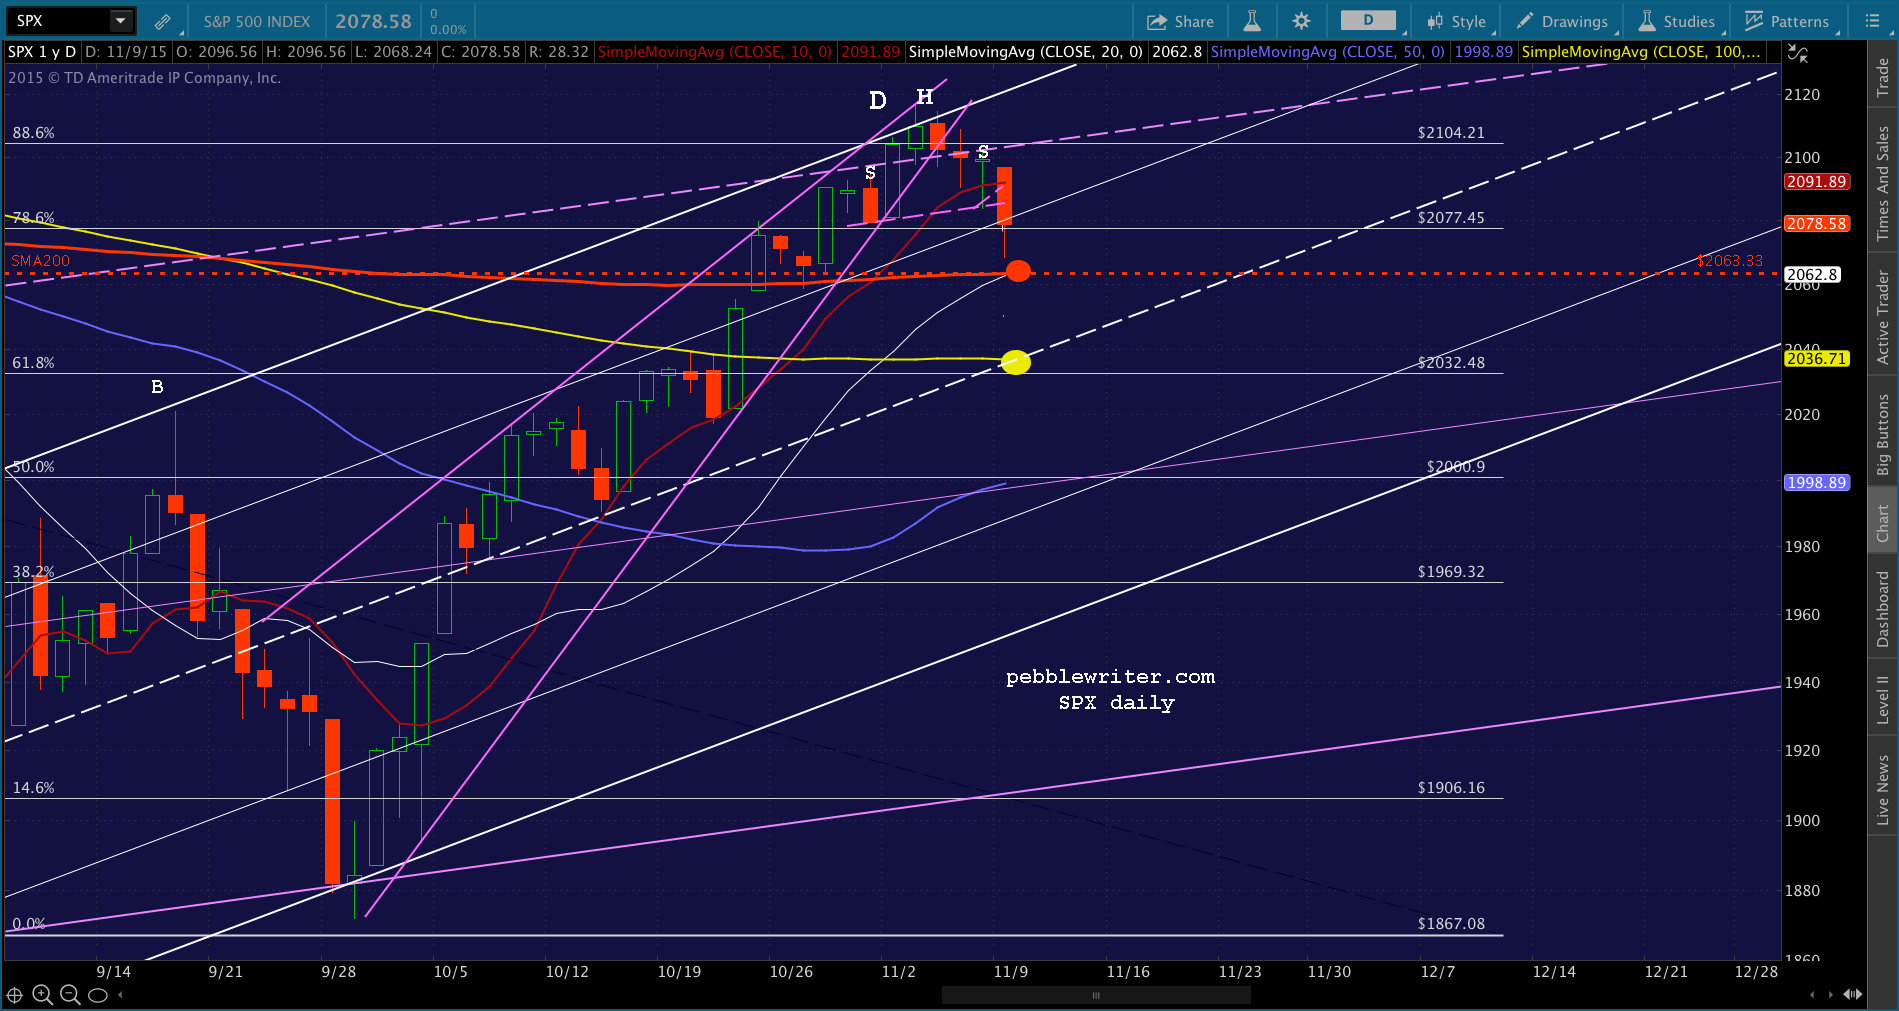
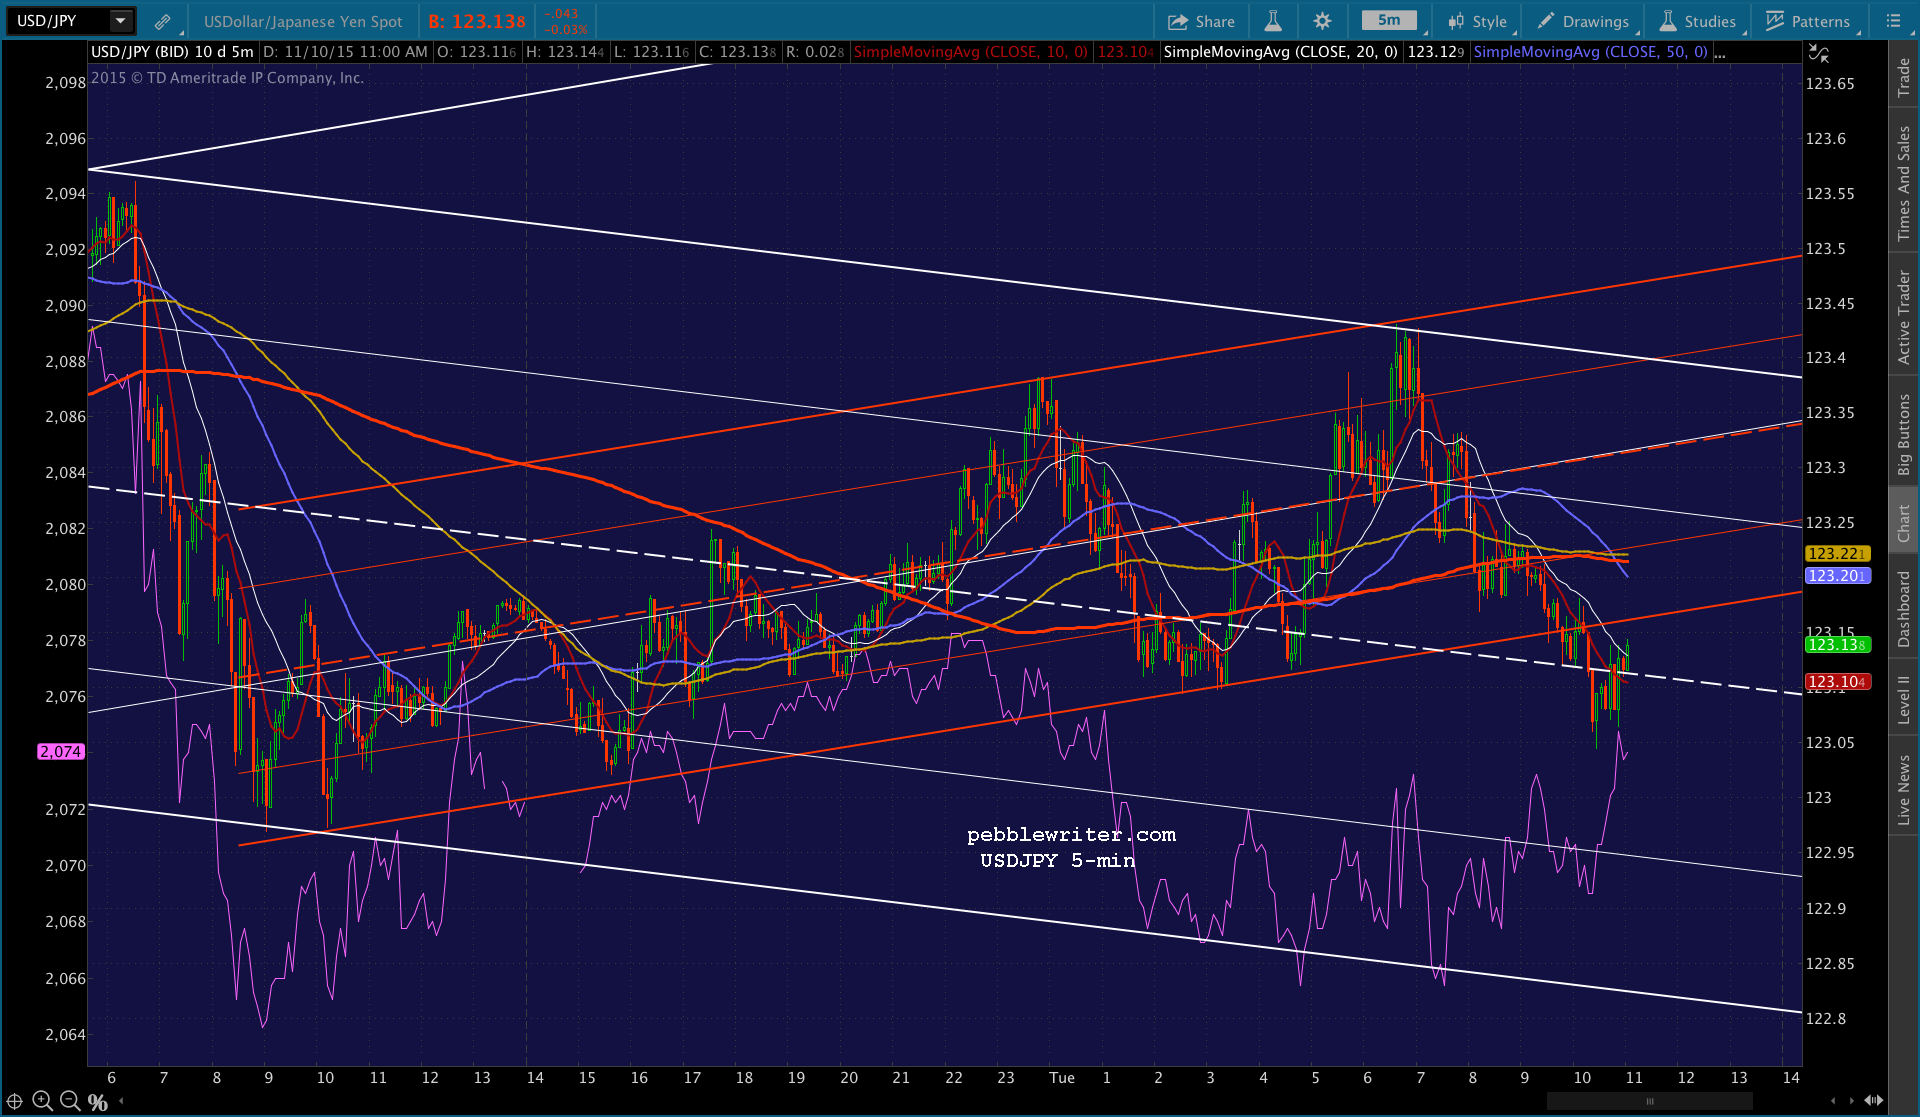
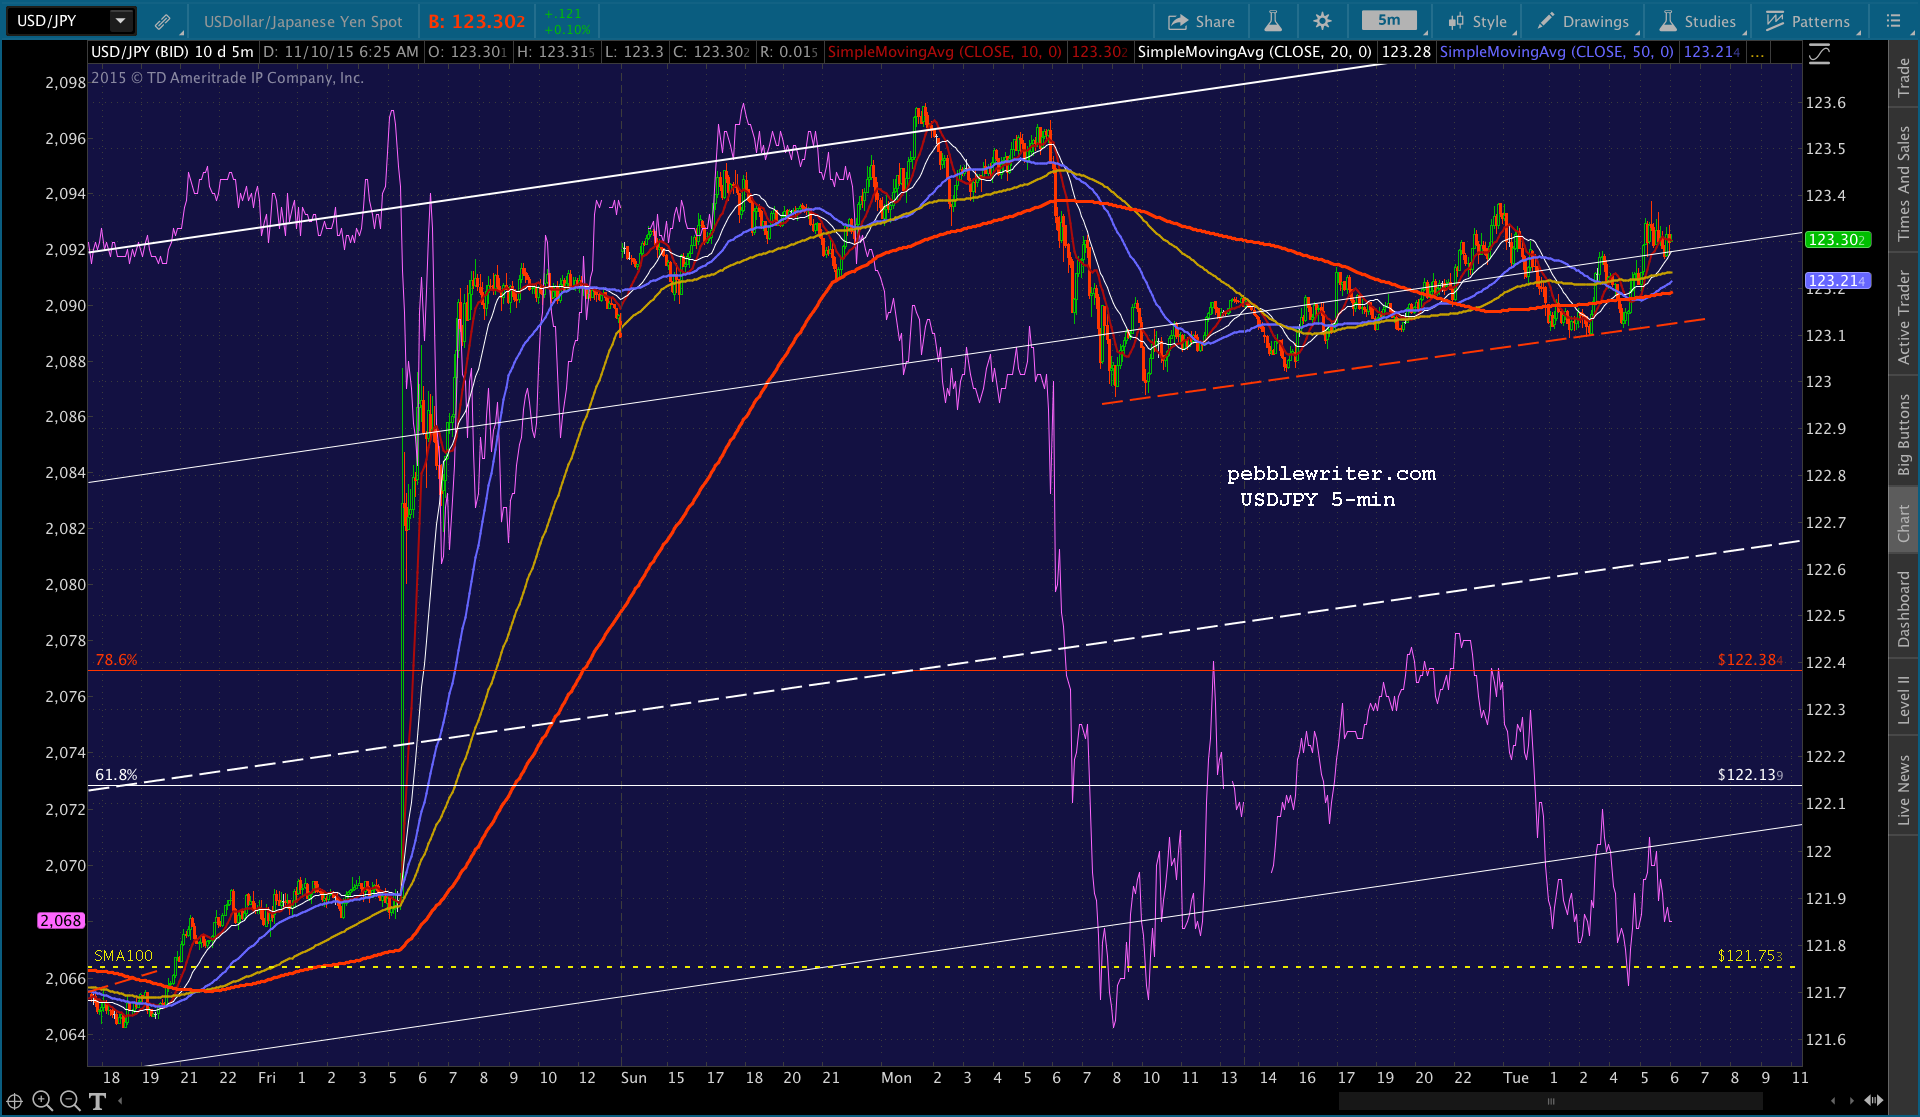
 Look for SPX to key off of USDJPY approaching or even breaking below the TL that propped it up overnight…
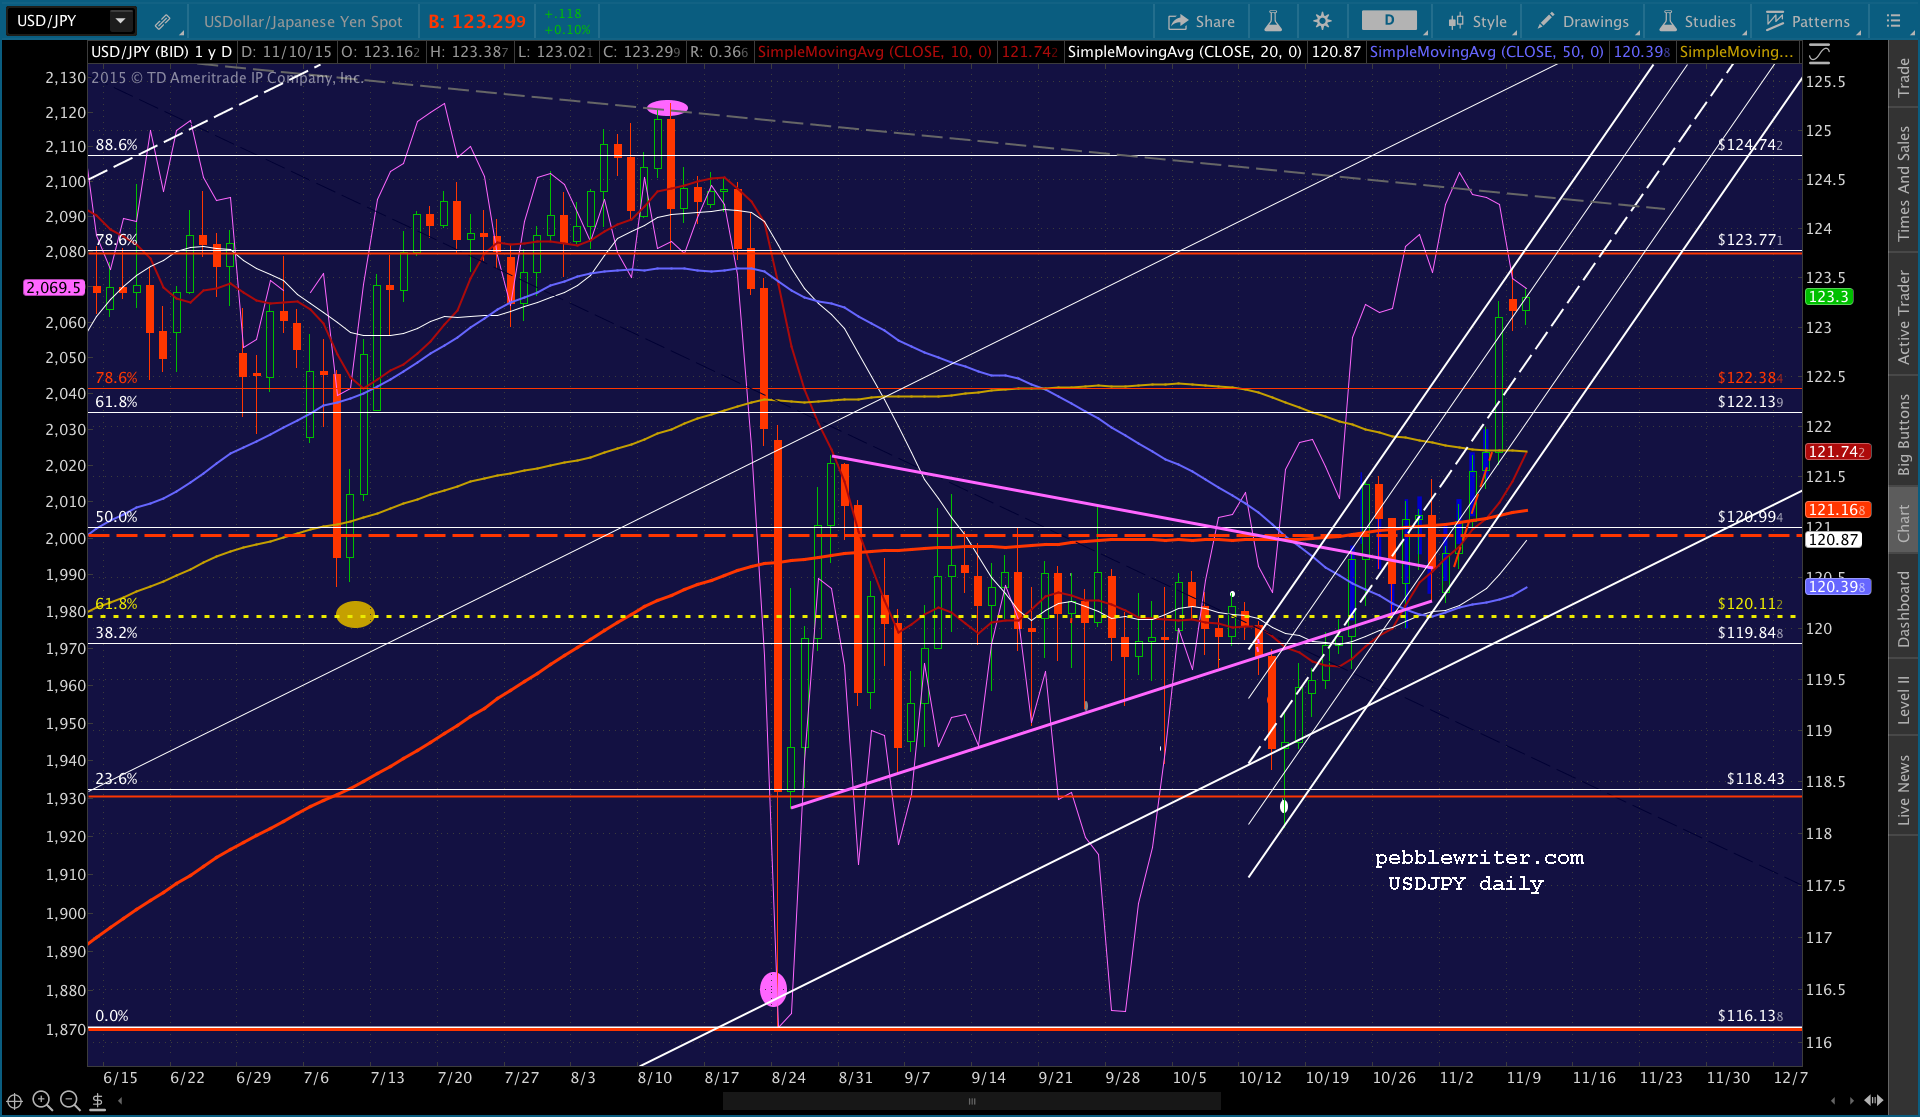
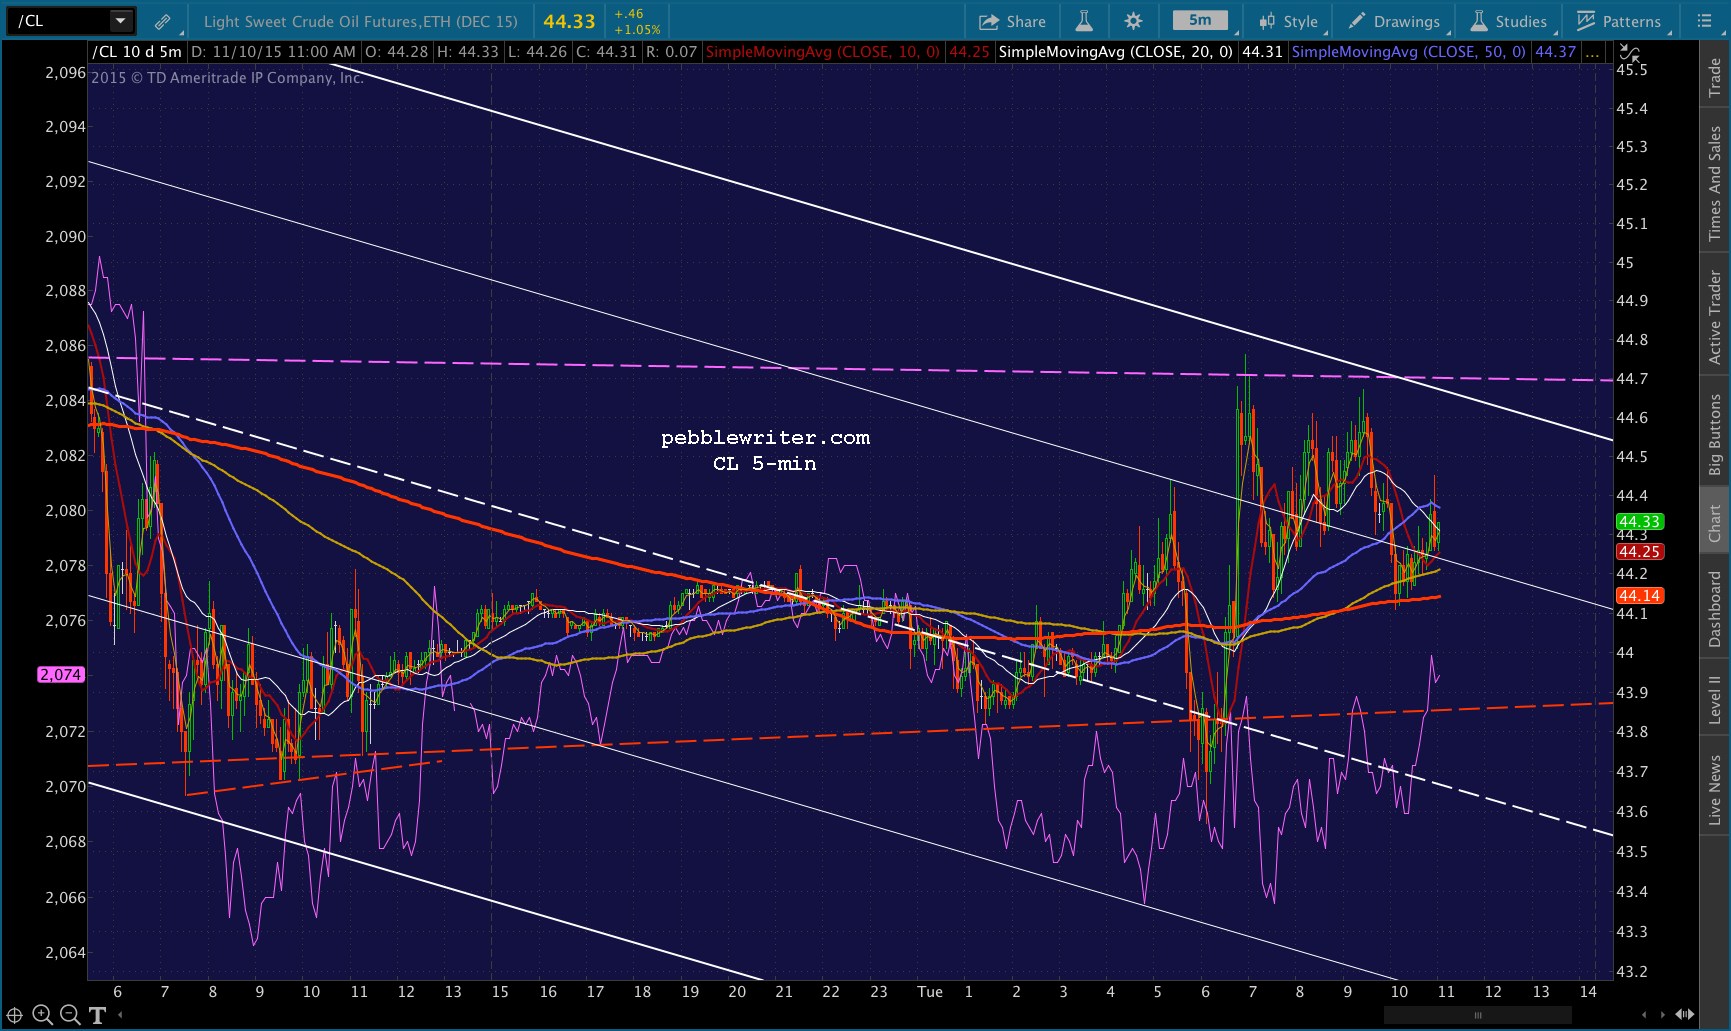
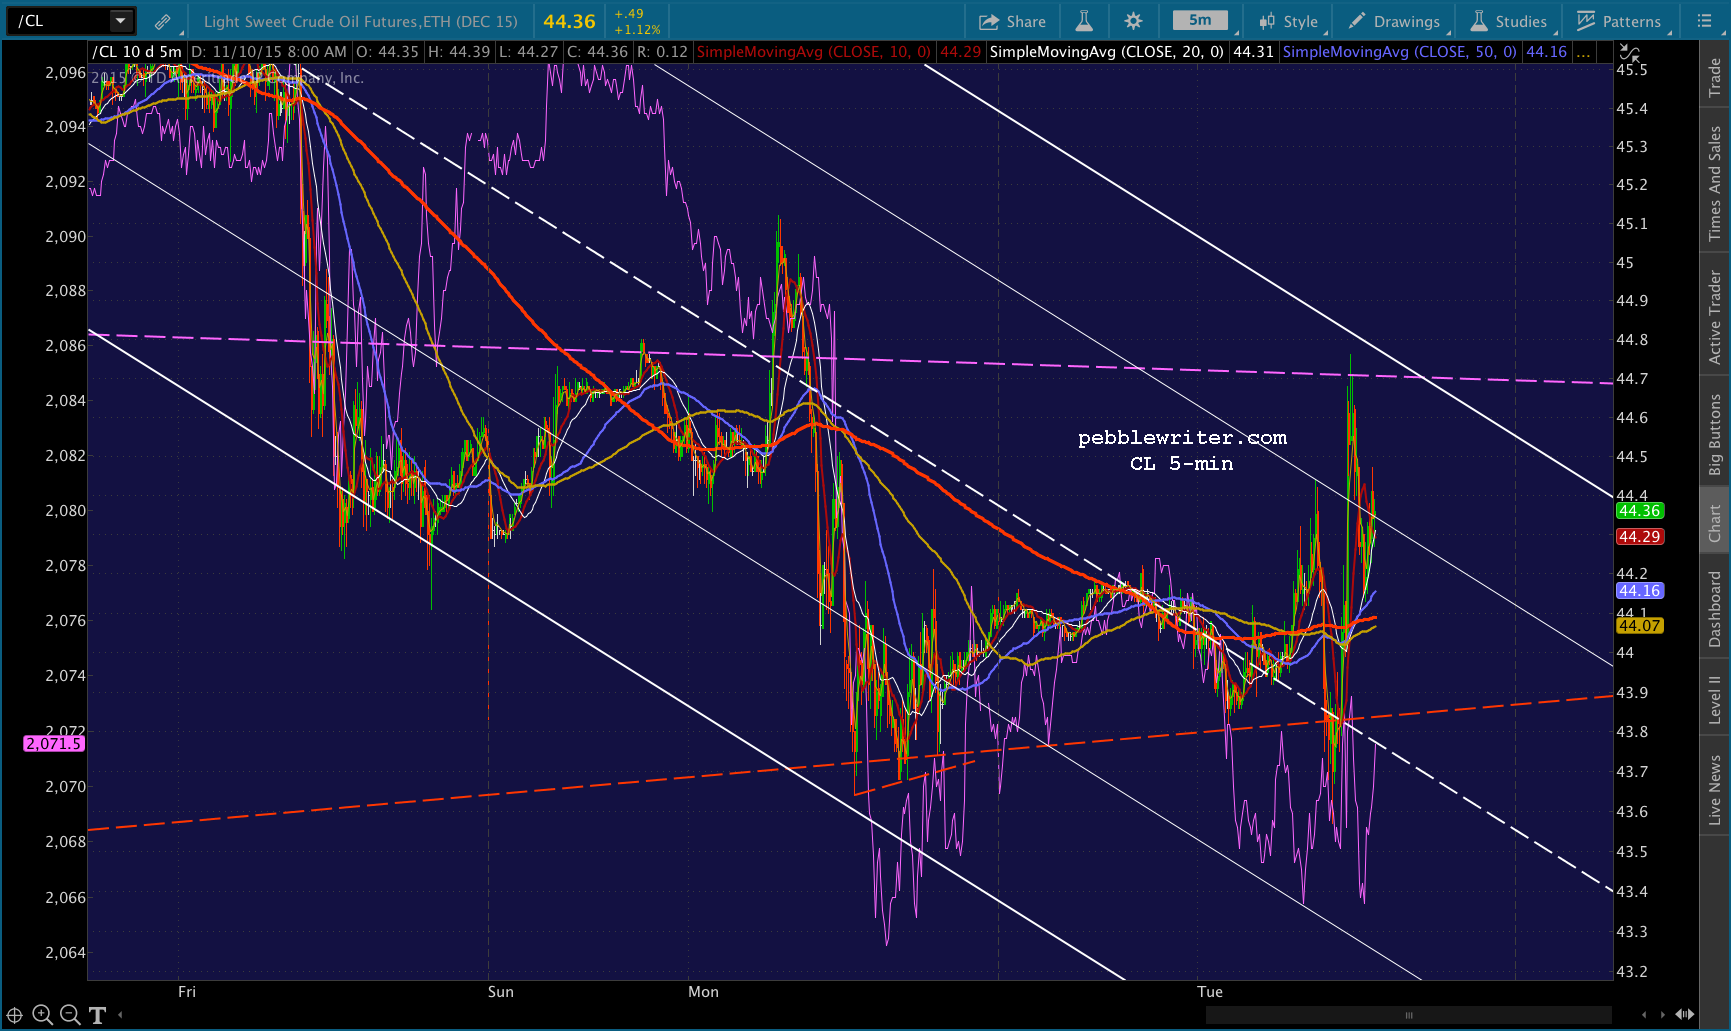
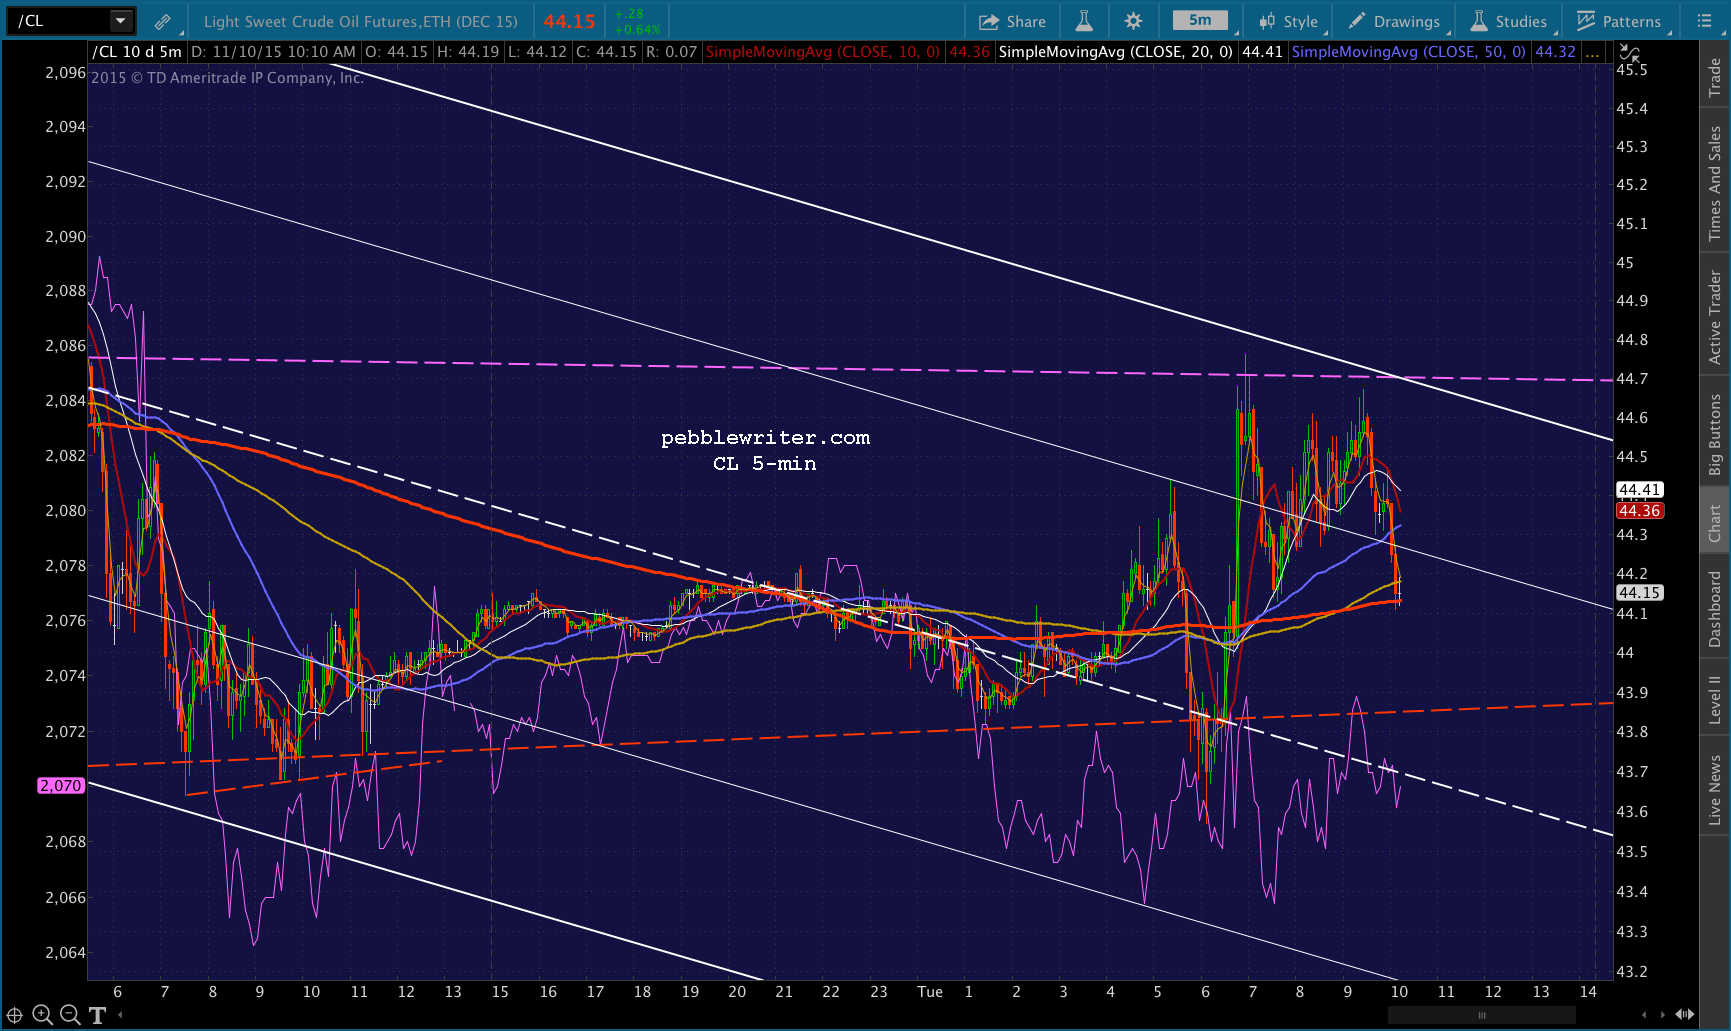
 …as well as CL, which is threatening to break below the red TL.
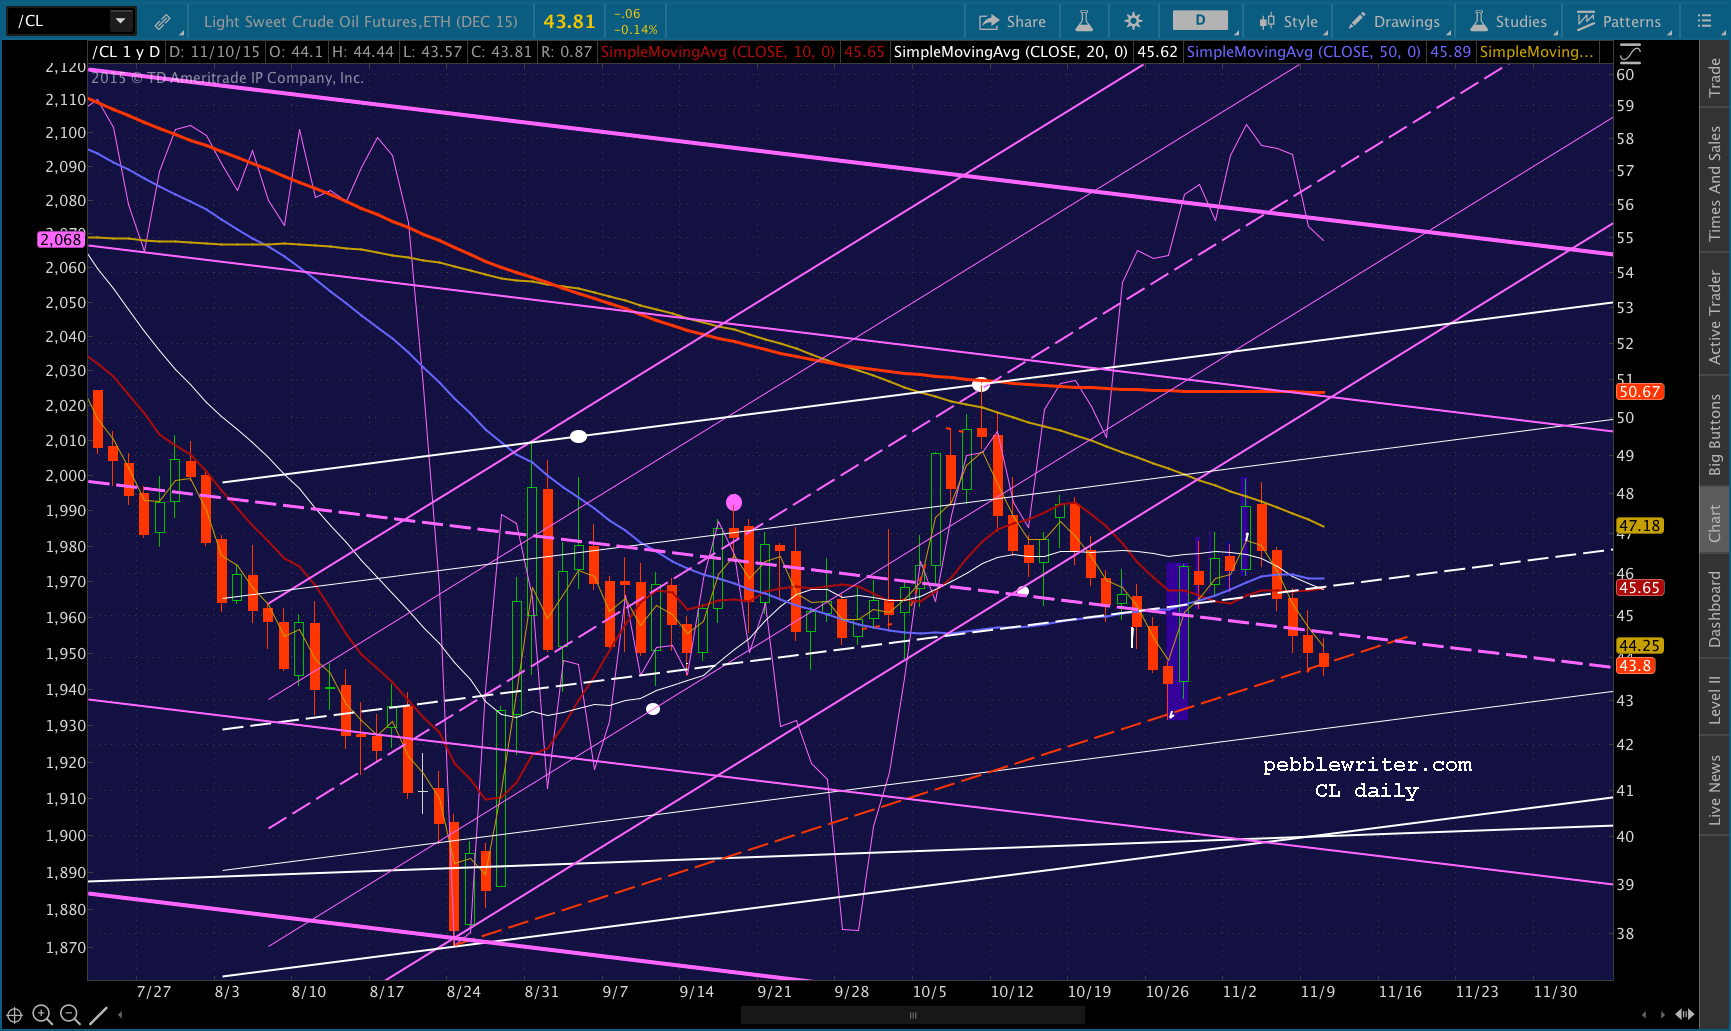 Now, as to that TNX chart… The major reversals off that TL in the past produced some sizable declines. But, the biggest ones were moves that plunged through the white channel midline — representing a significant worsening in trend.
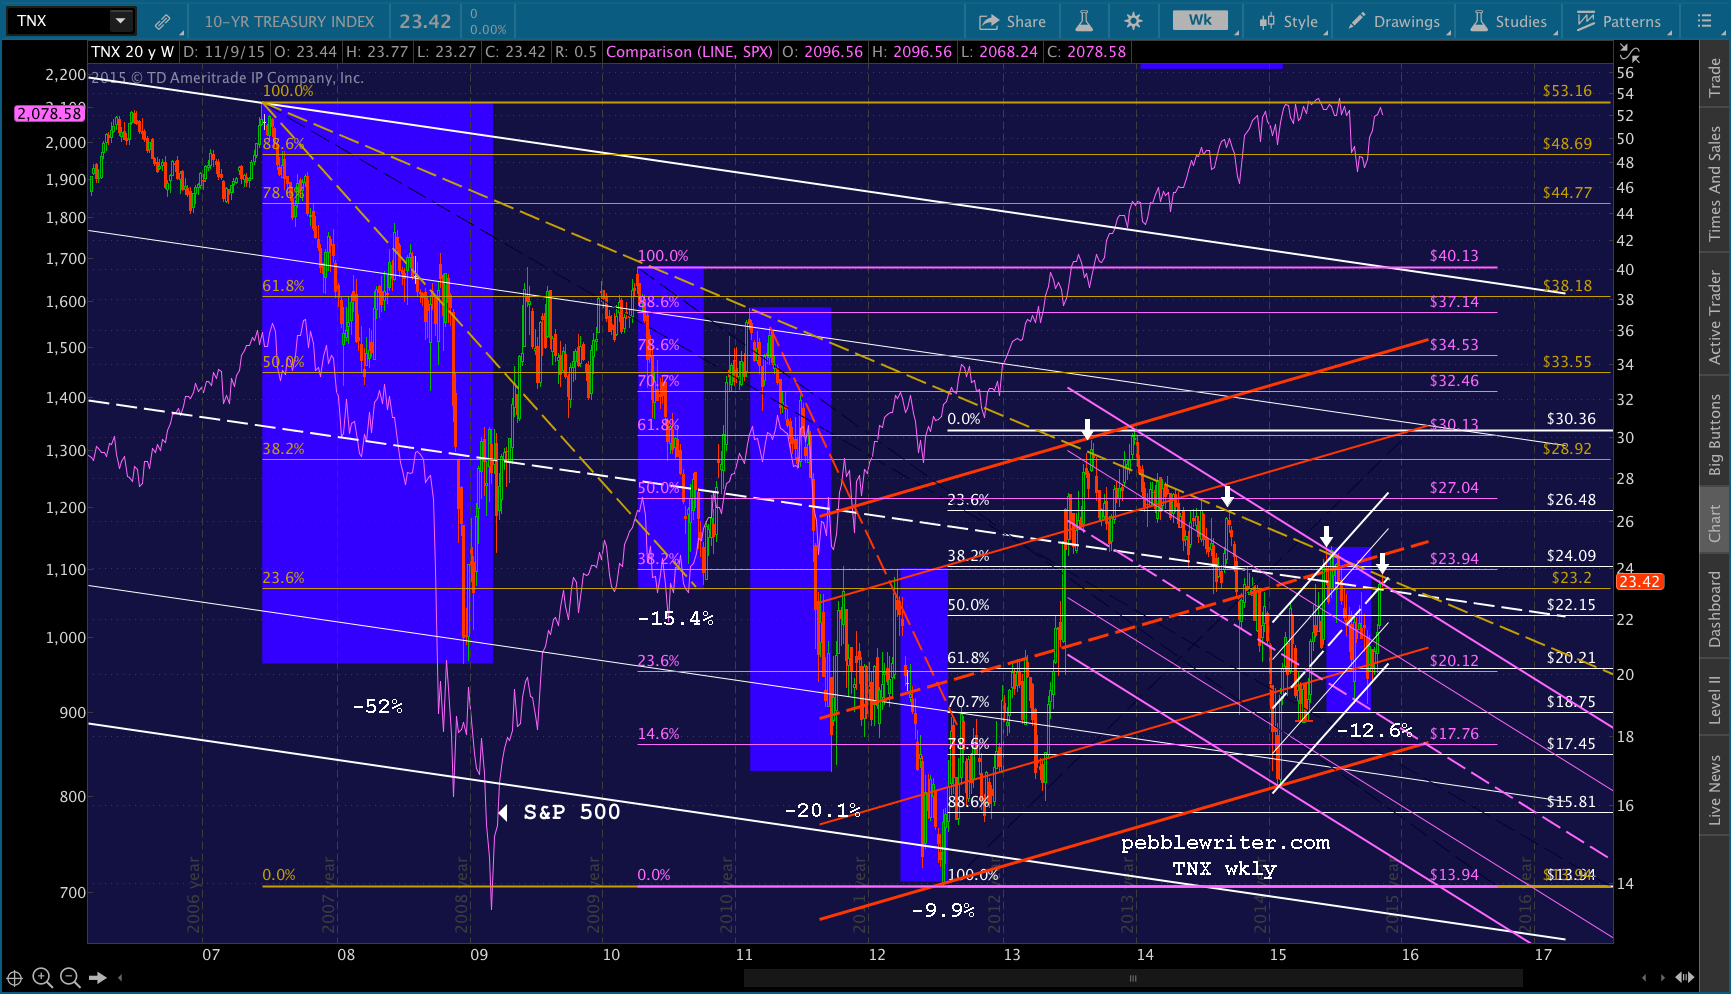 But, note that in Sep 2013 (1 – below), TNX’s decline was limited to the white midline. Thus, SPX’s decline was a minor 80 points — barely noticeable in the midst of a protracted rally.
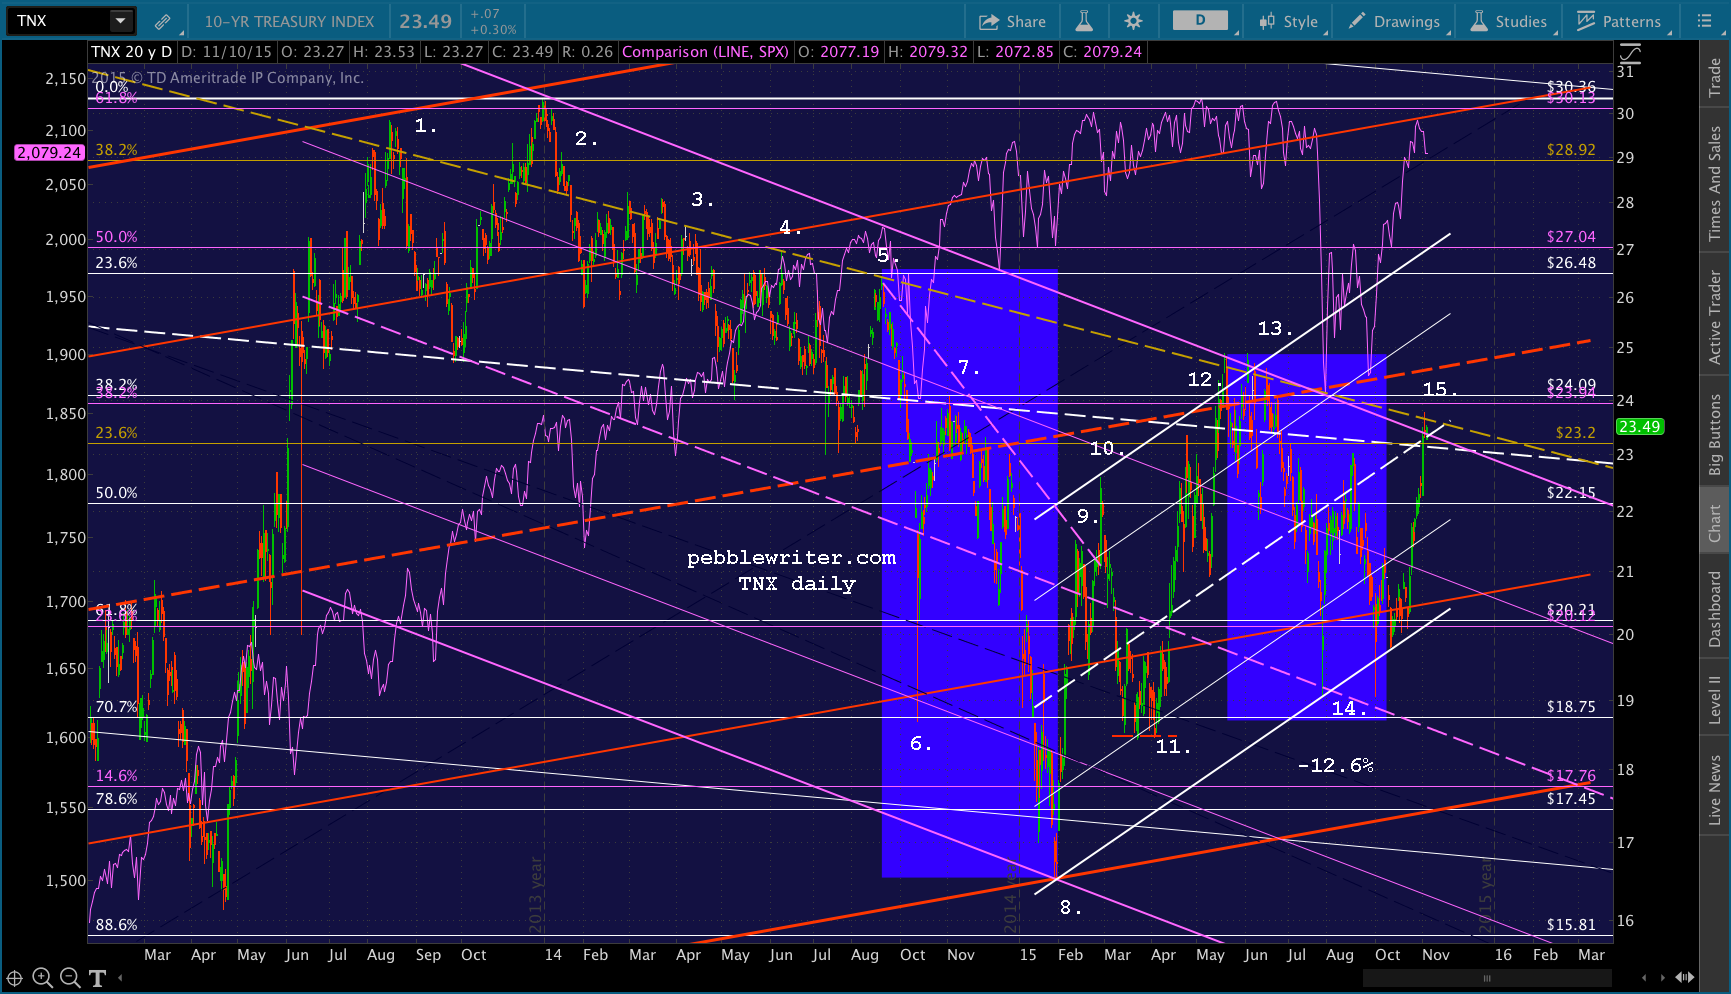 By December, TNX had not only recovered to the red TL, but popped above it (2.) Along with USDJPY breaking out, this helped enable SPX to bust through a key Fib level: the 1.272 extension at 1823.
TNX eventually fell back below the TL (3), but stayed very close to it as it declined. The next major decline was Oct 2014 (5), when it plunged well below the white midline but bounced back to it within a few days (Fed Pres. Bullard’s QE4 hints.) That SPX correction was, thus, limited to 200 points.
The speed at which TNX fell and then recovered had many fundamentally oriented analysts scratching their heads. But, examined in the context of algo-driven and manipulated markets, it makes a great deal of sense.
Even though TNX’s bounce faltered at the white midline again (7), SPX’s decline was limited to 100 points (and subsequent smaller plunges) by USDJPY and CL’s rallies. And, in March, TNX popped above the purple TL from Pt. 5 to drive SPX to new highs (10.)
The rally was short-lived, however, as TNX fell back to Oct 2014 levels – where it was propped up for almost a month (11.)
It recovered again to the red TL (12) where each failure to break out produced another mini-correction in SPX — which had by then climbed within 4 points of a huge Butterfly Pattern at 2138.
When TNX finally gave up the red TL (13) it marked the beginning of SPX’s latest correction. It eventually found support at the purple channel midline (14) and began the first of two bounces (not so coincidentally at 19.05 and 19.06) that have forced SPX back to the .886 retracement of its drop from 2134 to 1867 — the Bat Pattern completion I wrote about on Nov 3 [see: Beware the Bat.]
TNX is now back to the red TL — as well as the top of the falling purple channel and very slightly above the white channel midline. It’s clearly a pivotal moment TNX, as a reversal here would signal continued weakness and a push through it — even temporary, as in Dec 2013 — would signal a breakout for SPX.
The Fed has been talking about higher rates for a long time. The increases we’ve seen have been almost entirely the result of actual intervention in treasury futures as well as investors trying to get ahead of the expected increase.
For over 9 years, TNX has been a great gauge of fear, showing us clearly when equity money shifts to the safety of bonds. Over the past 3 years, however, it has gradually become yet another tool in the arsenal of the central planners by which to prop up stock prices.
Note that last Friday, when the NFP beat sent rates soaring, it very conveniently gave TNX the pop it needed to gap above the midlines of the rising white channel and a shorter-term rising red channel. And, for a few hours at least, TNX rose above the falling purple channel top — where it ran into the red TL from 2007.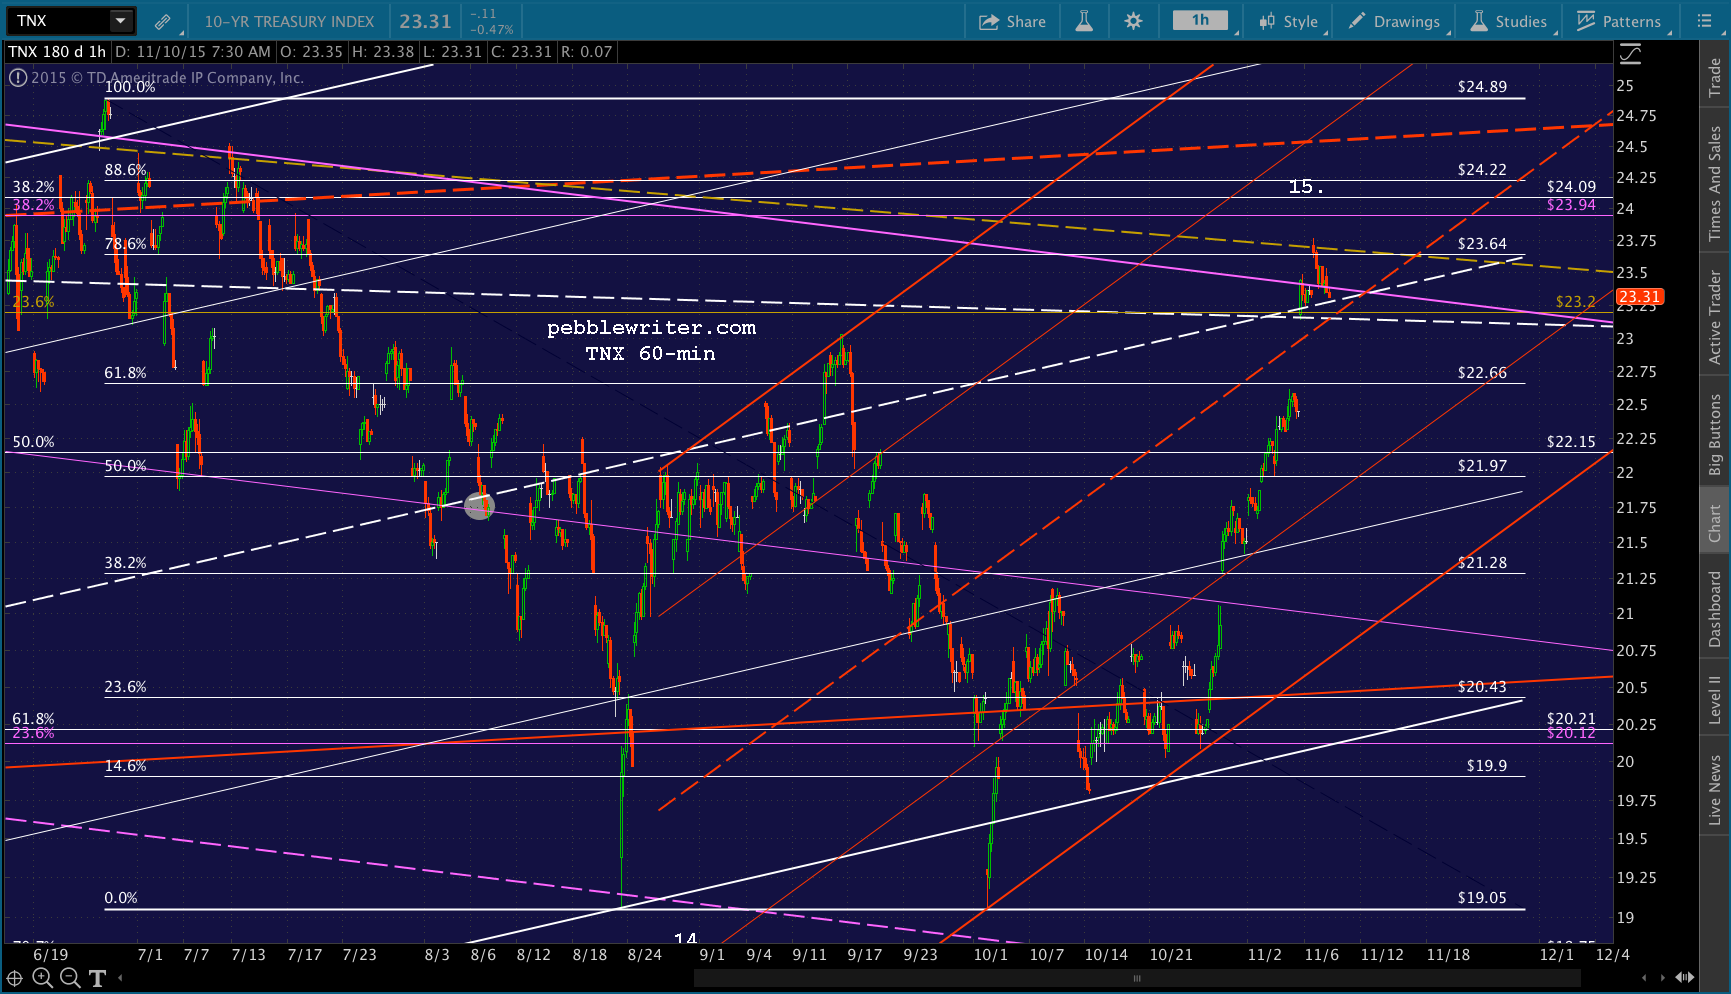 If SPX is to assault 2138 anytime soon, look for TNX to break out first.
UPDATE: 11:02 AM
The problem with reaching 2063 this morning isn’t so much USDJPY as it is CL – which keeps popping higher with every SPX decline.
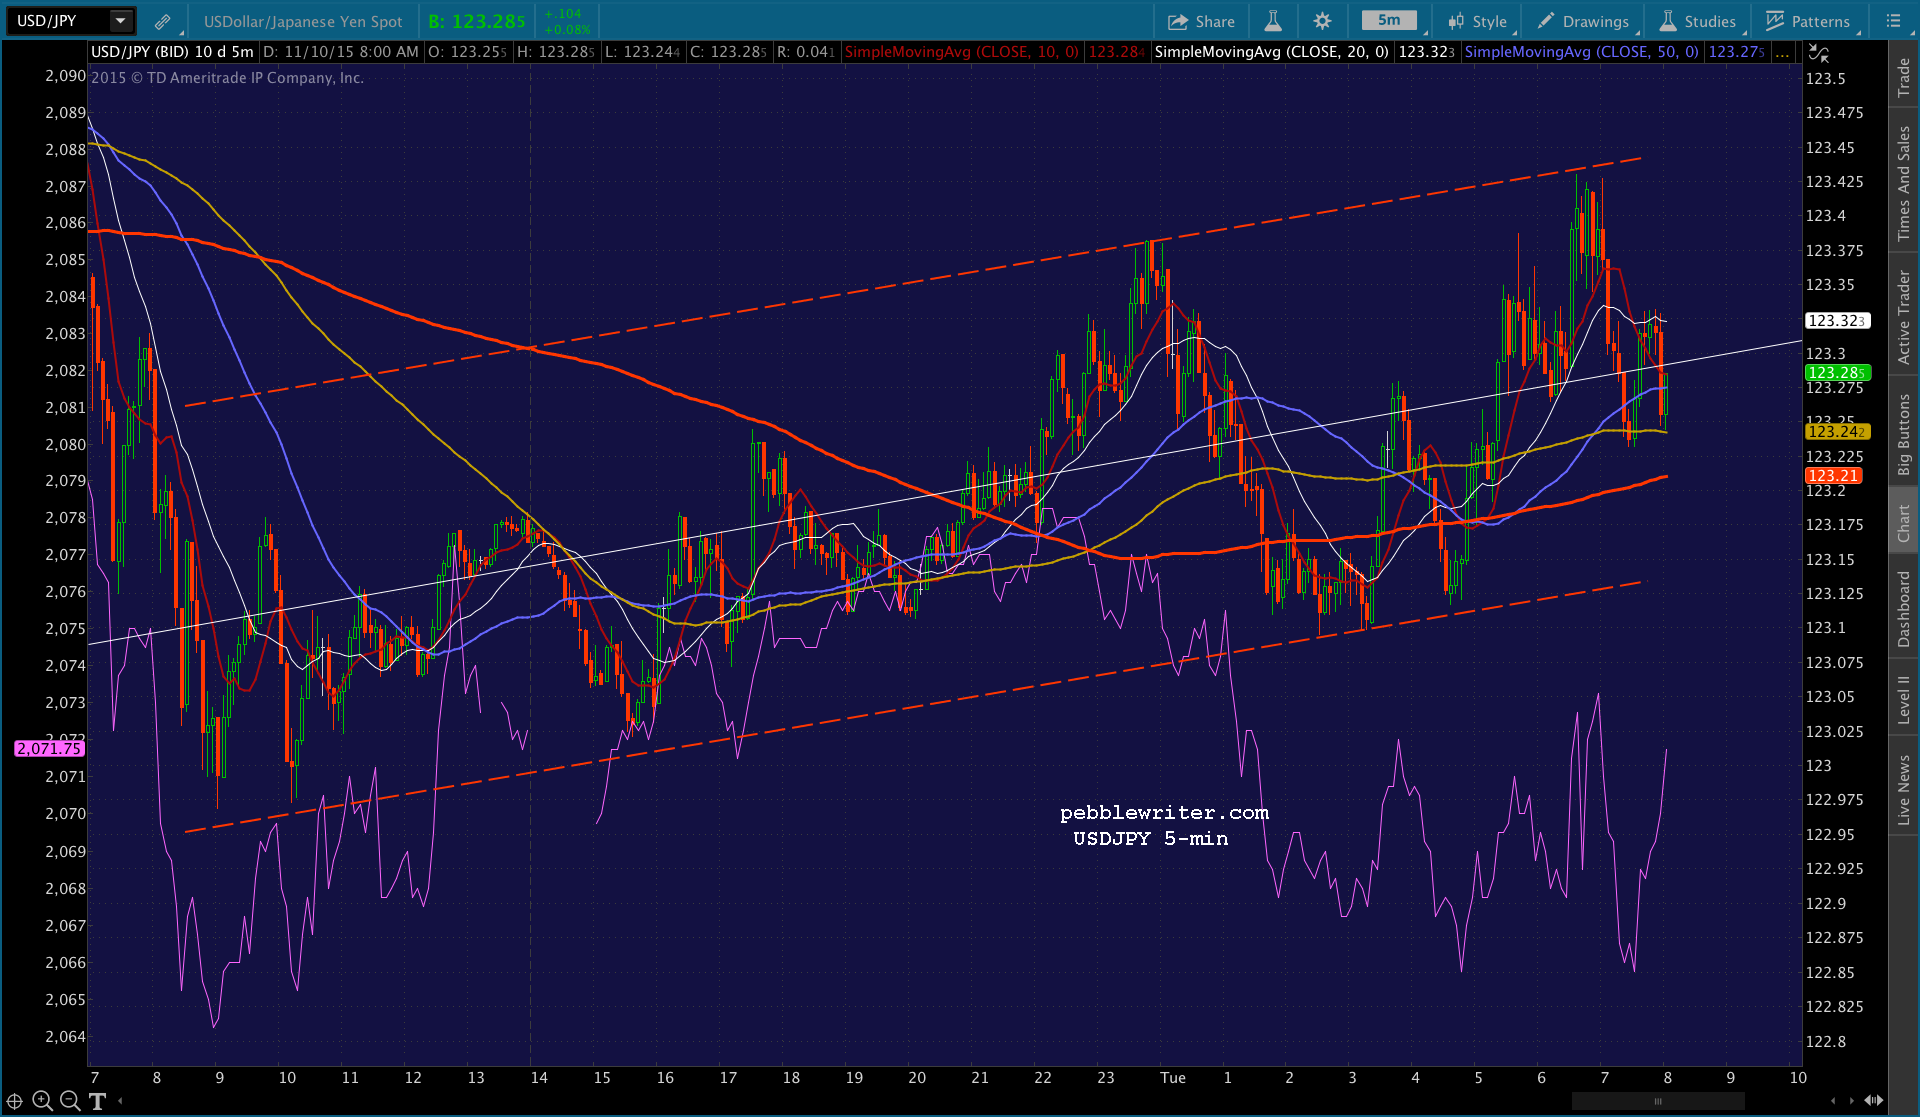
 In addition to the Flag Pattern on USDJPY, there’s a potential falling channel to which it might adhere. If so, the dip to 2063 could take a while.
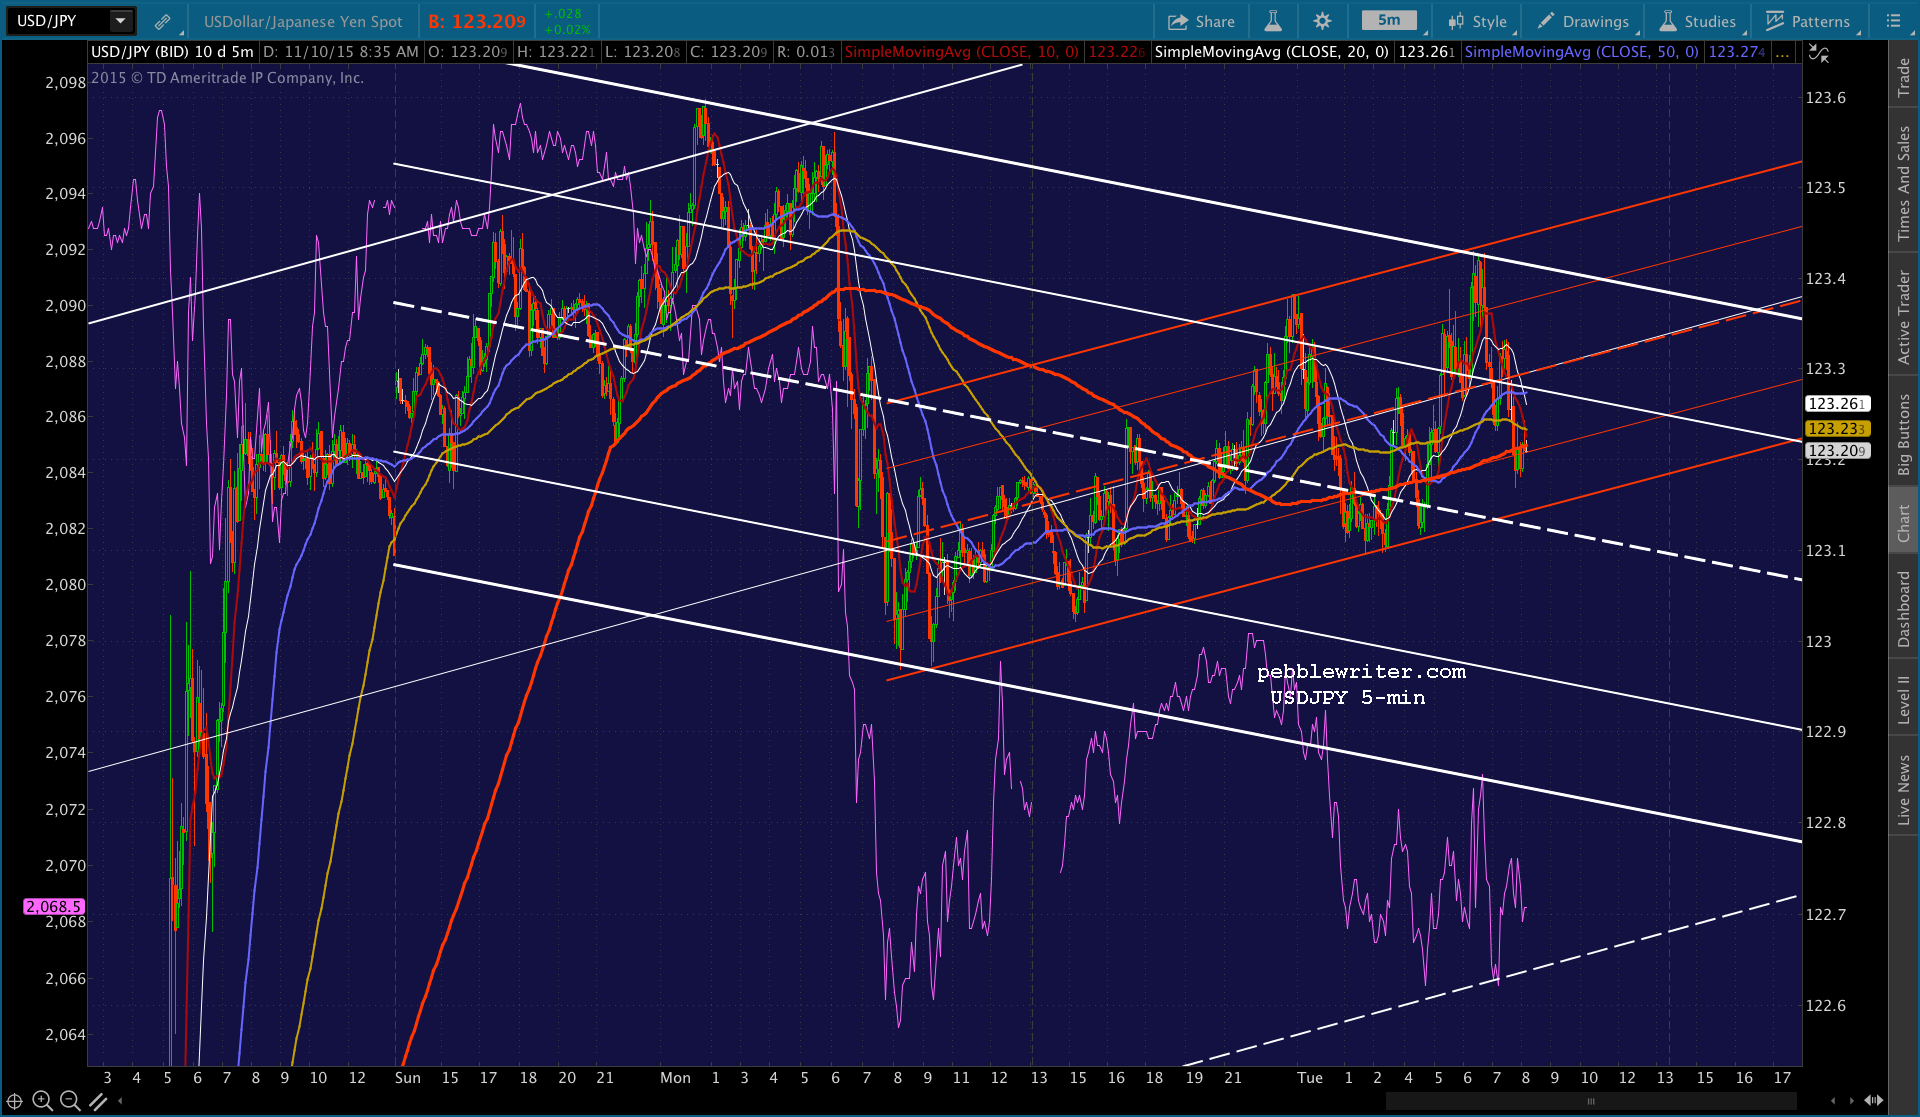 UPDATE: 12:18 PM
SPX continues to inch higher, driven primarily by CL algos. While we could get a reversal here at the white channel top, I’m not that confident of its placement. Odds are it’ll break out and rise to tag the SMA200 or higher, returning tomorrow to tag the SMA200.
The safe bet, if it does break out, is to close the short position and wait for its return or a reversal at 2083.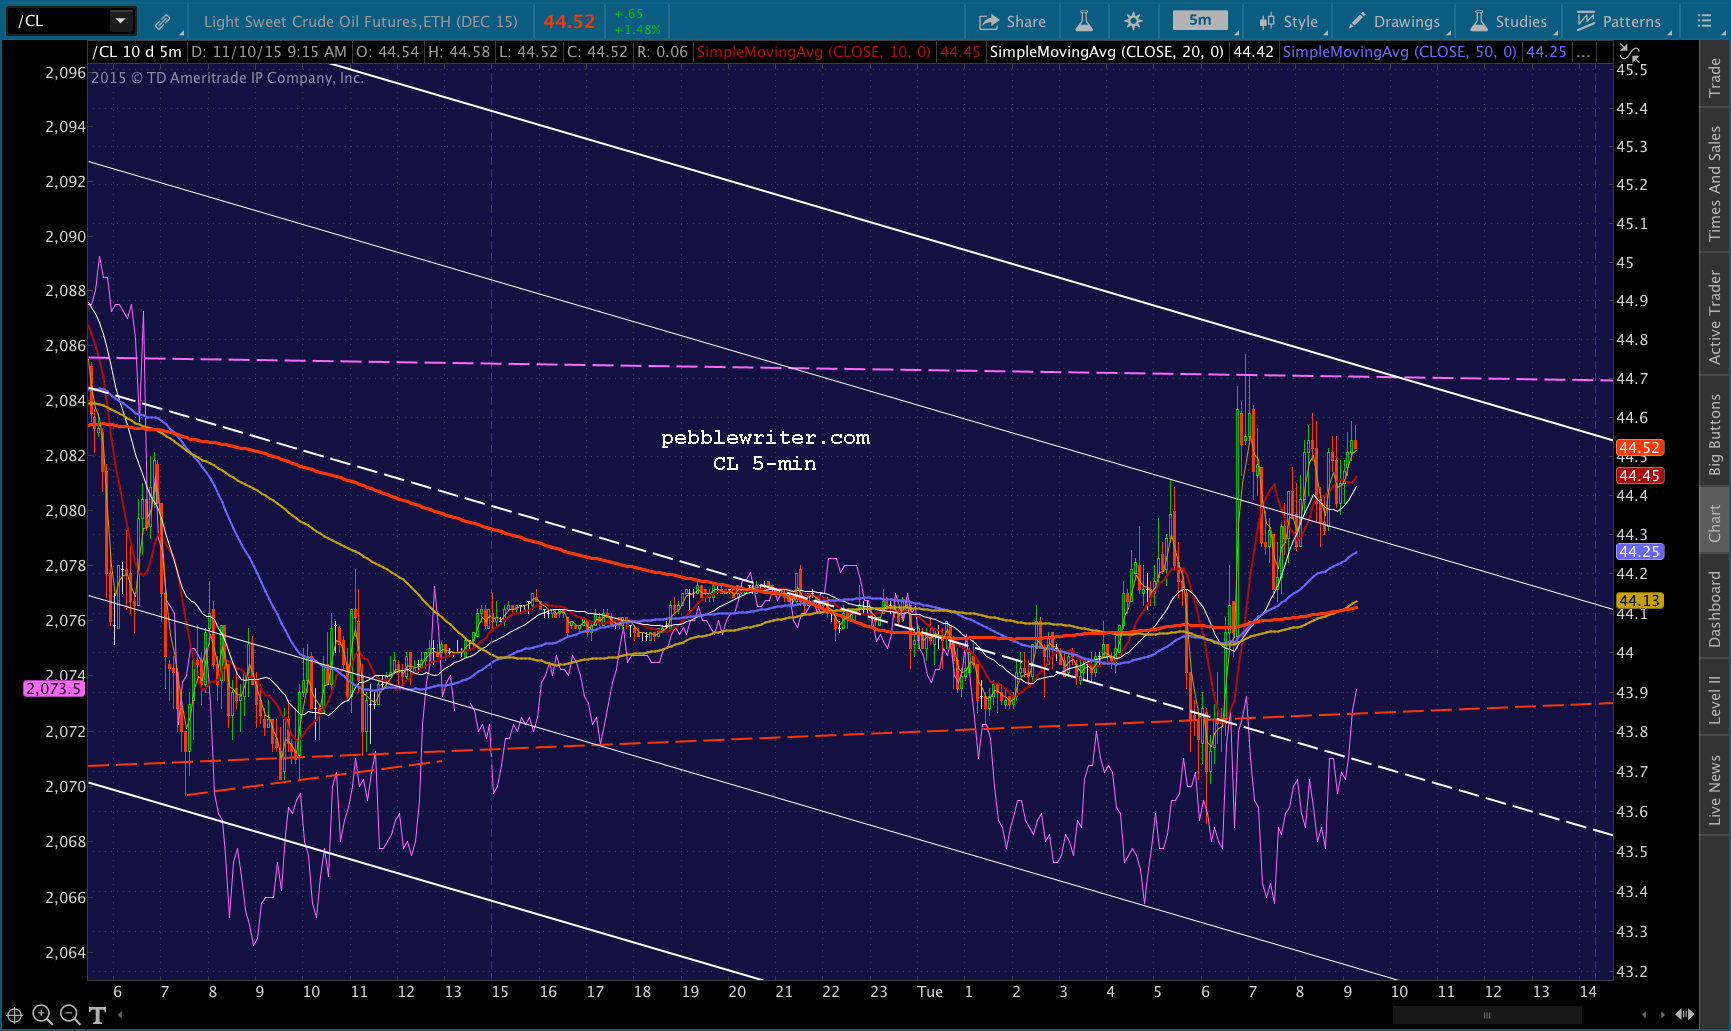
 UPDATE: 12:48 PM
Well, it didn’t break out. But, it hasn’t exactly broken down.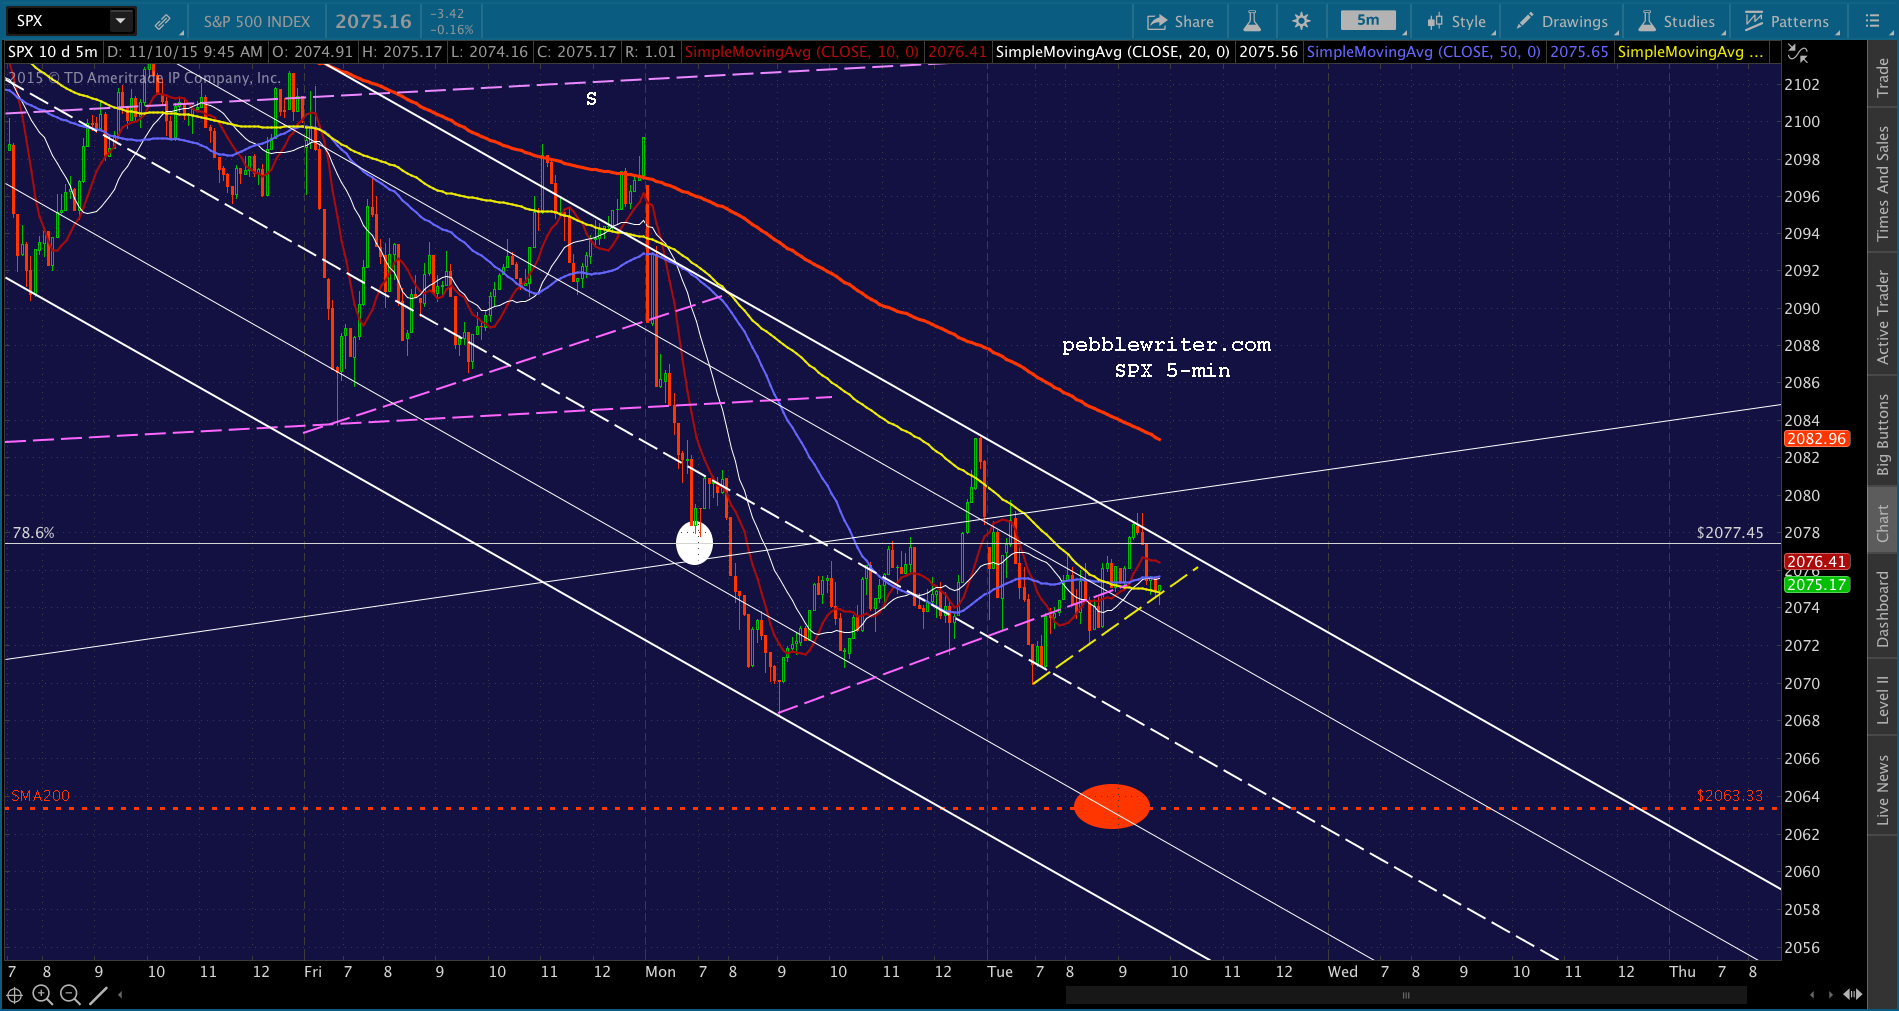 USDJPY, however, just made its first move below the Flag bottom.
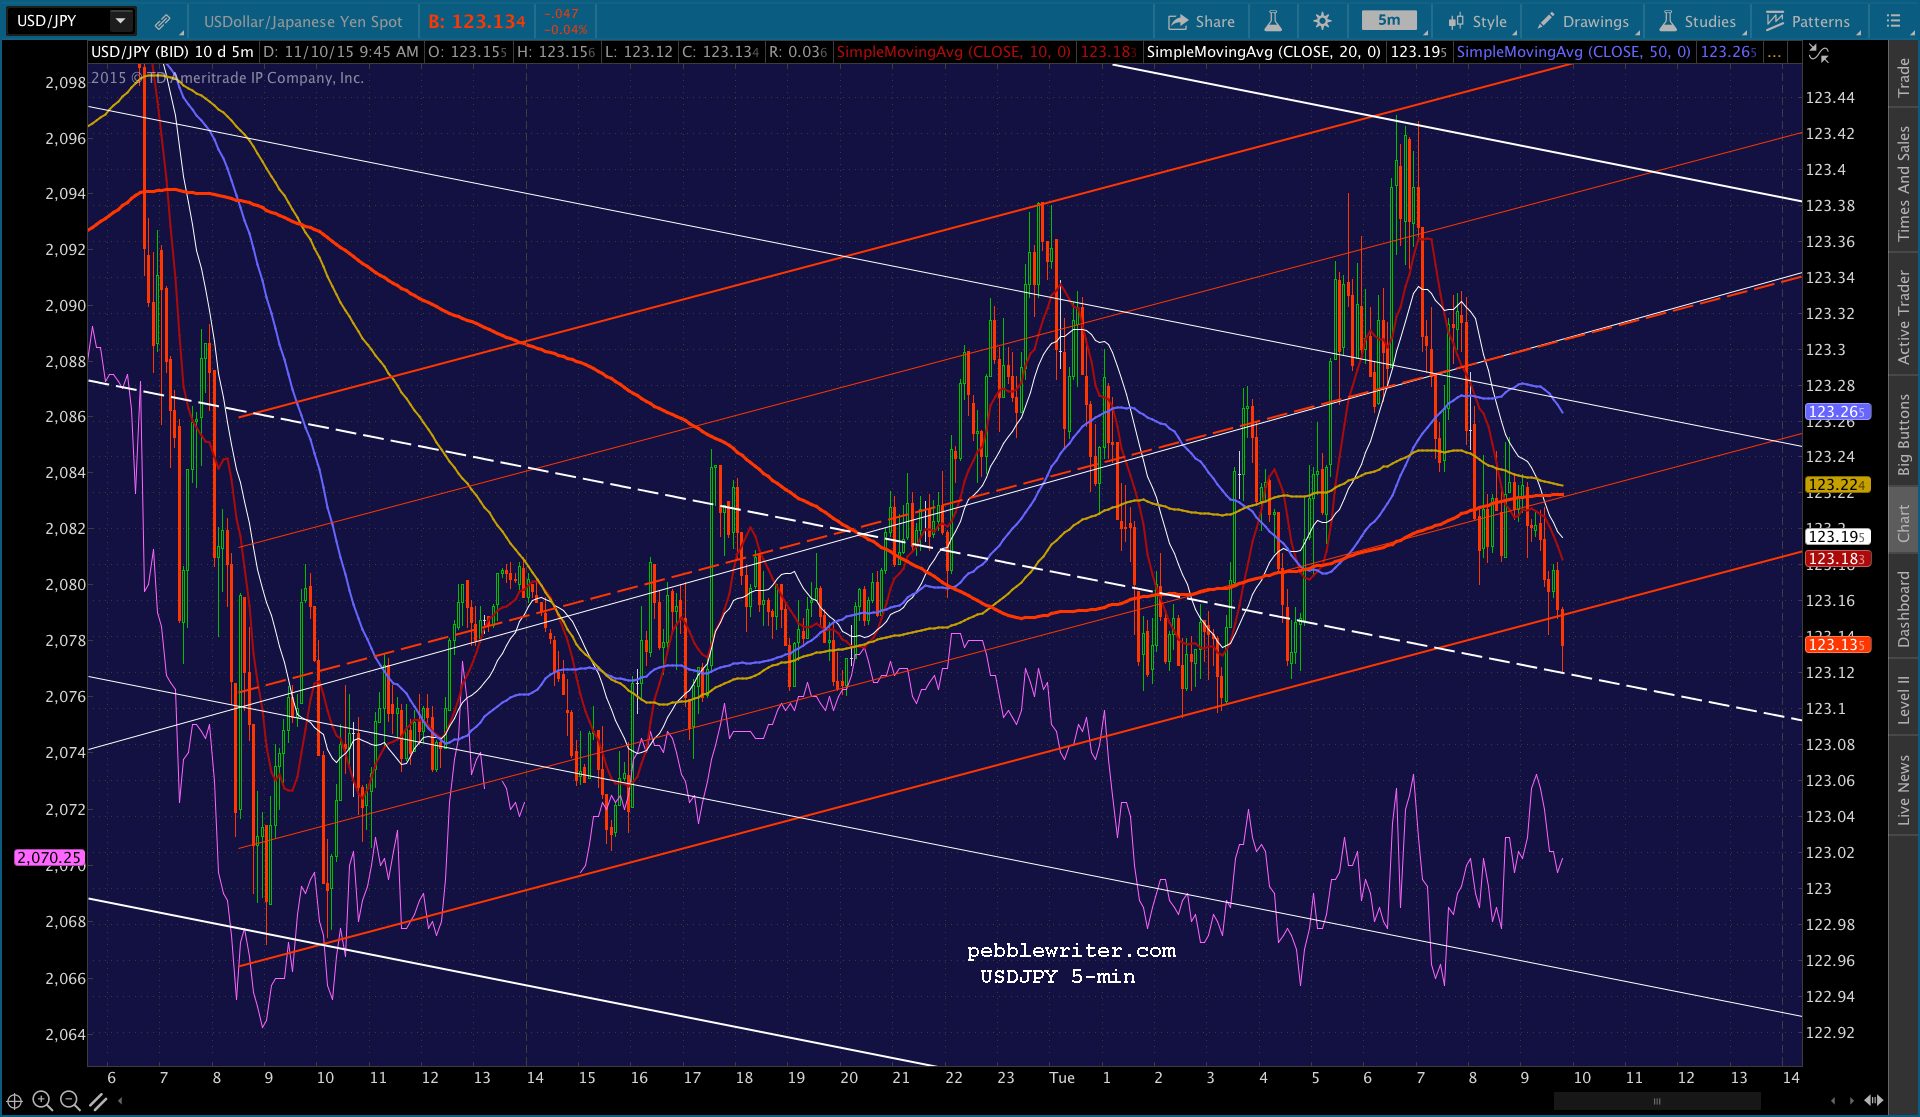
And, CL has at least backed off for now.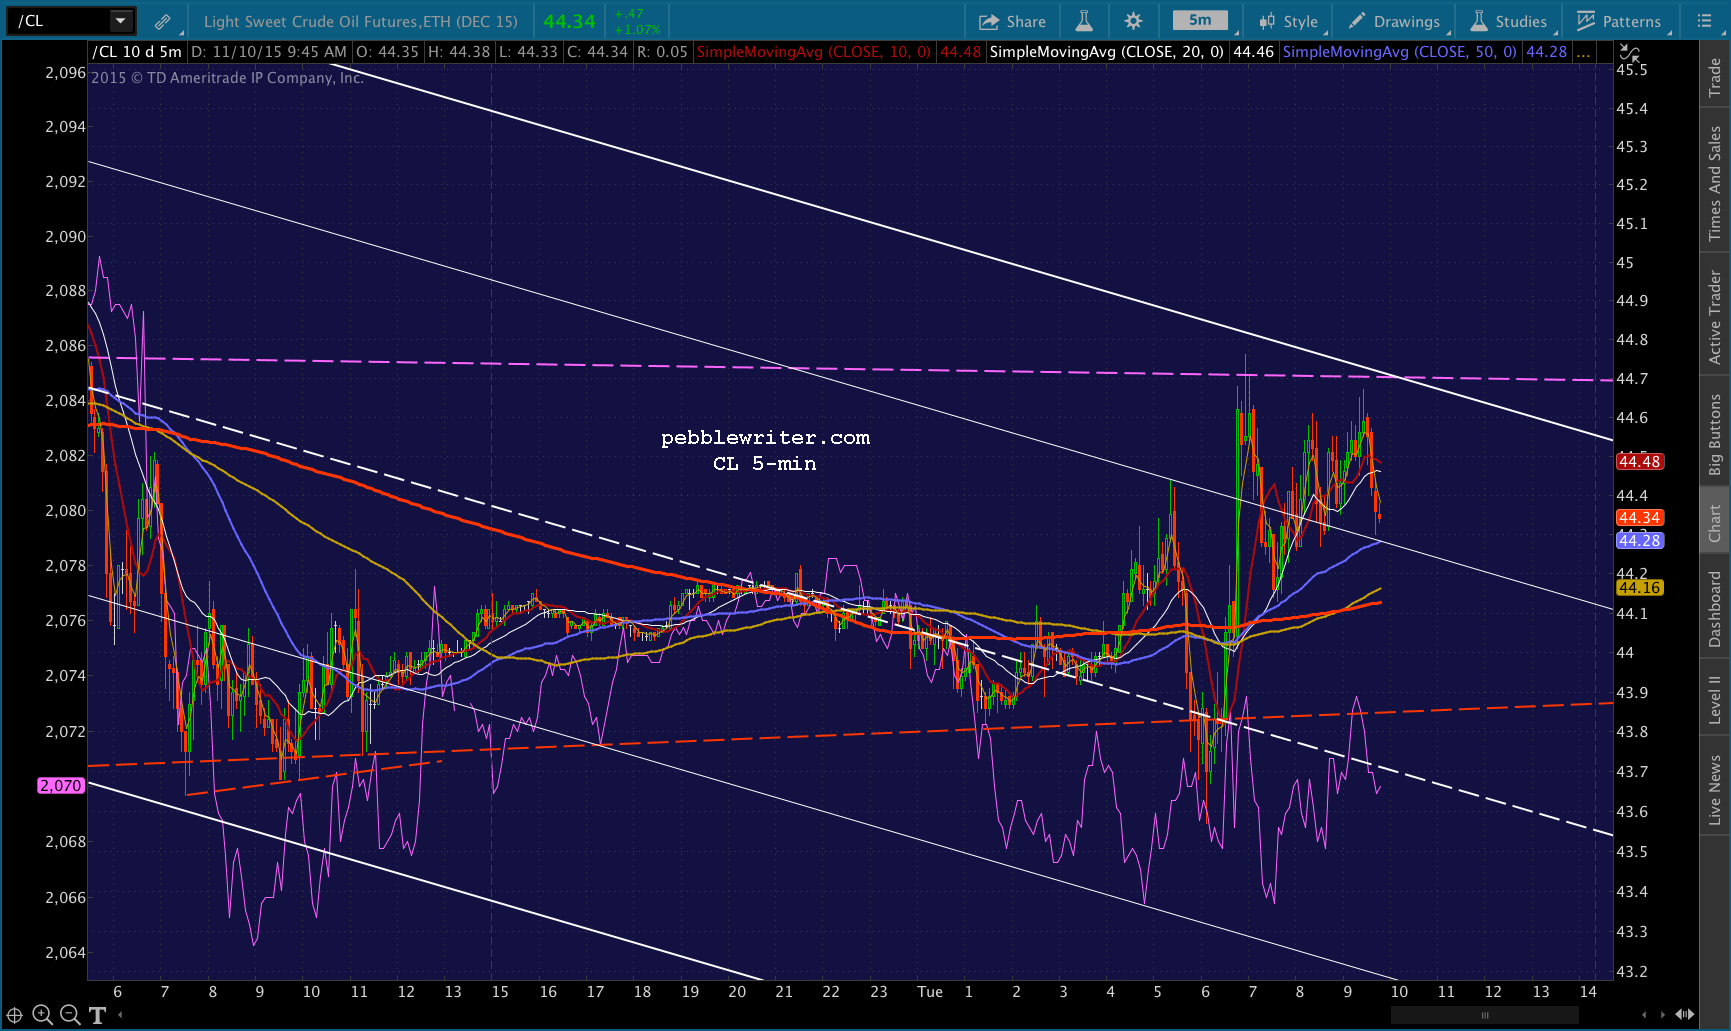 UPDATE: 1:13 PM
More of the same. USDJPY possibly backtesting the red Flag Pattern and CL has fallen to MA support.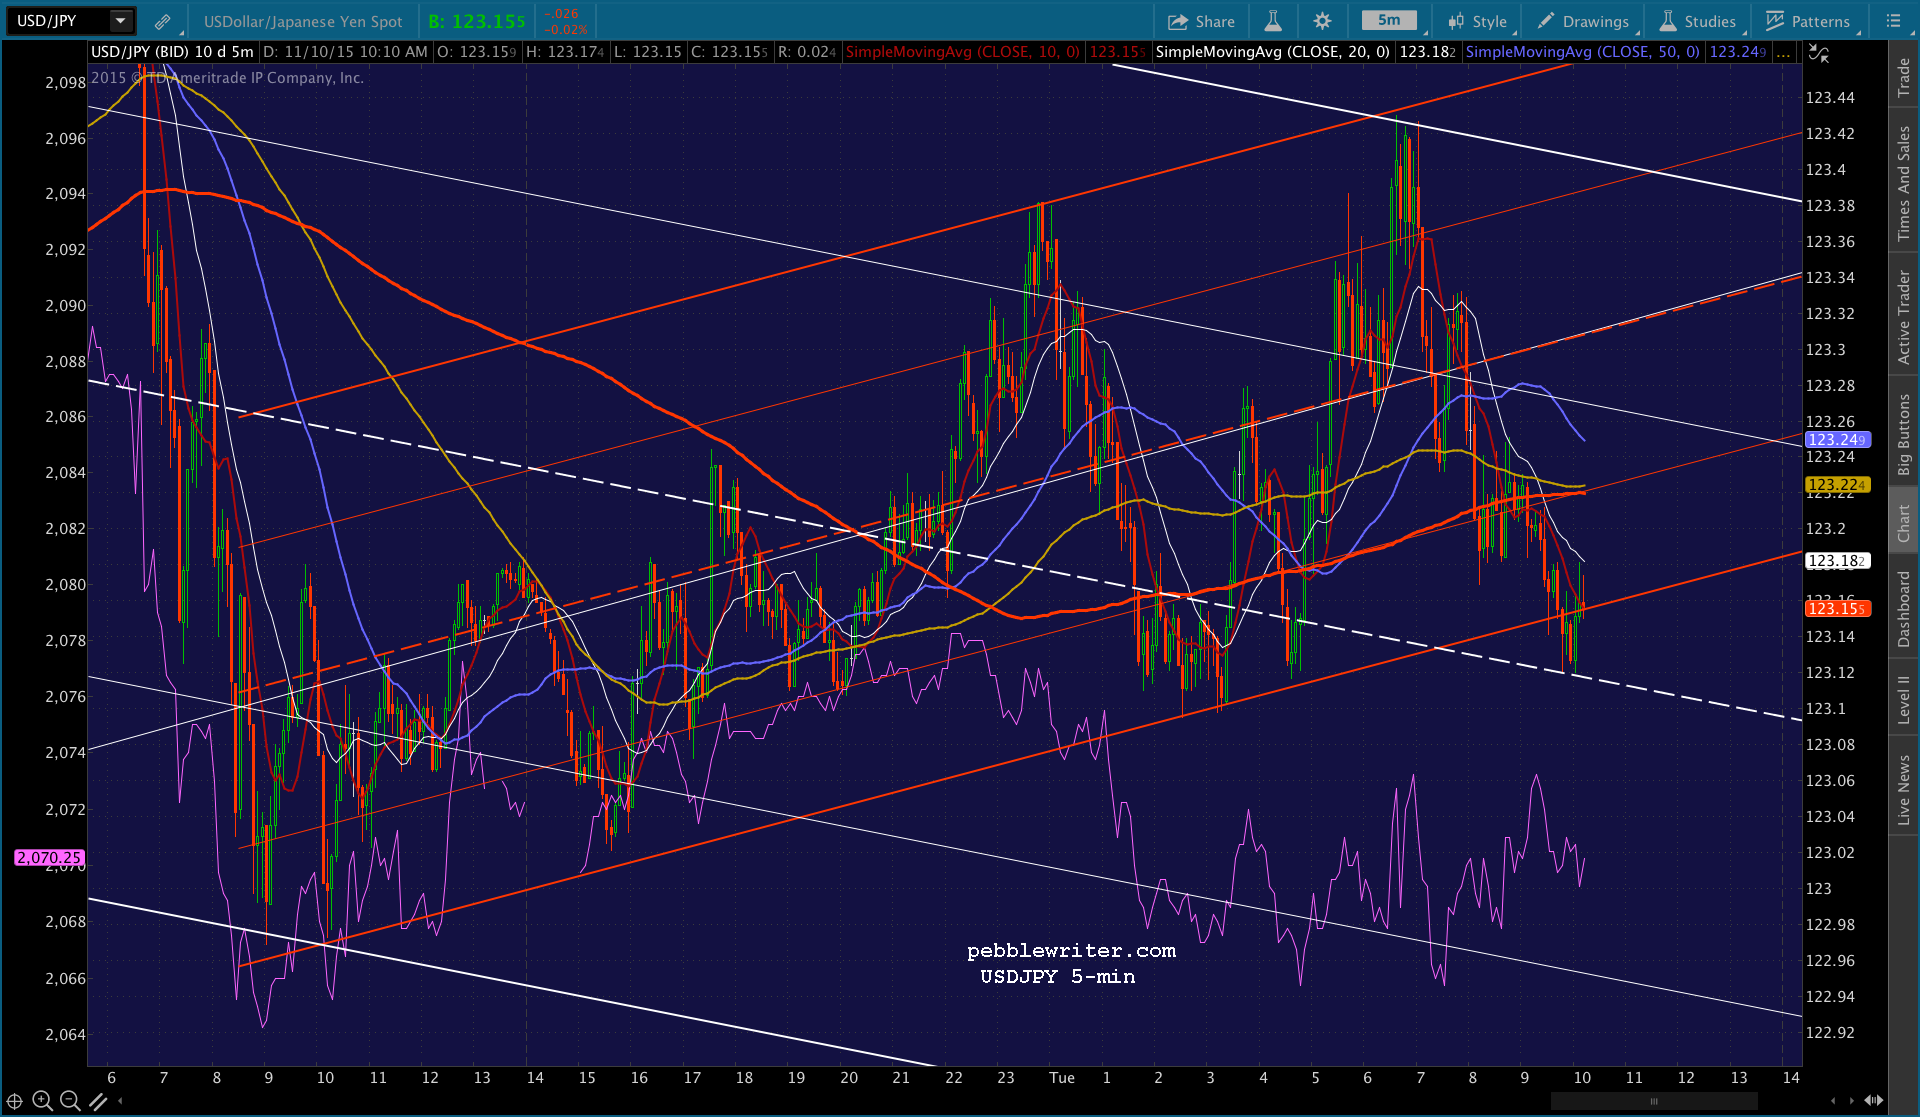
 SPX is backtesting another broken TL, but still hasn’t broken down. Hard to force traders to sell when the SMA200 is right there waiting to provide support. It’s going to take something more dramatic than we’ve seen from USDJPY and CL so far.
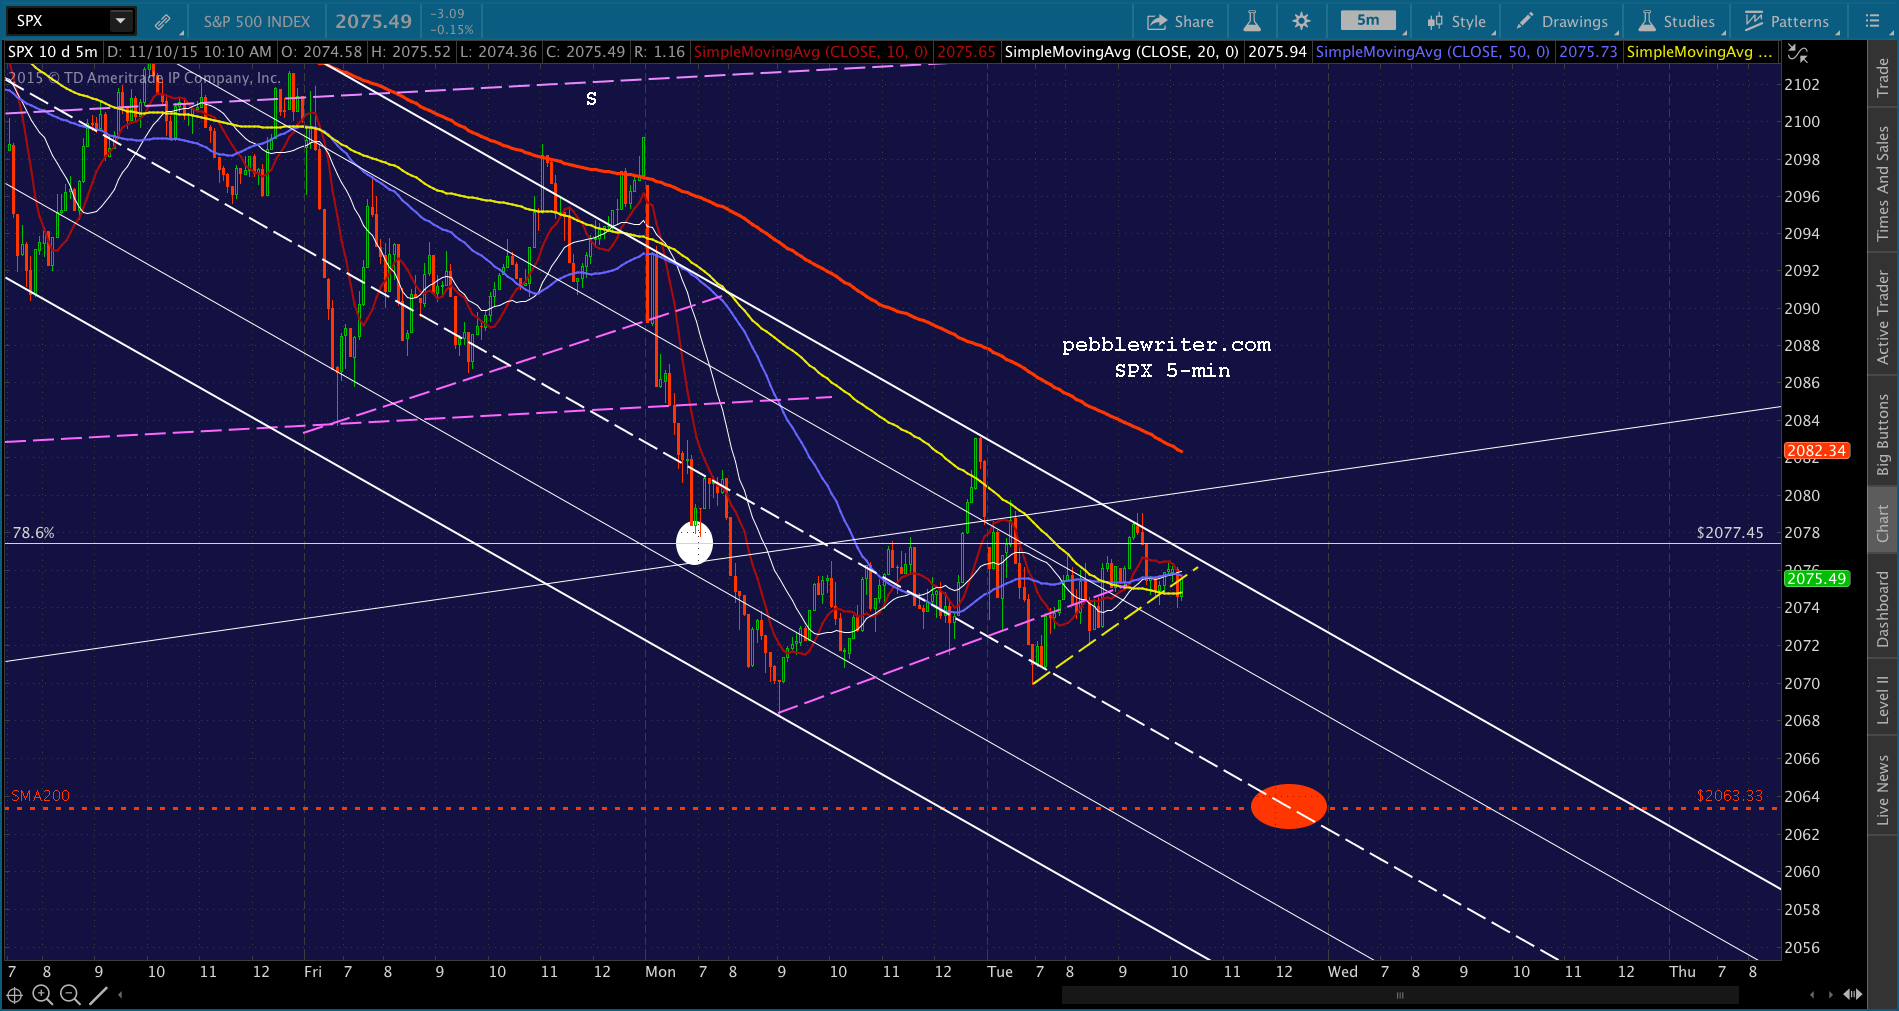 UPDATE: 1:26 PM
USDJPY making some progress now. We’ll see how it does at horizontal support: 122.969.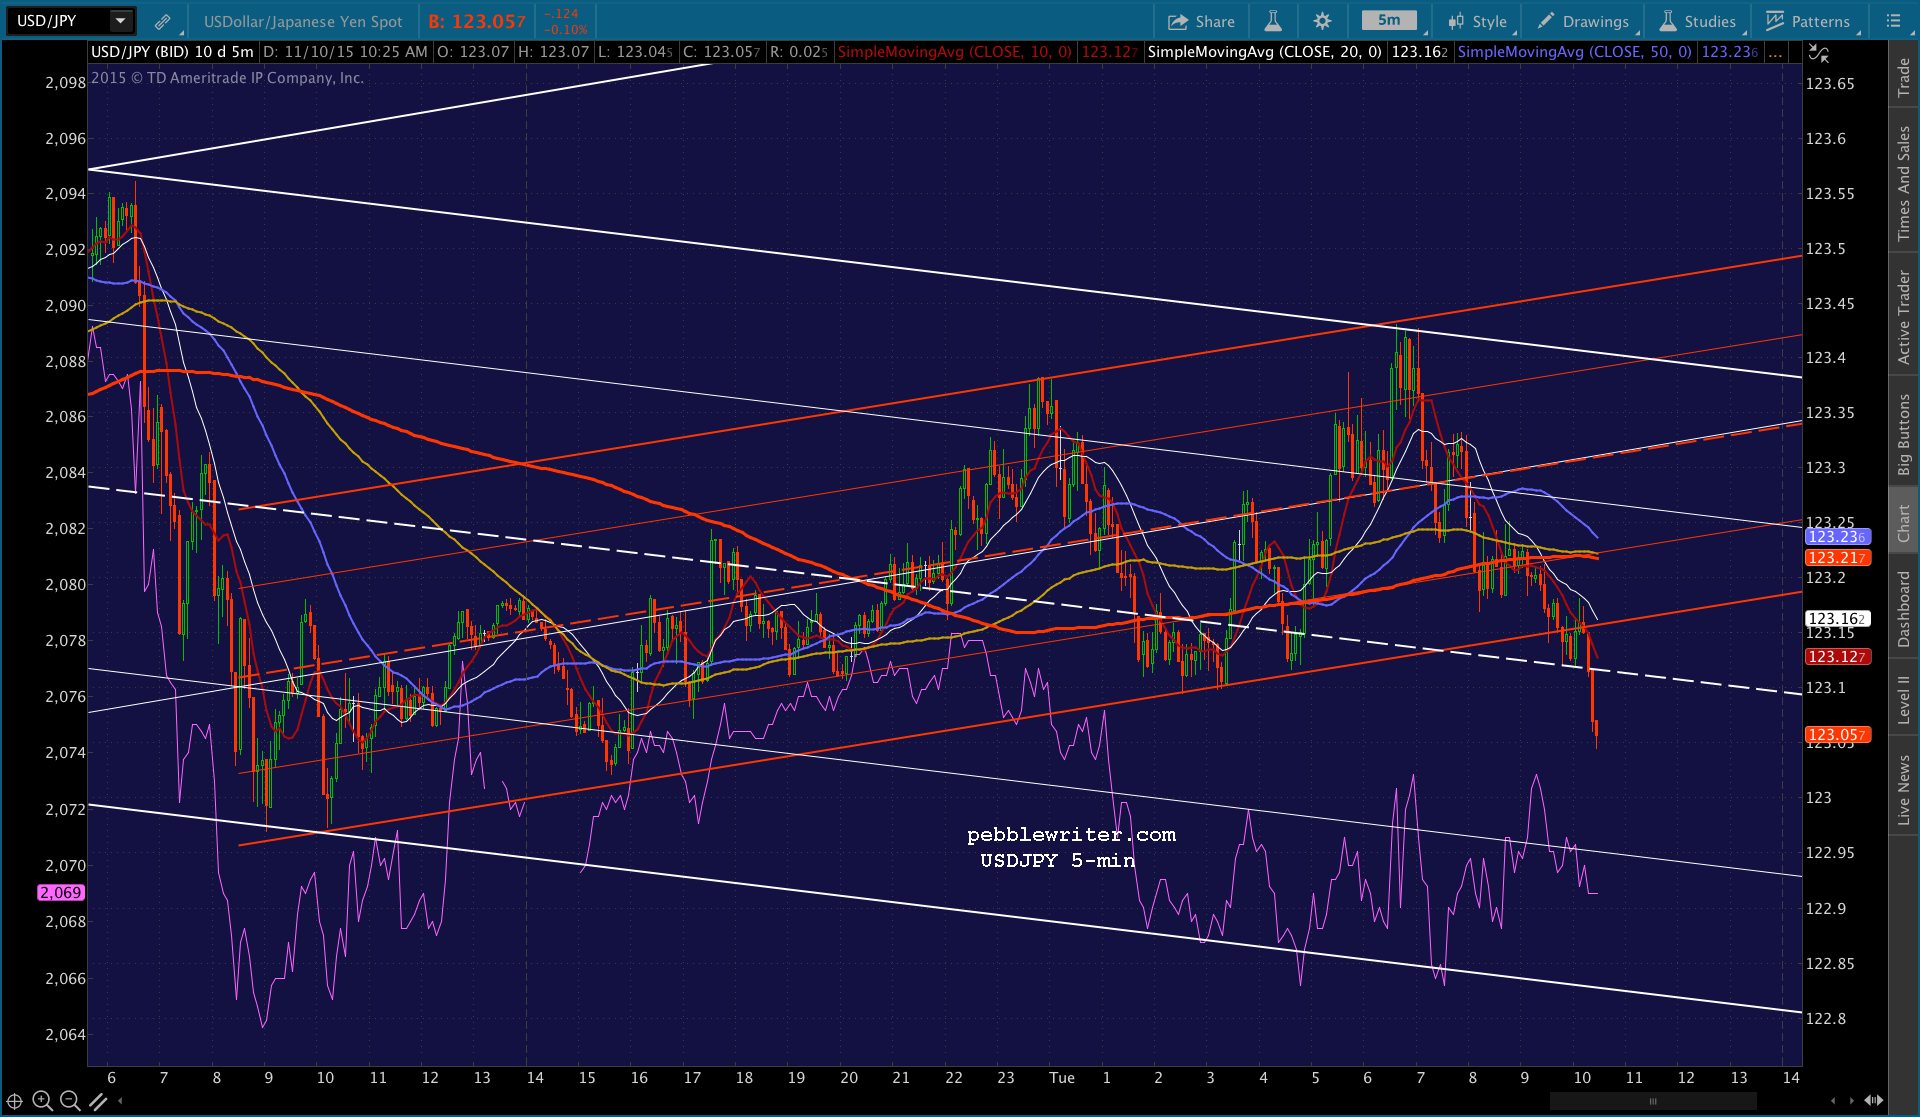 If it reaches the next channel line down, it will have broken horizontal support.
UPDATE: 2:02 PM
SPX just broke out of the falling white channel as it almost did earlier, primarily on USDJPY’s more aggressive backtest and rise back above the white midline and CL’s bounce off the SMAs.
This confirms to me that they’re either going to allow the 2063 tag at the close or on a gap down tomorrow. Same advise as before: either close the short and reopen it later, or ride it out. My inclination is to ride it out, unless something whacky happens – like USDJPY suddenly spiking higher or CL breaking out. Even then, those would likely be head fakes.
Obviously, it could close above the 5-min SMA200 as it did last Friday and gap down the following morning, which would be the toughest call to make.