

There’s no Fibonacci argument for lower prices in SPX at the present time; but, the fact that the USD remains stuck at the inflection point we discussed last week suggests this corrective move down from 2011 isn’t yet complete.

Recall that the .886 Fib is a larger scale reversal point that coincides with a channel midline that has been quite effective in the past.

The correlation between SPX and DX has oscillated significantly over the years.

But, given that much of the equity strength since Oct 2011 has been based on USDJPY strength (yen weakness), I think this bears watching.

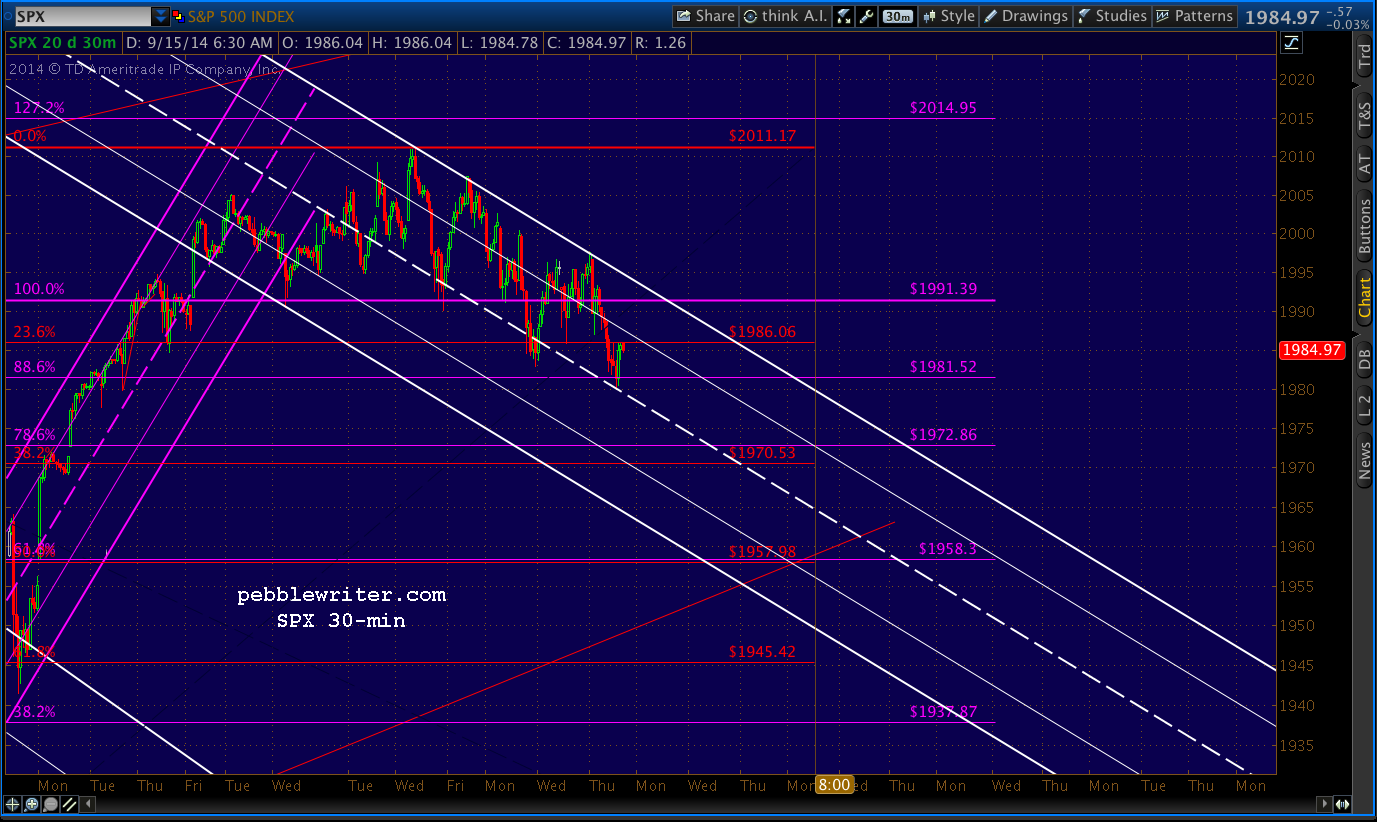
SPX has two moving averages that happen to coincide with significant Fib levels. I tend to think the current corrective movement will seek one of these targets.
continued for members…
The intersection of the red .382, purple .786 and SMA50 at 1970-1972 looks very likely to me. And, if that level doesn’t hold, the SMA100 should intersect the purple .618/red .500 later in the month — with the red .618 the next lower target, depending on timing.

Like most of the declines over the past year, this one has a very “manufactured” look to it.
GLTA