The holding pattern continues. Futures levitated overnight to the gently falling 10-day moving average yet again.  And, yet again, VIX provided the precise guidance the algos required.
 The longer this goes on, the more we begin to resemble the Nikkei, with preset moves prescribed by a central bank: support and resistance predetermined by committee. It makes charting easier, but it strains credulity to even call it a market.
Nowhere is this as obvious as in WTI, which has traded in an ever narrowing range since its miraculous recovery in April and May. Note the tilting trend lines of support. We place downside targets on the chart to represent not our actual expectations, but to indicate where prices might drop if the bankers were to lose control. RBOB futures have done the exact same thing, also ignoring such trivial issues as supply and demand or geopolitical developments.
  Fortunately, the FOMC concludes their meeting today and the motivation for the current holding pattern will pass. Until next time…
continued for members…
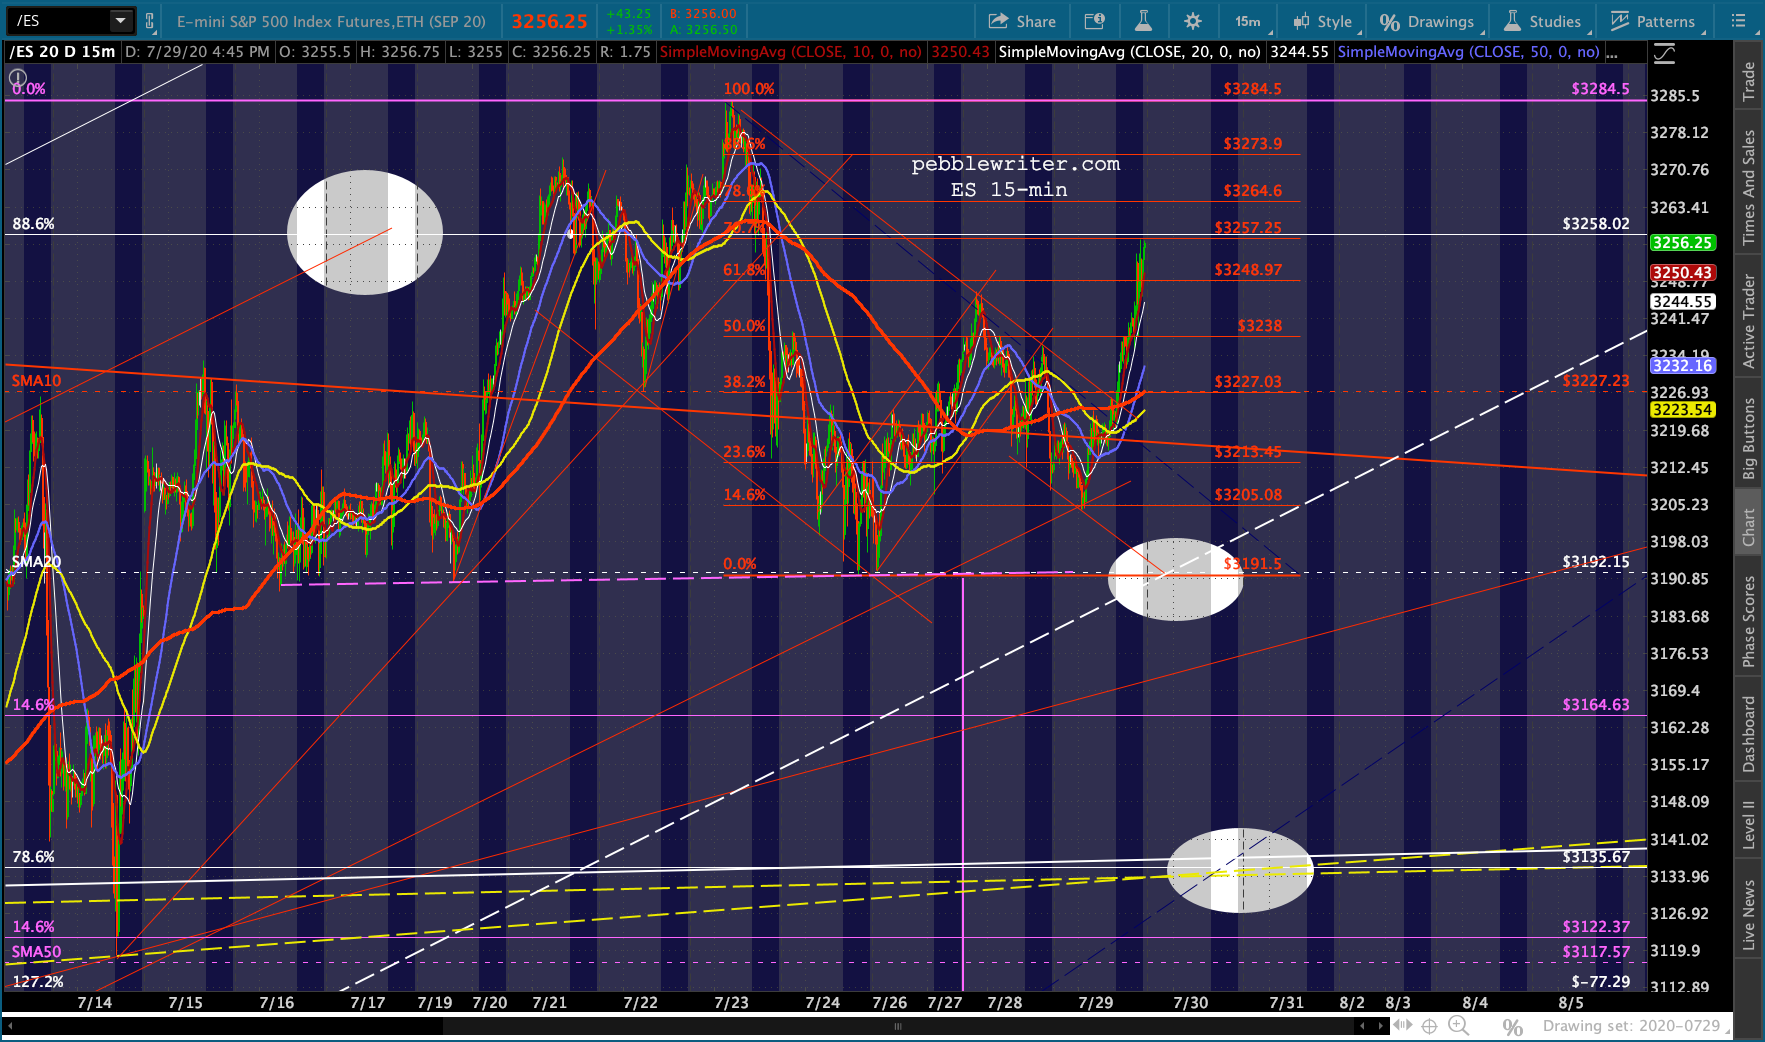
The bigger picture shows ES still has a potential H&S Pattern to complete. The target is most of the way to the 2.618 Fib at 3076.


 Note that by drawing out this sideways move, the bottom of the rising white channel could be tagged with a relatively minor correction of 5.7% from current prices between now and Aug 11 or so.
 The only moves of any consequence continue to be in currencies. USDJPY continues to ease lower, strongly suggesting more sharp drops ahead – typically indicative of dollar and equity weakness.
  This will potentially reverse at the white channel bottom – the .786 or .886 – to offset a reversal of the EURUSD, presumably at or about our 1.1820 target.
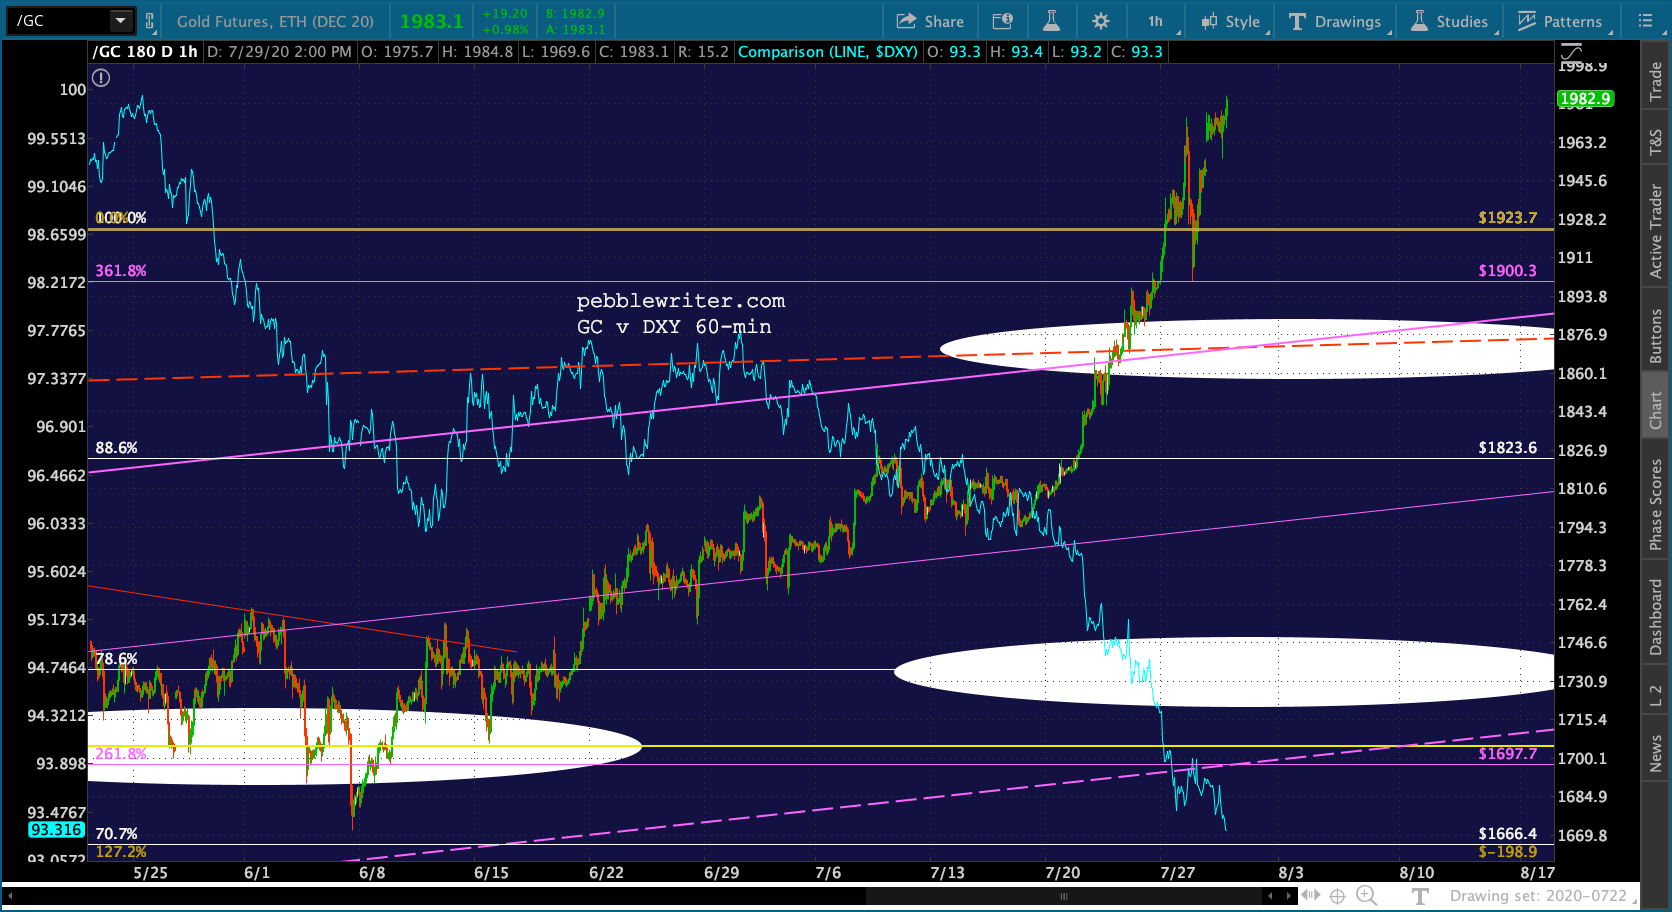
 This, in turn, would allow DXY to tag the white channel midline, ideally at the .786 shown below…
 …which at least partially explains GC’s continued levitation.
  It certainly isn’t being driven by changes in interest rates.
 I’ve been posting this chart for a very long time without even minor changes.
 The closeup, however, reveals that push has come to shove. The very slow price gains either continue to new highs or break down below a TL dating back to December.
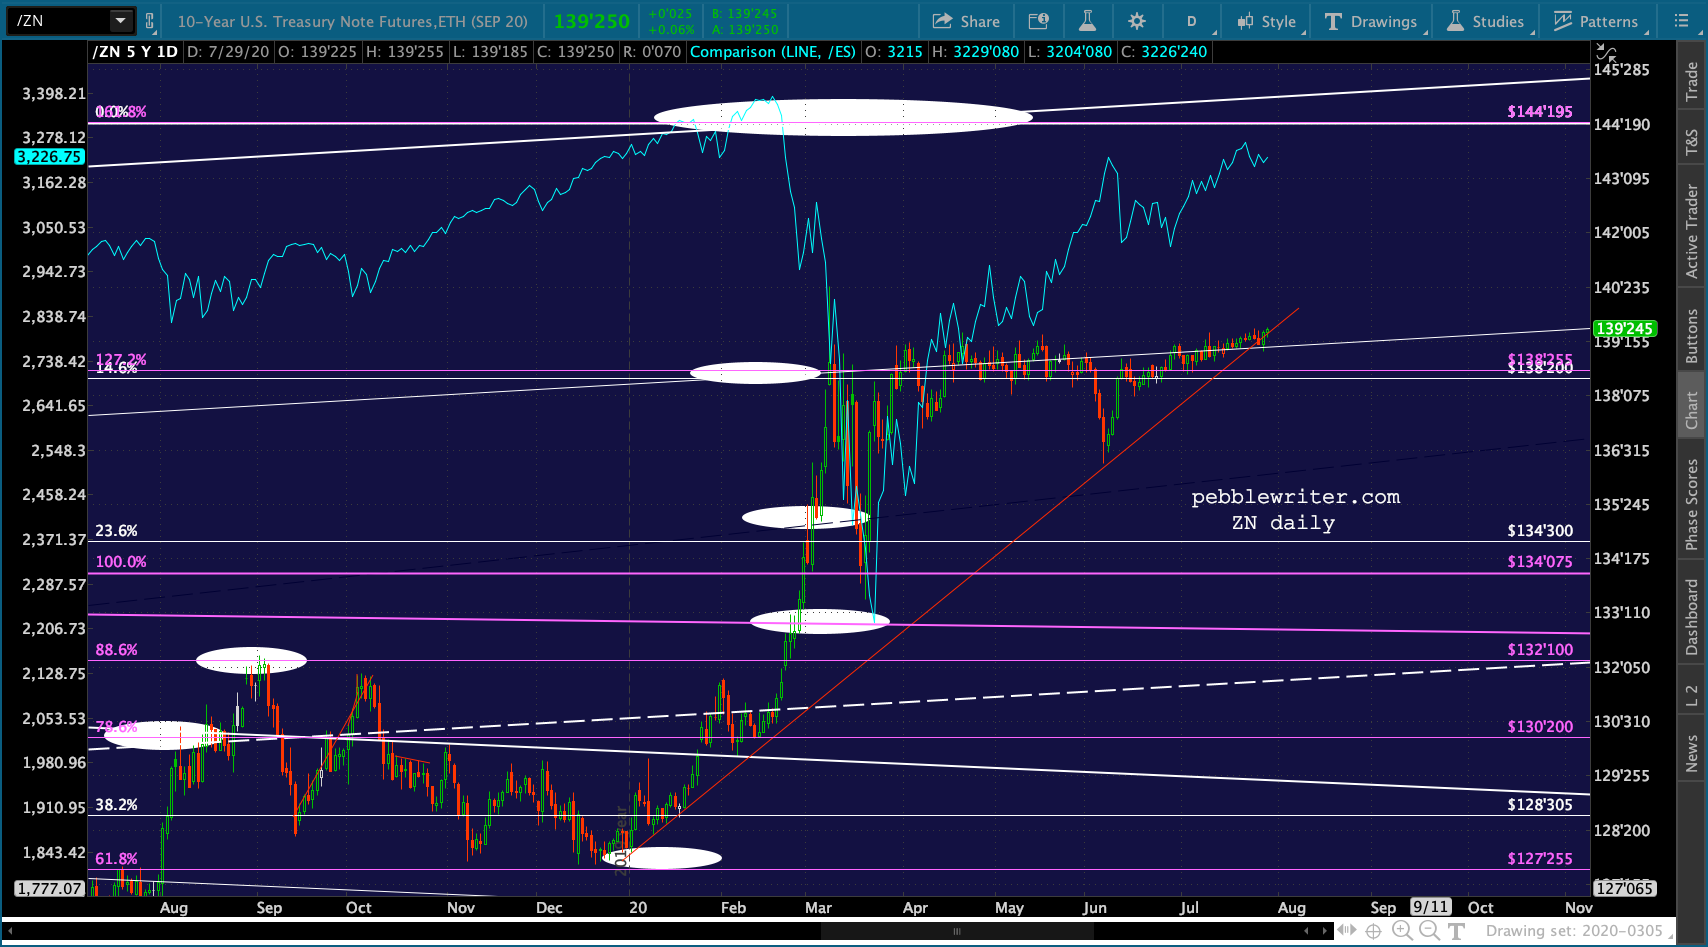 Such a breakdown would be consequential, as we saw during the near breakdown in June when TNX shot up from 0.64% to 0.95%. We know the Fed/Tsy can’t afford higher rates, so the trick is to figure out how they’ll accomplish it – other than buying up every issuance.
  I have to zip out for an appointment. Should be back around 1PM or so.
GLTA.
UPDATE: 2:15 PM
The FOMC’s statement is essentially a non-event. We’ll see how Powell handles the presser.
 So far, the biggest reaction is a continued drop in DXY/USDJPY and rise in EURUSD and GC…


 …a breakdown in RB (but not CL)…
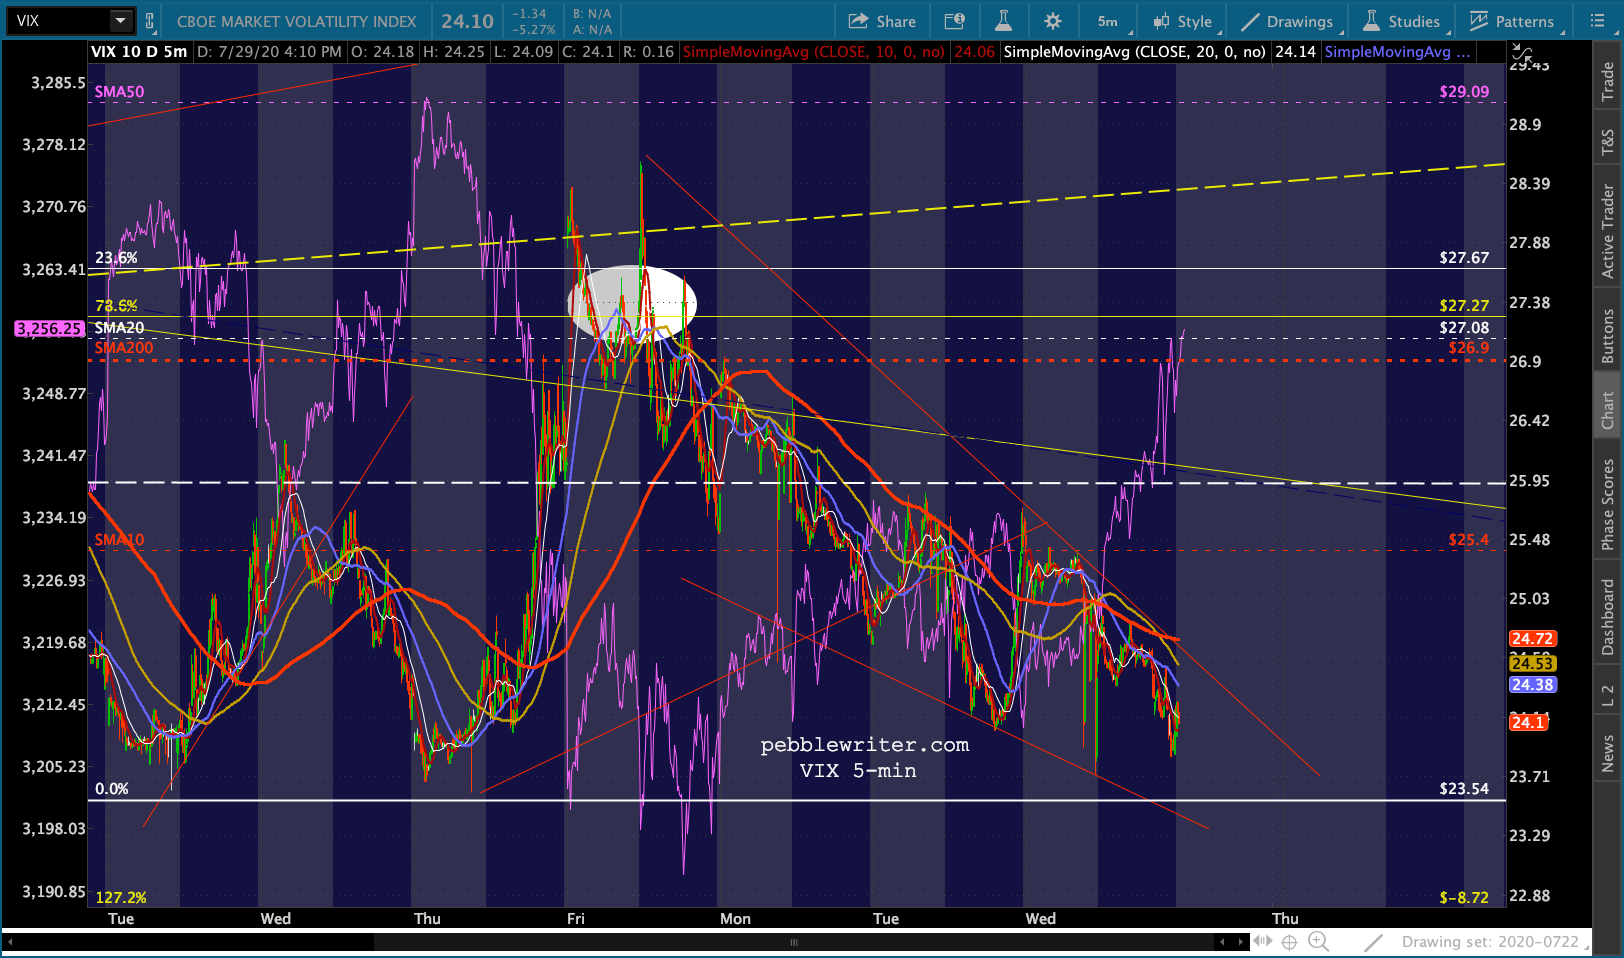
 …and a small additional drop in VIX to help stocks maintain their “breakout.”
 The 10Y barely moved at all.
 I’m going to grab some popcorn and settle in for the Jay Powell show. I’ll post more after the close.
UPDATE: 5:30 PM
About the only consolation bears can take from today’s session is that: (1) VIX stopped dropping once SPX and ES reached their .886s – the one’s that presumably marked tops on the 21st; (2) ES’ H&S Pattern hasn’t busted – at least yet; and (3) VIX has constructed a nice little falling wedge – suggestive of a breakout in the next session or two. We’ll see.