

On March 18, 2020, VIX topped out at 85.47, the highest level since the GFC. It didn’t stay there long, as central bankers around the world swung into action to save their respective stock markets.
But, its peak was to become the start of a well-defined falling channel (below in white) which has consistently marked turning points for each subsequent rally in the “fear index.”
 Given that VIX is perhaps the most important element in signaling buy/sell decisions for algorithmic trading – and all the passive strategies which follow algos’ lead – these reversals have become relatively foolproof all-clear signs to buy the dip. It is no surprise, then, that futures are up over 30 points after VIX reversed at our latest upside target on Friday.
 Could VIX’s latest reversal be any different from all the rest?
continued for members…
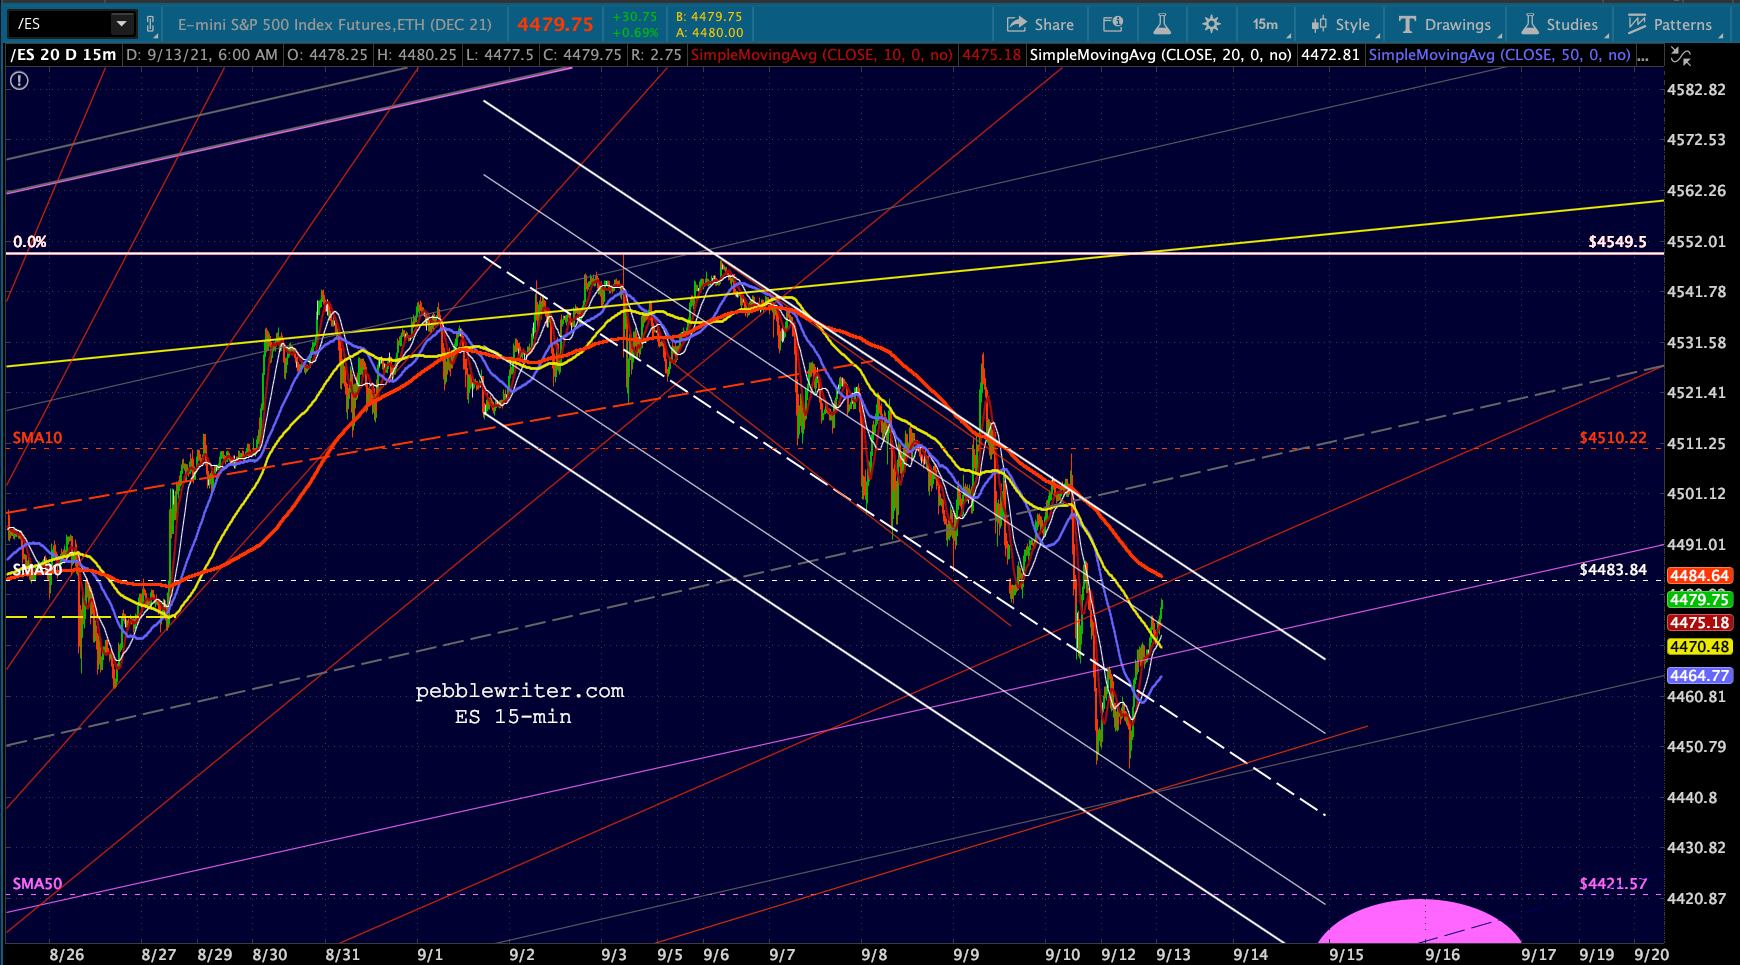
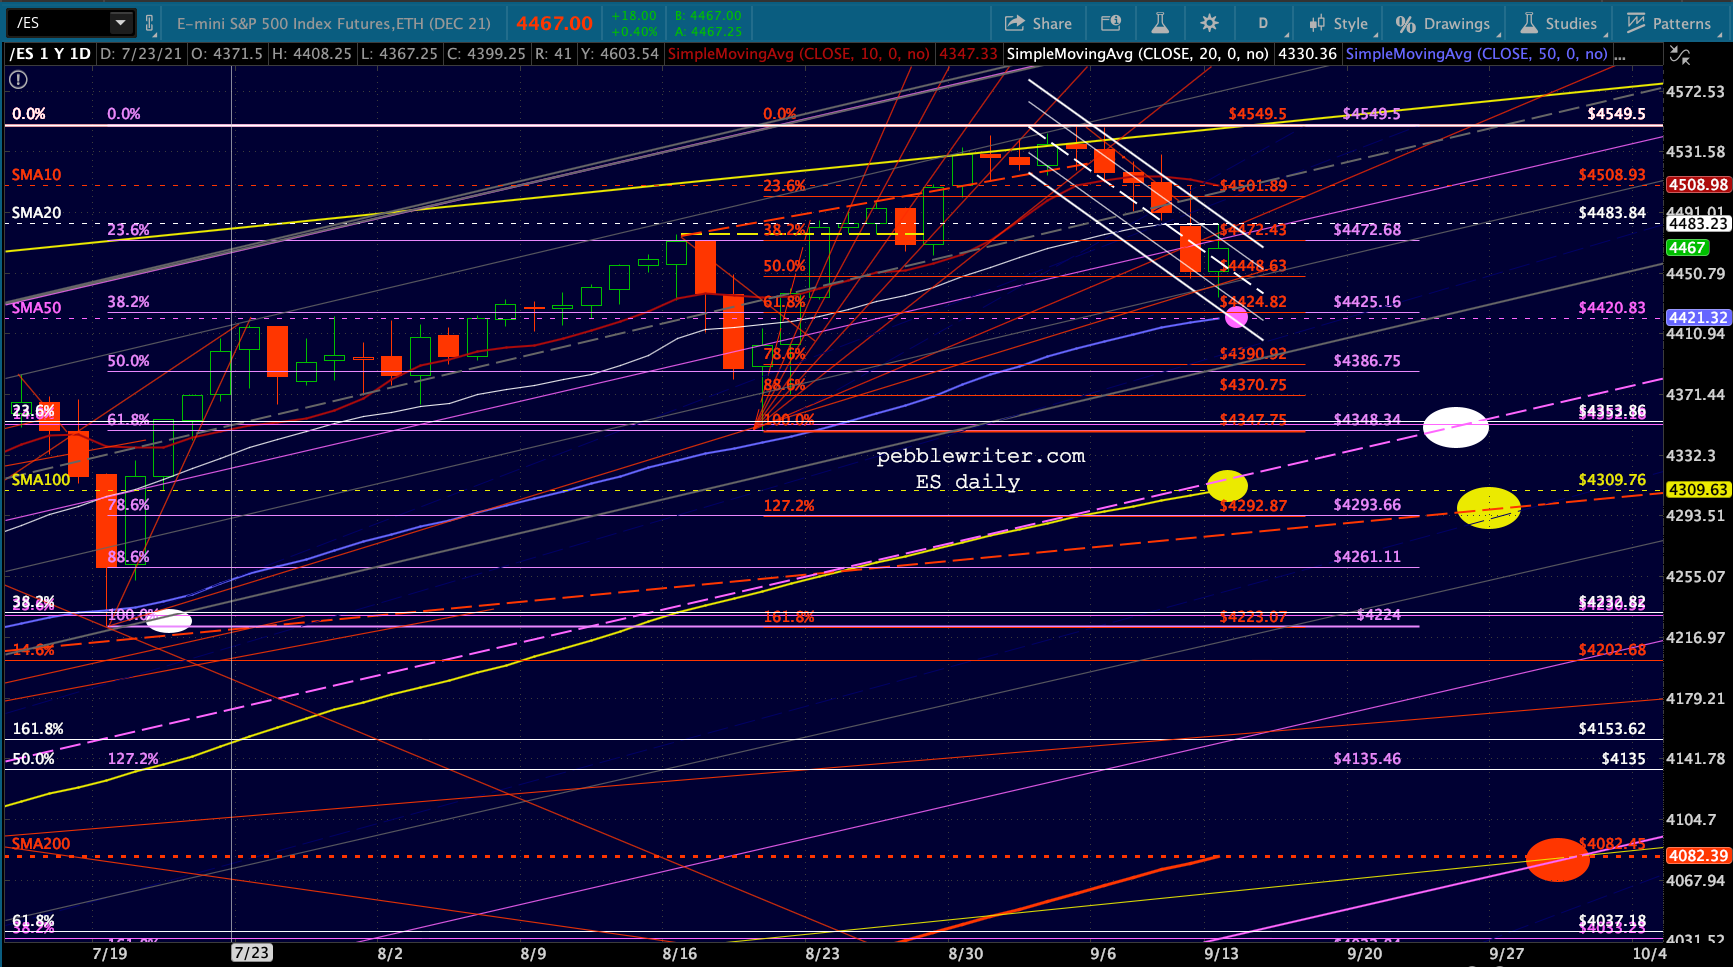
We should note that the previous two peaks during ES’ decline have been head fakes which unwound shortly after the market opened.
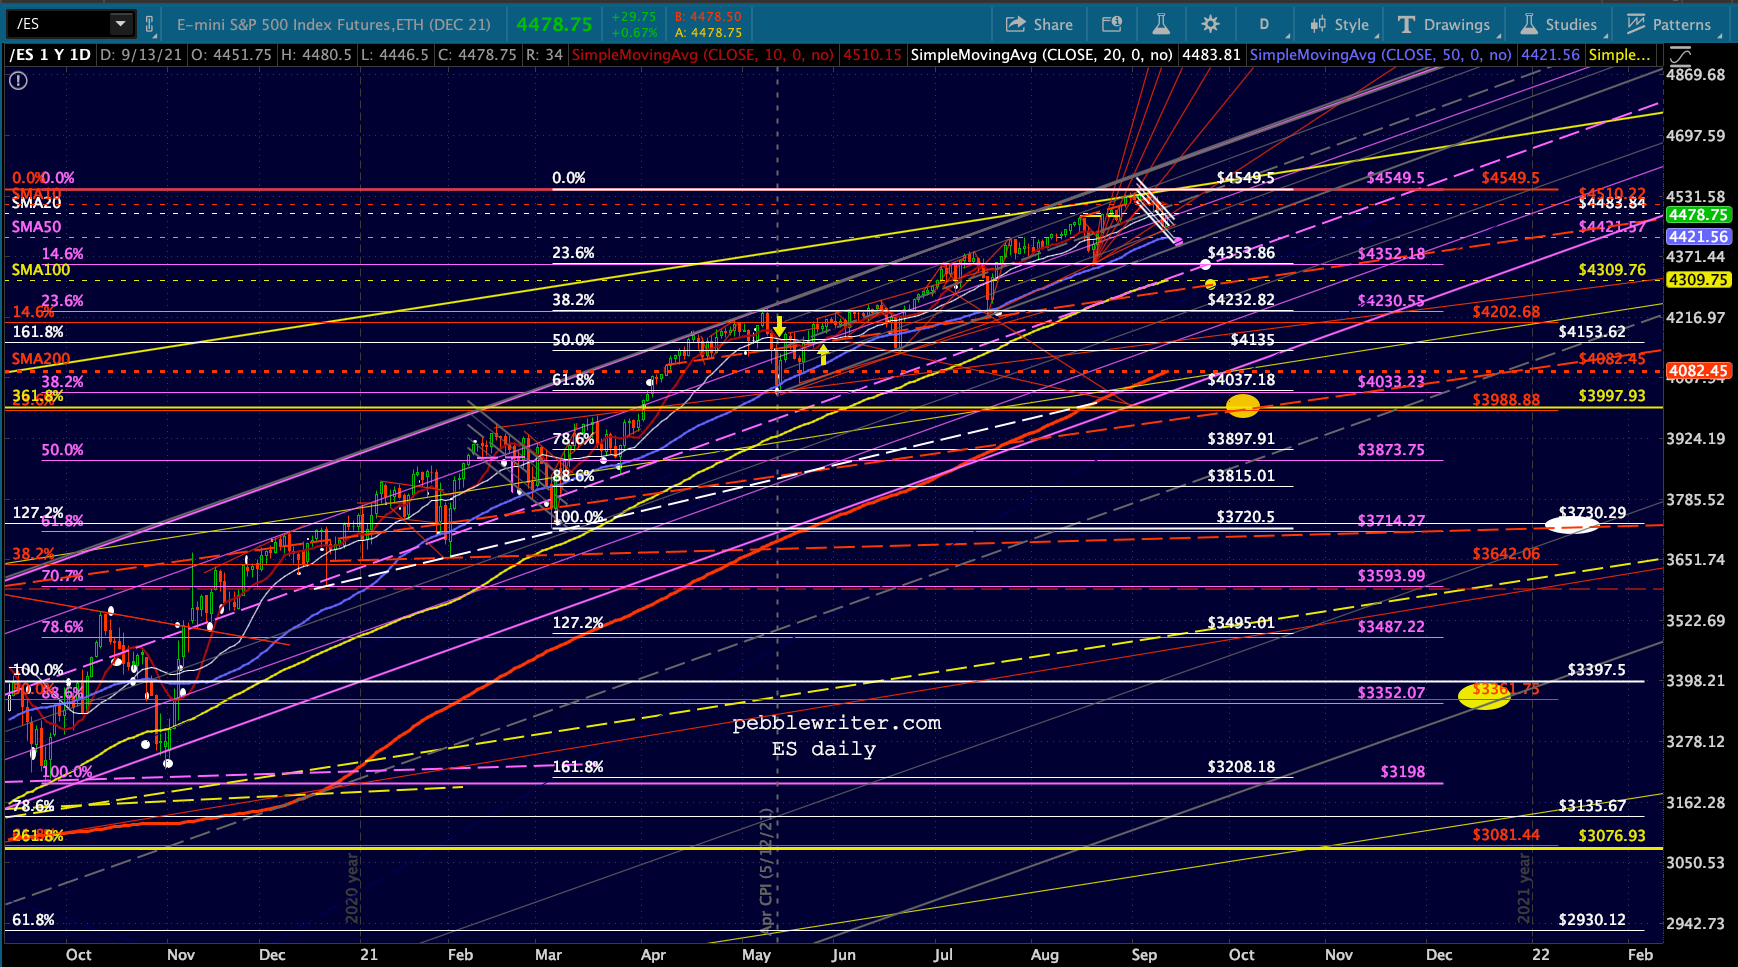
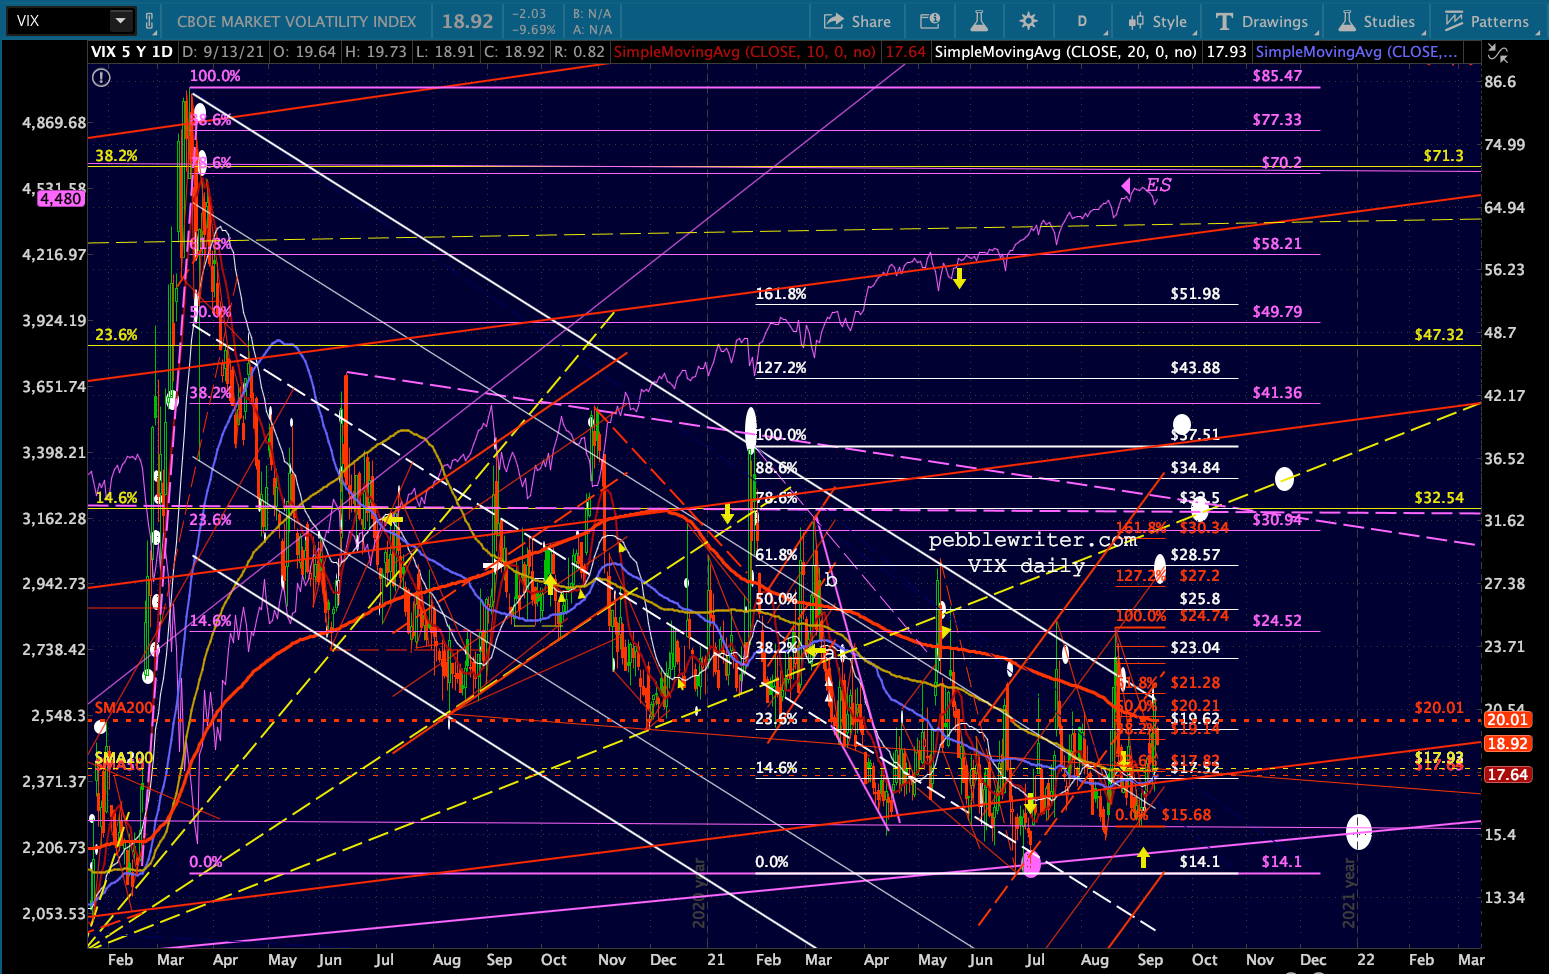
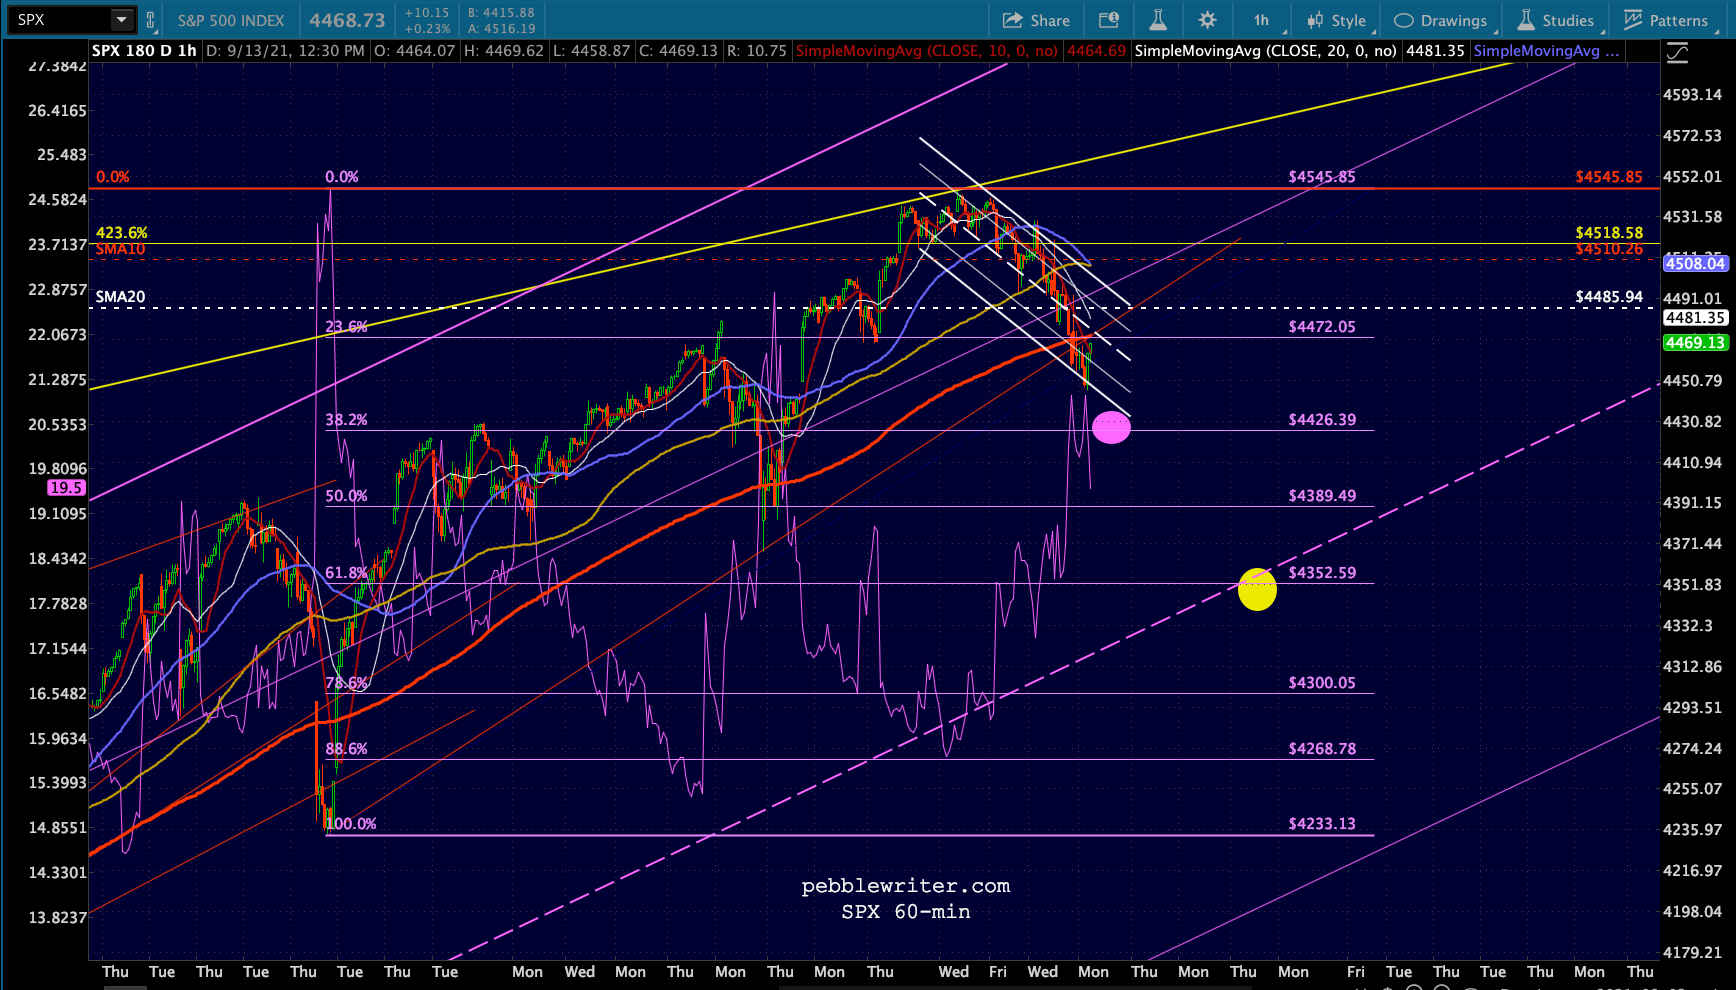
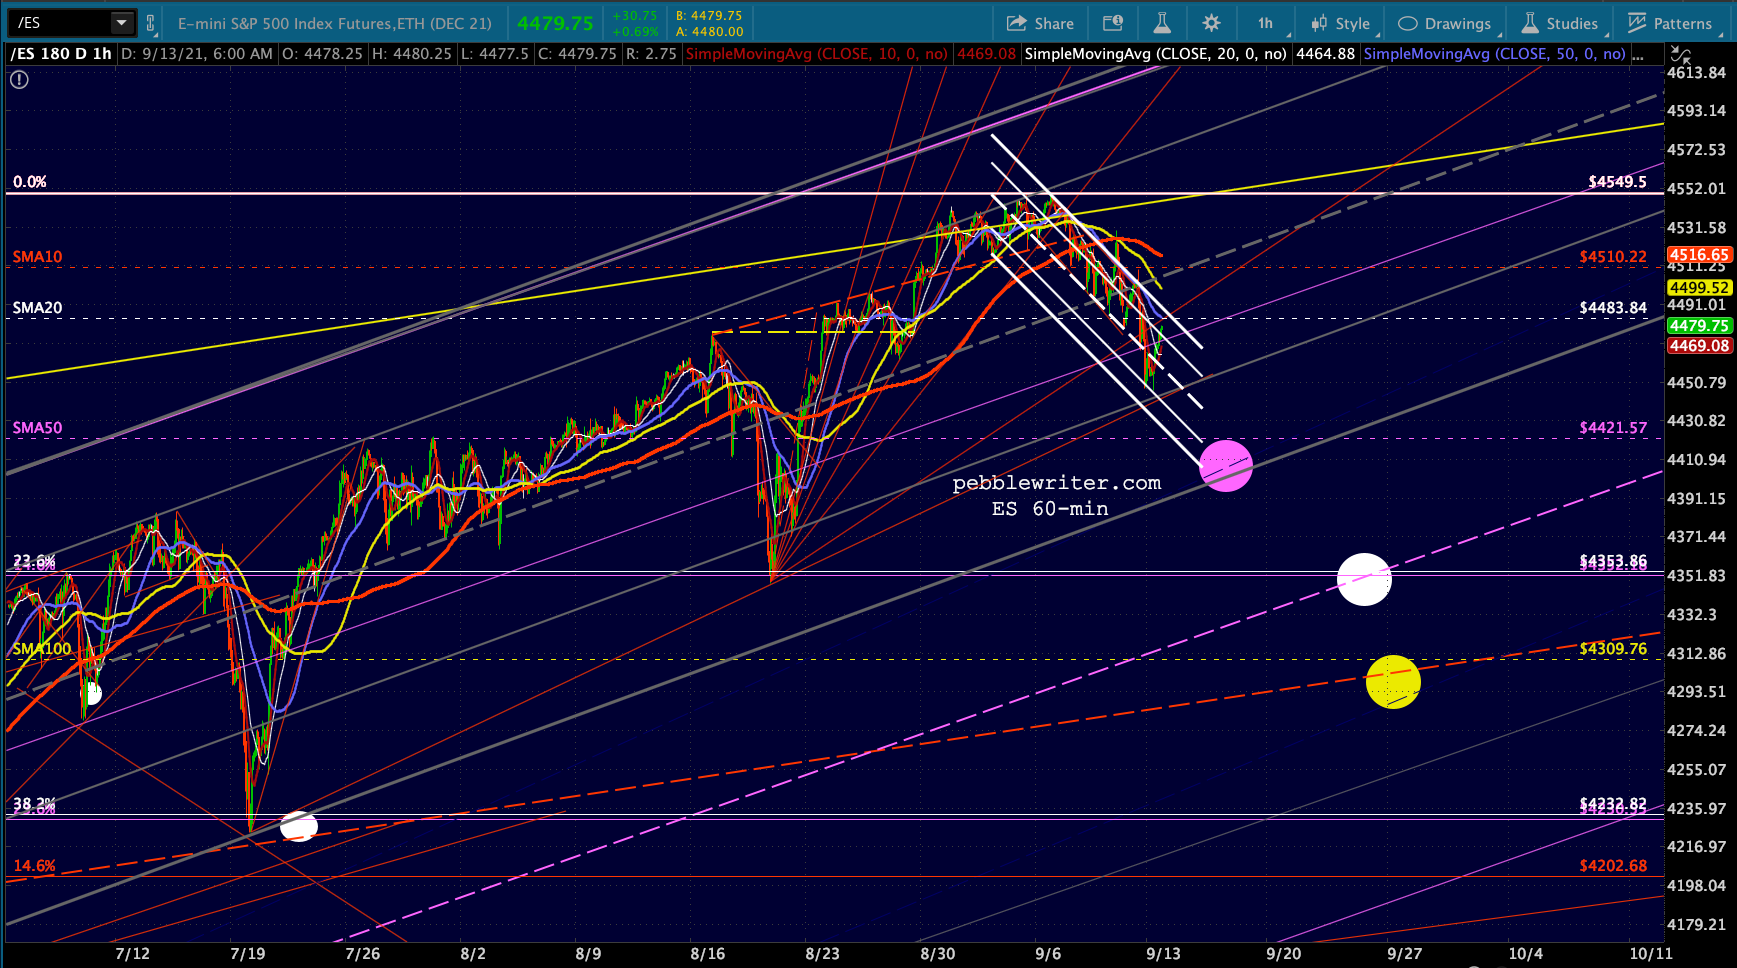 The falling white channel is pretty easy to see up close, but it doesn’t yet amount to much in the big picture.
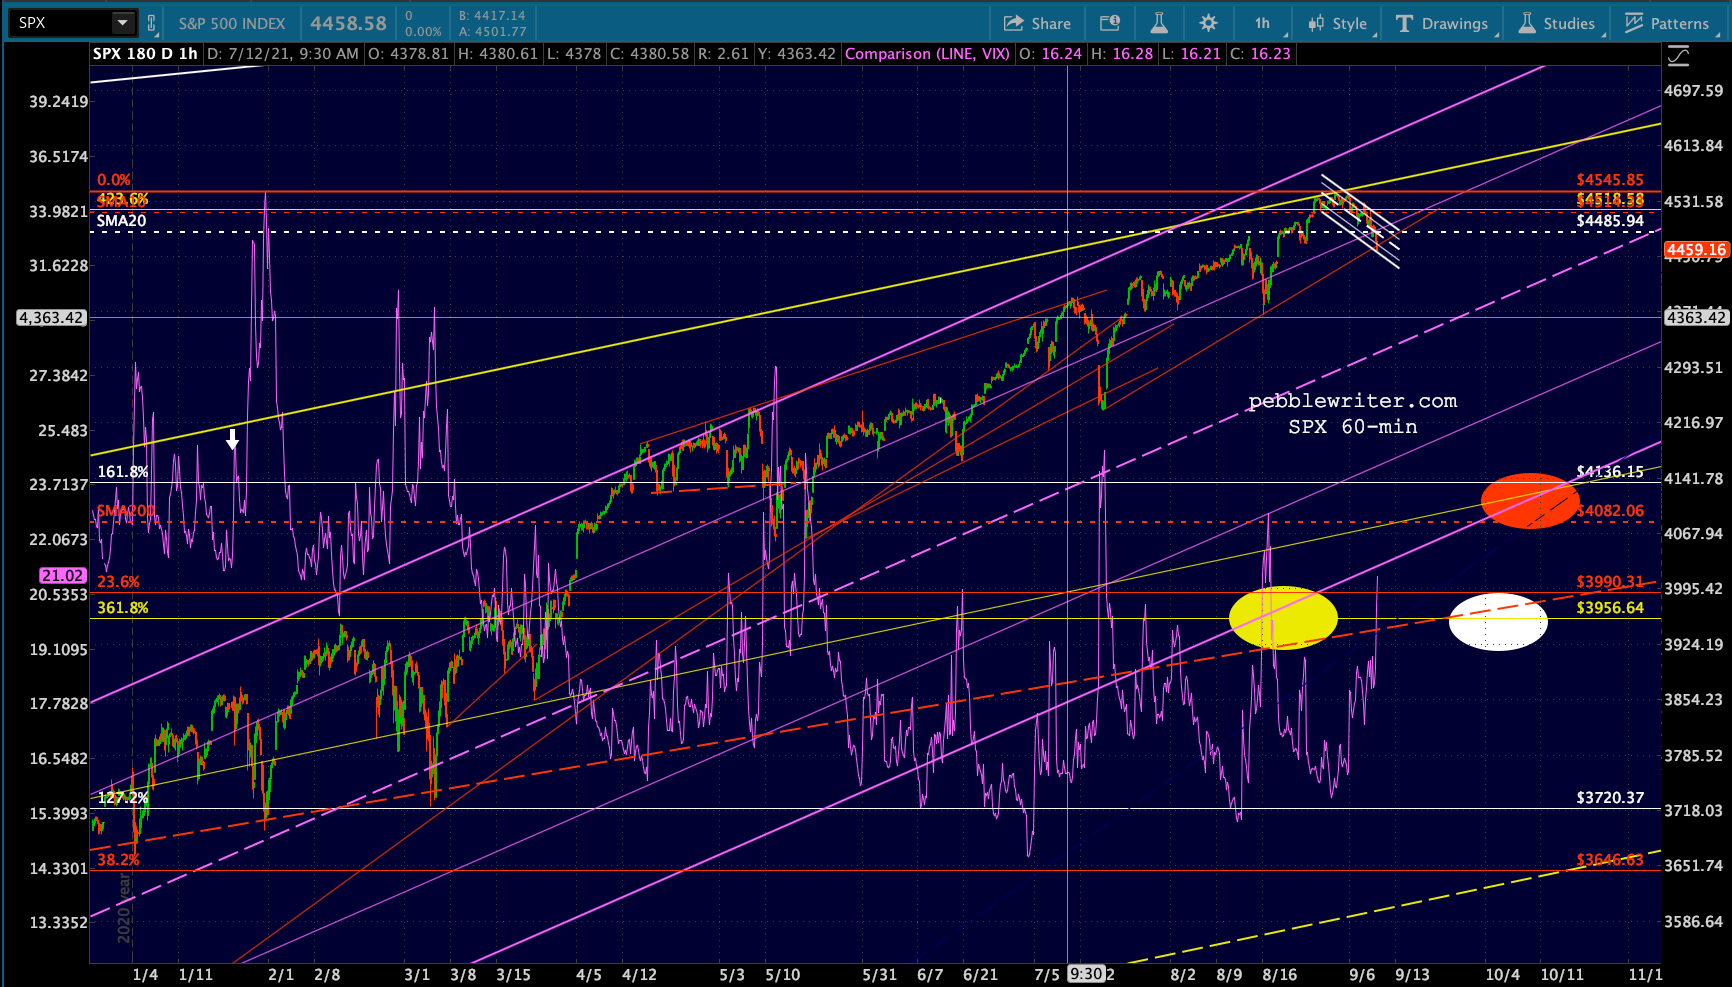
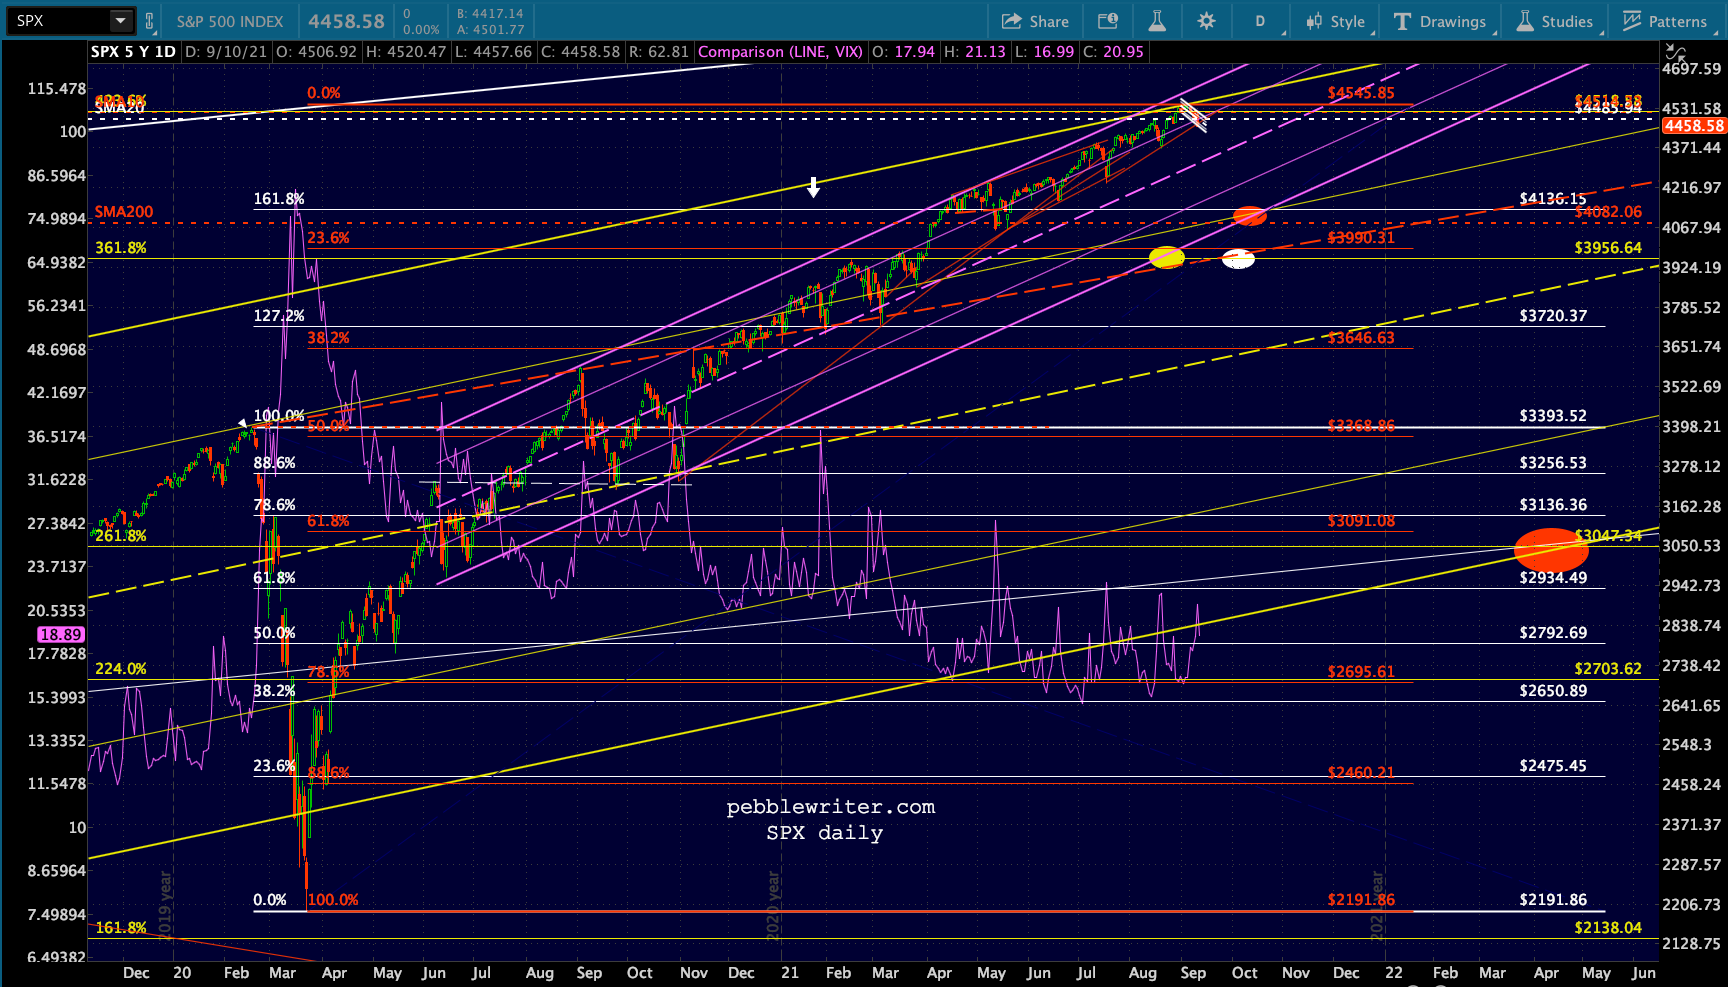
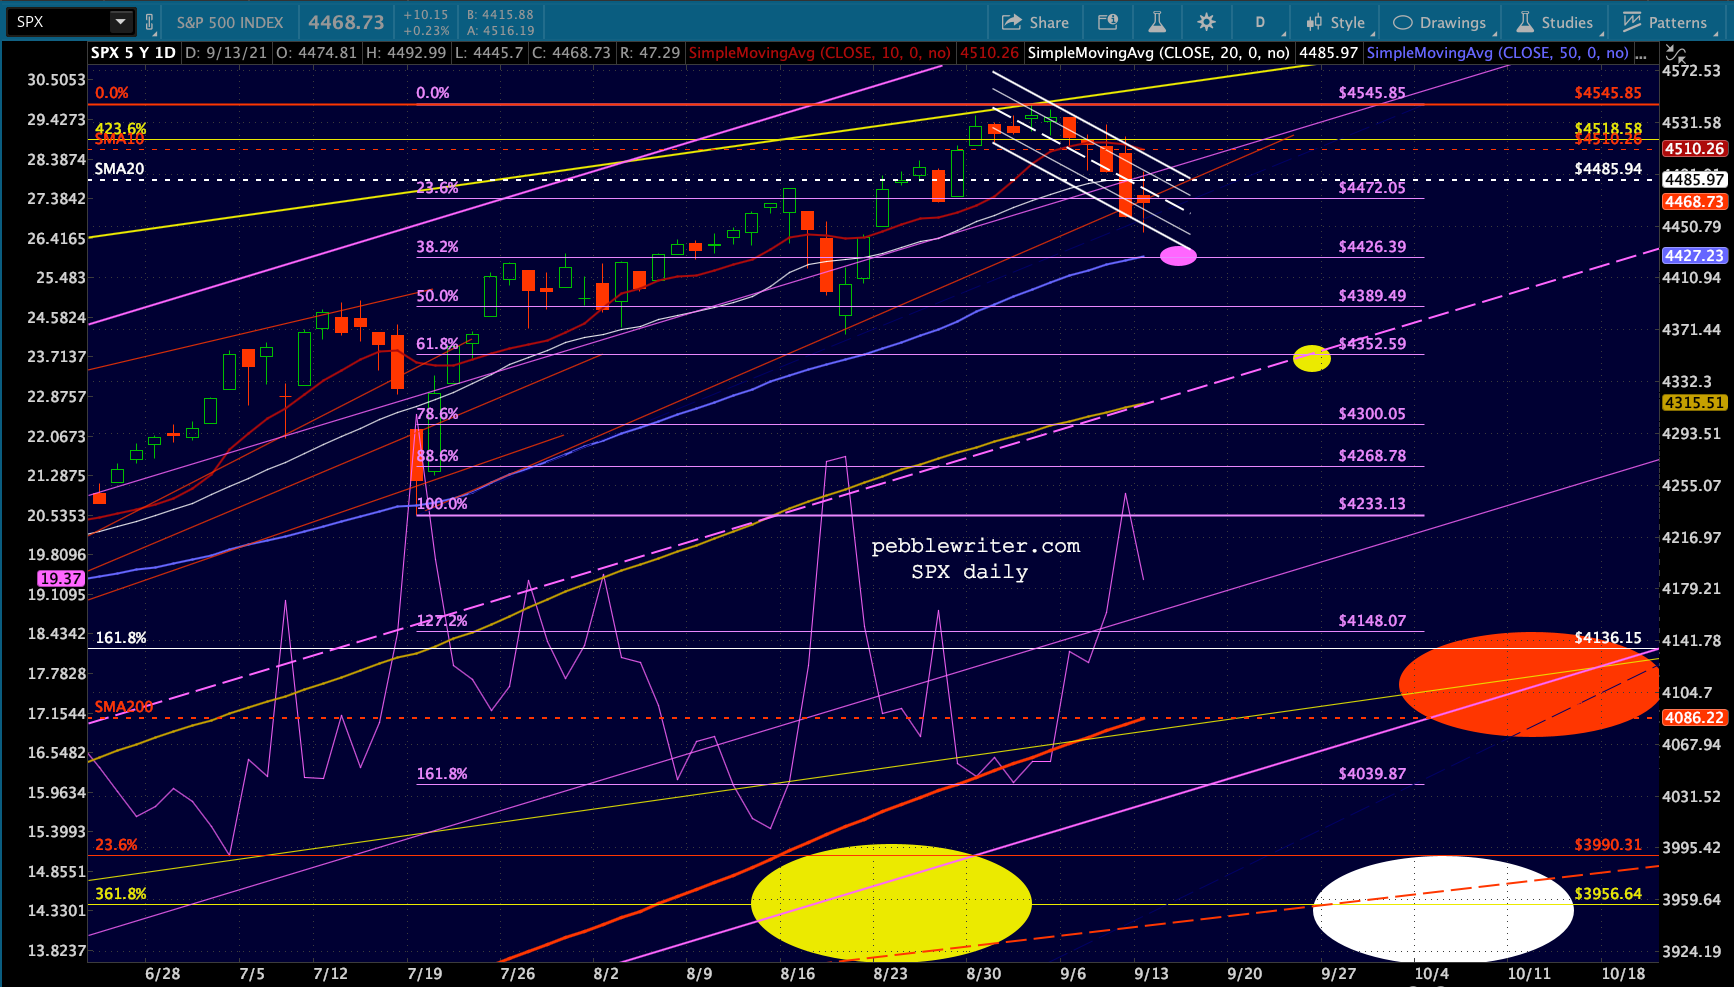
 Ditto for SPX:
 There are two arguments for VIX finally breaking out of the falling channel: a fundamental one and a technical one.
The fundamental argument is the easier one. YoY changes are going through a fundamental shift that doesn’t benefit to the same extent as those from just a few months ago. Inflation, as we discussed last week, has become more than just an oil/gas story. CPI, which will be reported tomorrow, will reflect price increases in many if not most categories and labor prices are climbing steadily higher as unemployment drops. Remember last week’s blowout PPI report.
 Many Fed officials and most industry economists have acknowledged the impact the Fed’s COVID response has had on inflation and that it doesn’t appear to be transitory. While the massive bond buying program has been successful in suppressing interest rates, it has elevated inflation to dangerous levels which can no longer be ignored. Something has to give. And, that something is most likely going to be an interest rate decline which is driven by a market selloff rather than QE.
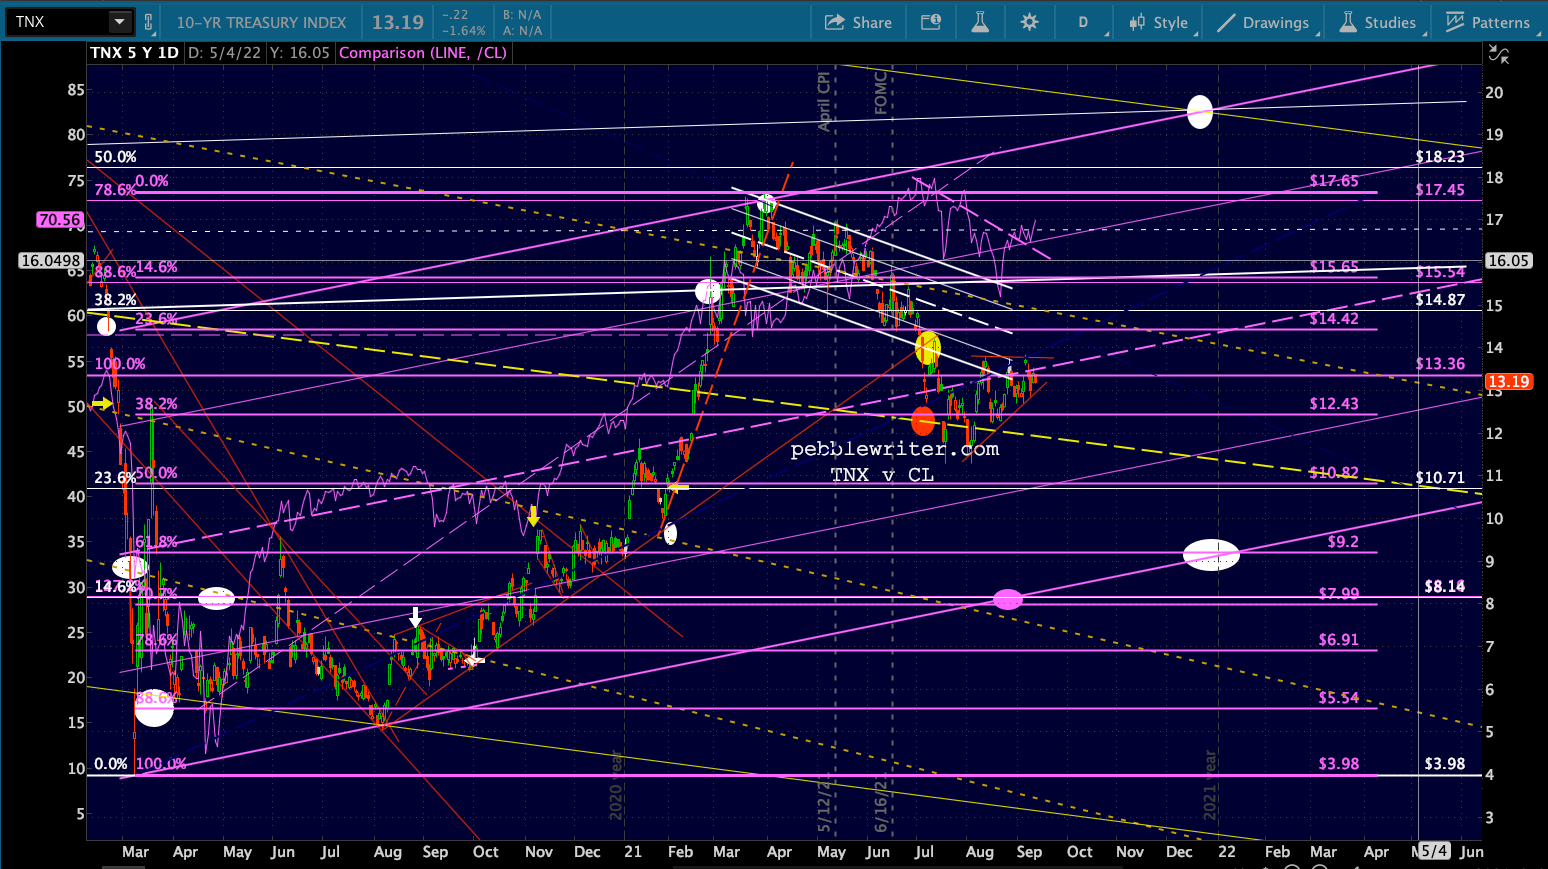
This is the reason I’ve been comfortable holding on to the downside case for the 10Y – a very lonely position, by the way.
 The technical case for a VIX breakout is based on the price chart and the RSI chart. VIX’s previous breakdowns of the dashed yellow fan lines have been followed by backtests which came very close to their former highs. This latest one from May hasn’t barely reached a 50% retracement. A full backtest of the yellow fan line would indicate a retracement to the white .786 at 32.50ish – also marking the intersection with a trend line (blue, dashed) connecting the last four highs.
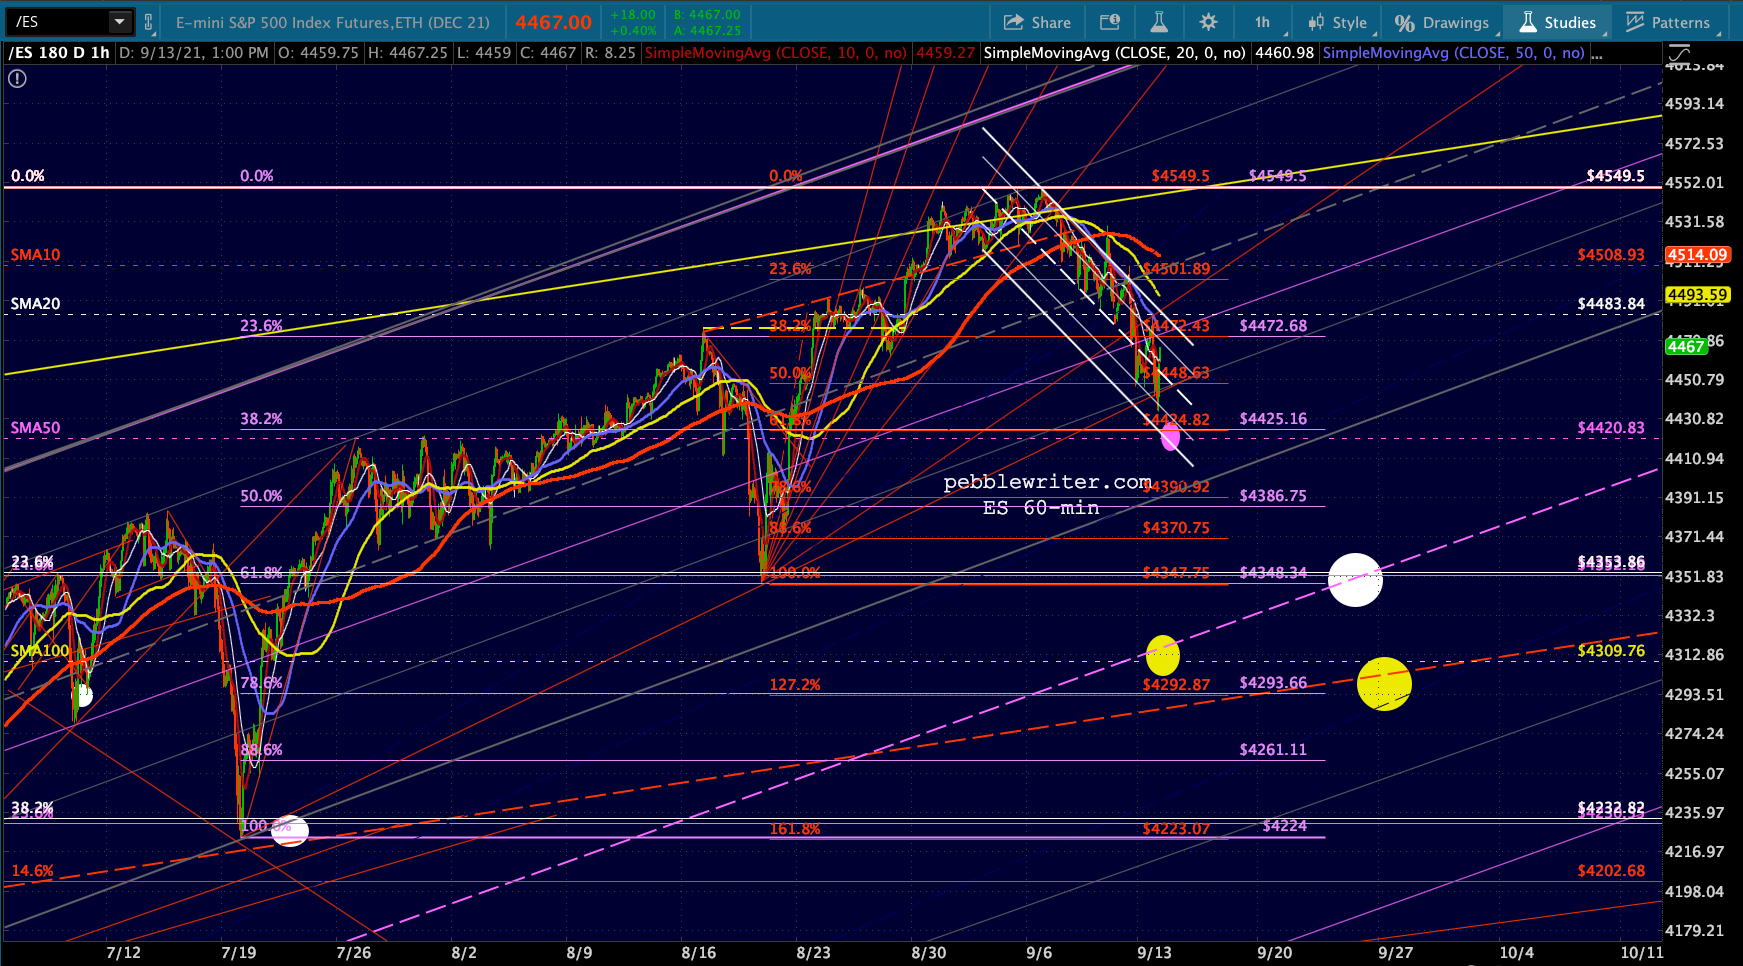
 VIX is perhaps a day, two at most, away from another bullish (bearish for stocks) 10/20 cross, and just getting ES down to our SMA50 target will likely require VIX to exceed Friday’s highs (and the channel top.)
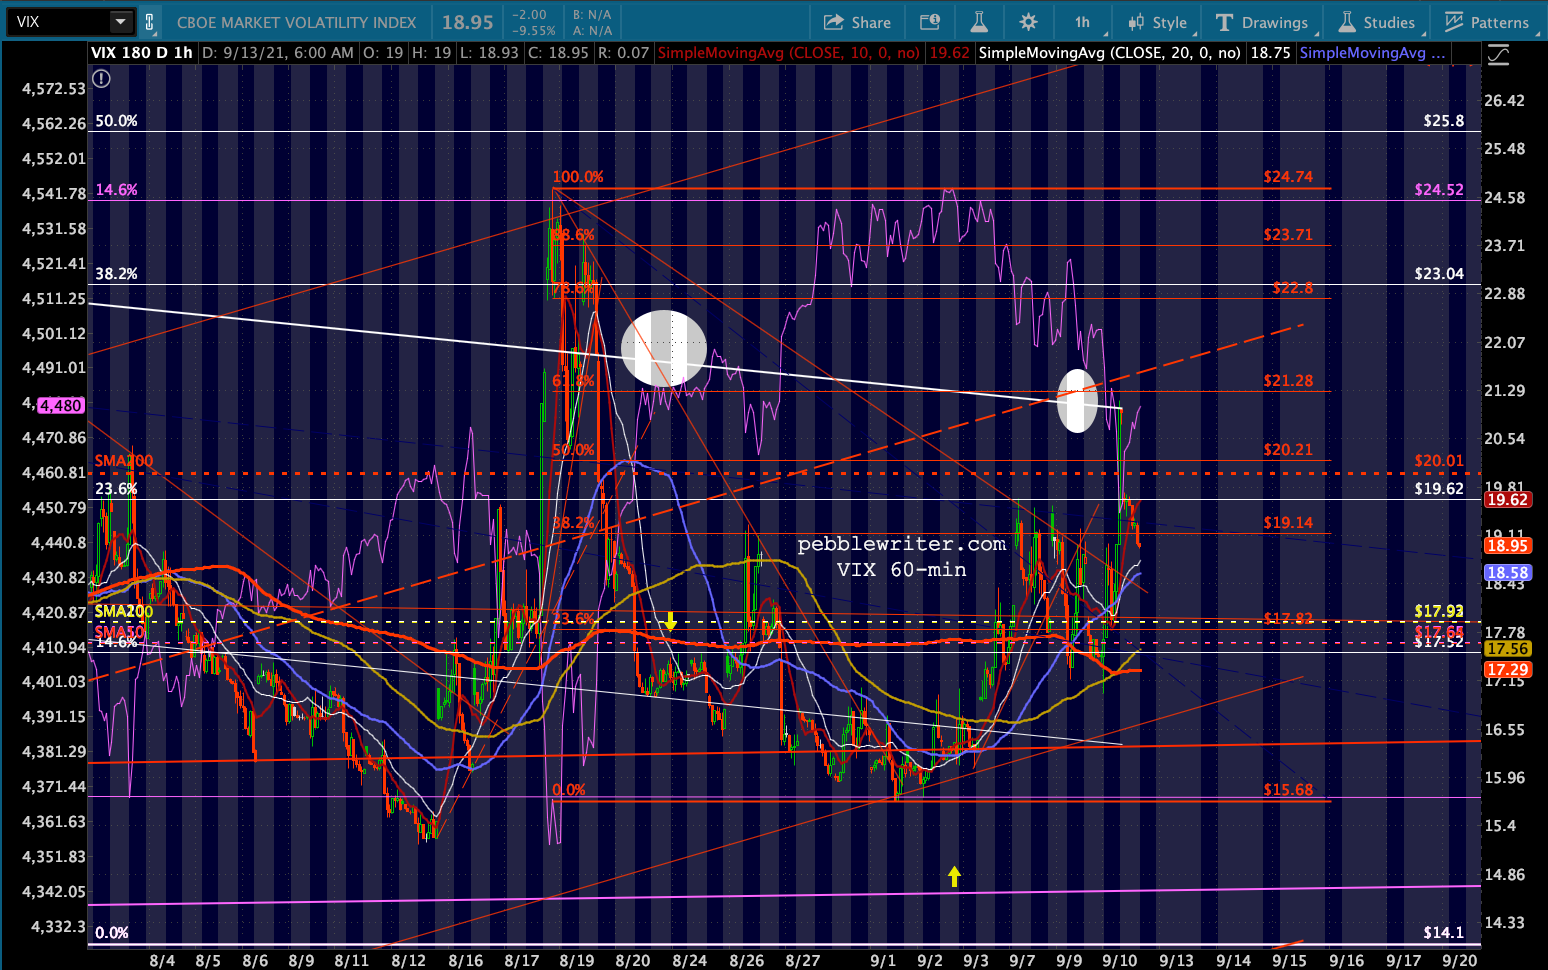 Note also that VIX’s RSI has been coiling for quite some time – higher lows and lower highs. The latest low didn’t even reach the TL from Nov 2020, while the latest high is butting up against the falling red TL from April 2021. I think it’s very likely to bust this TL and continue up to at least the TL from the Feb 2020 highs.
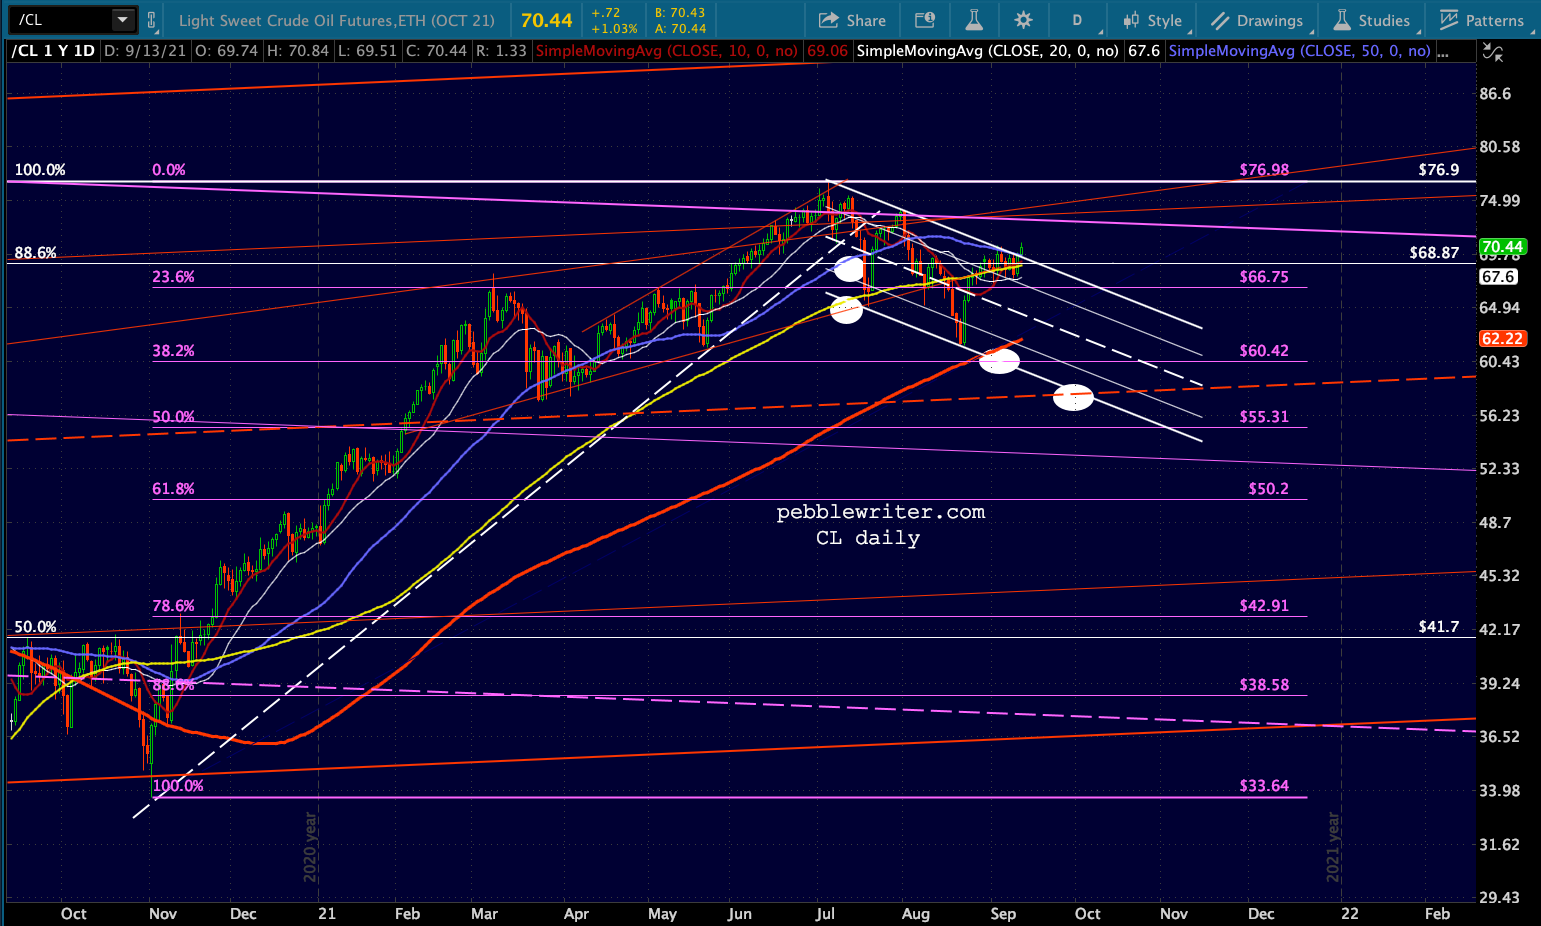
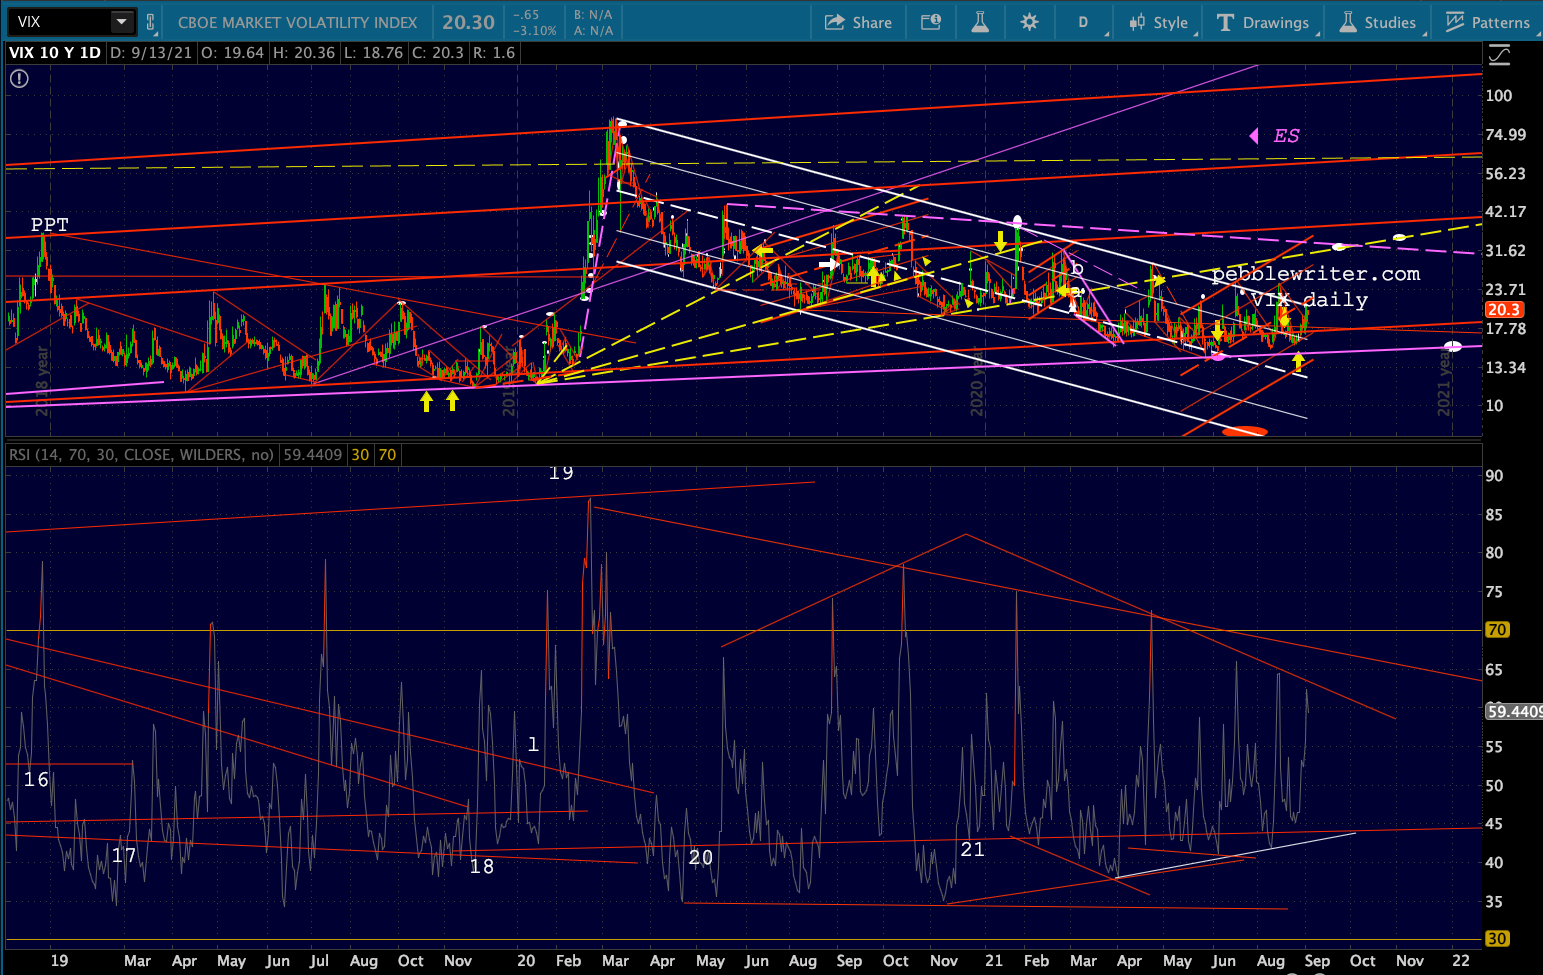 The story on the other factors remains essentially unchanged with one exception. CL is technically breaking out this morning. I don’t believe it will hold, but for now it’s helping to prevent ES’ descent.
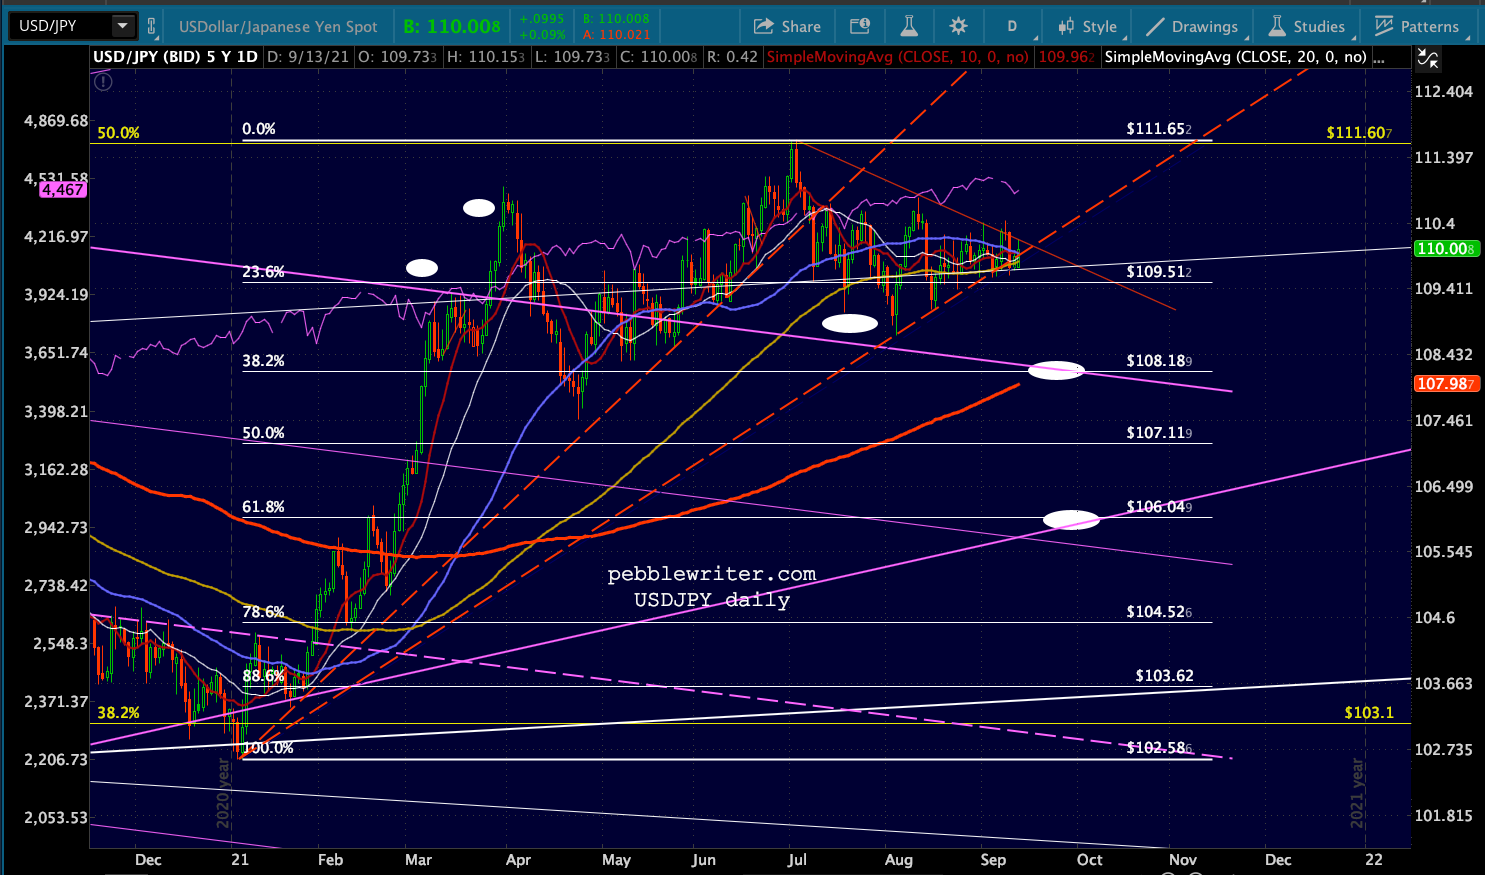
 The currency picture remains unchanged. USDJPY’s triangle is getting very long in the tooth. The SMA200 should emerge from the falling purple channel within a week, offering USDJPY an opportunity to backtest in a “bullish” way.
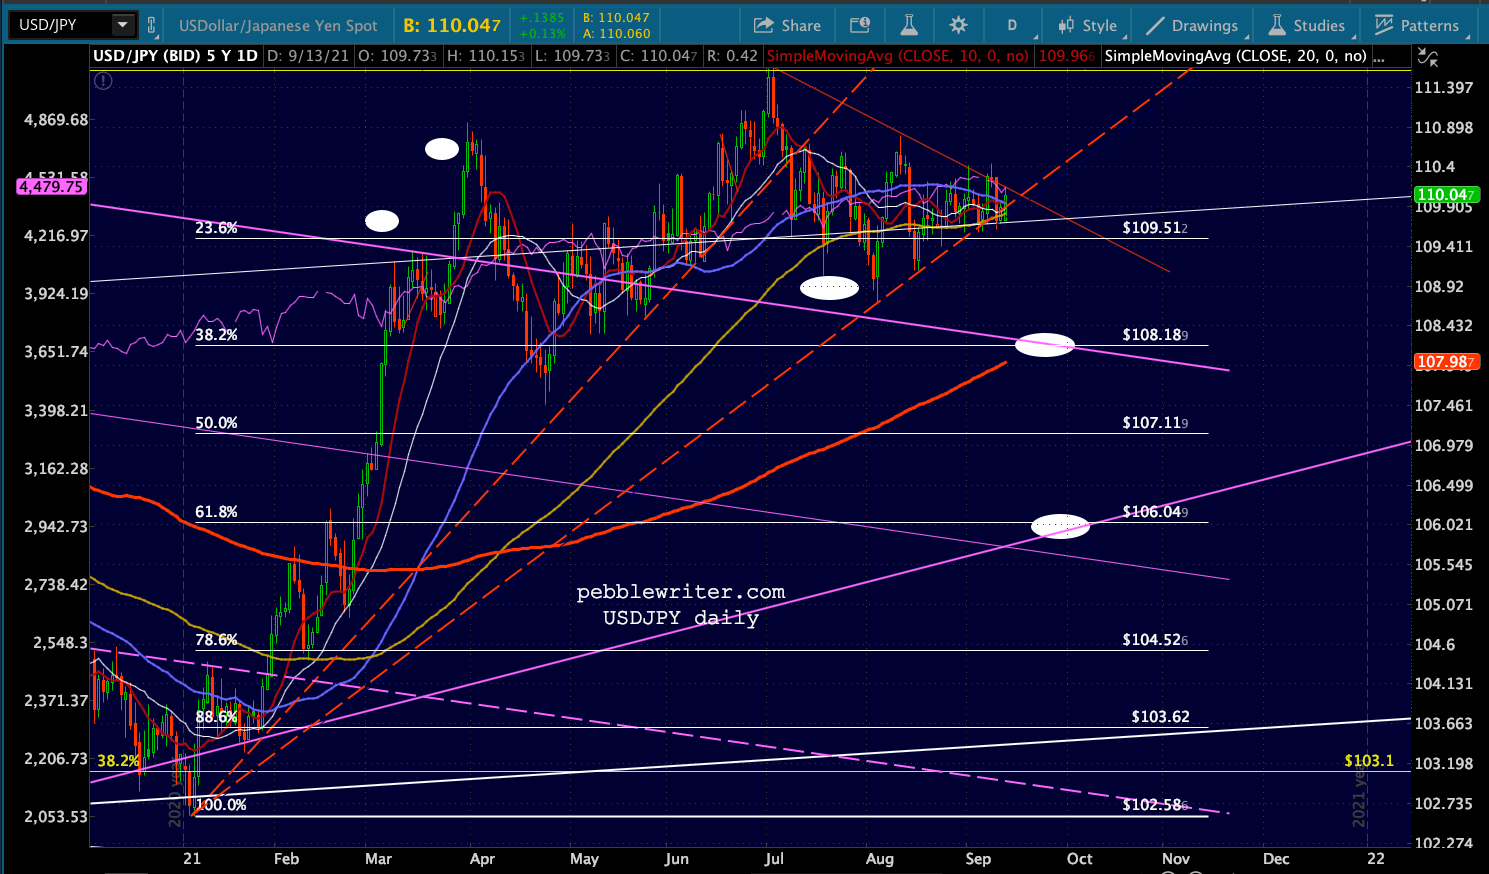 EURUSD still looks vulnerable to a deeper backtest – dollar strength…
 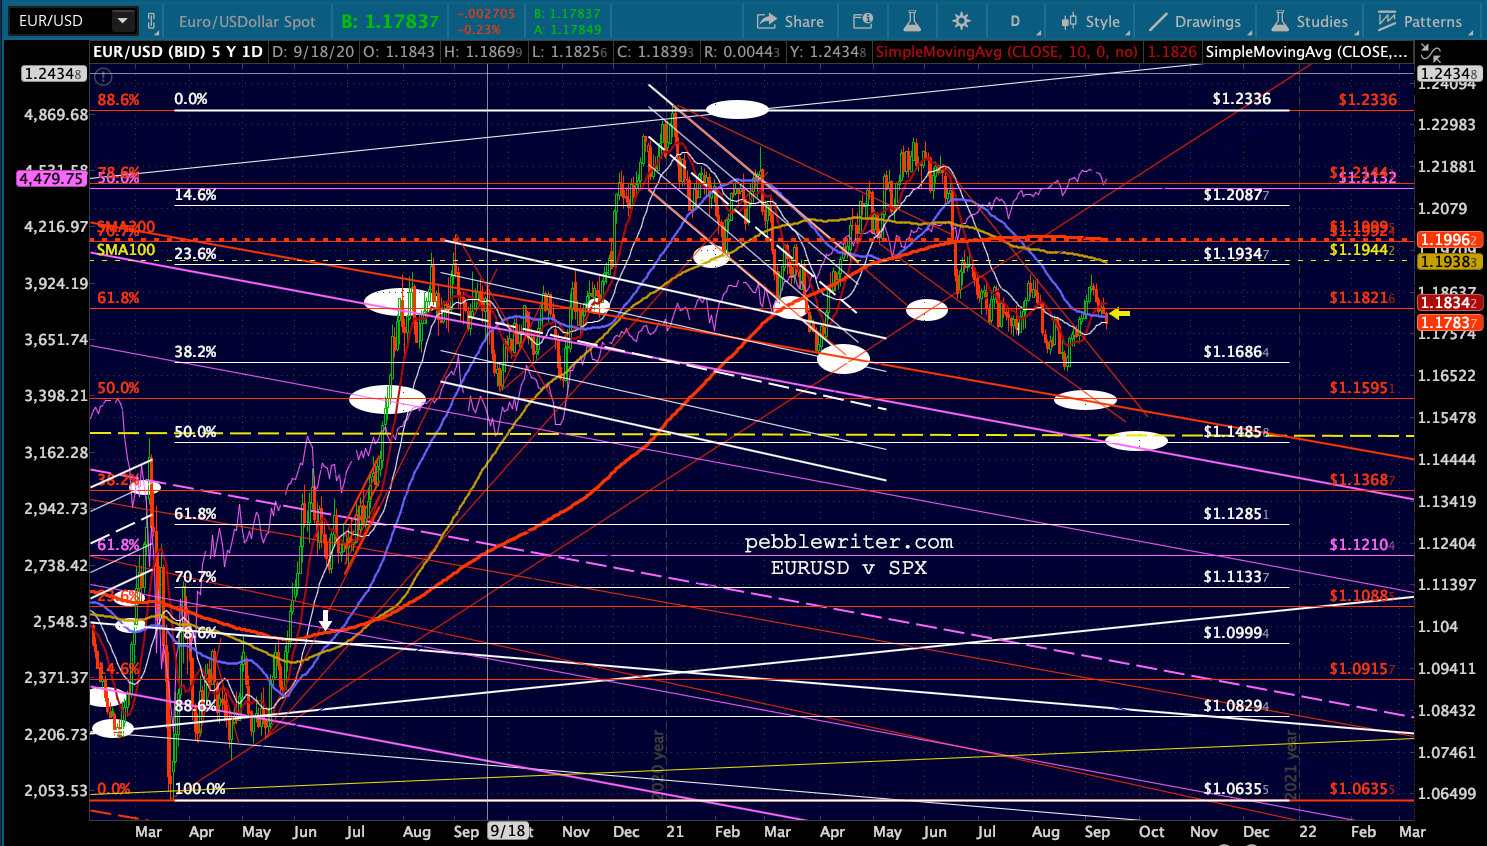 …which could help DXY break out of the white flag pattern.
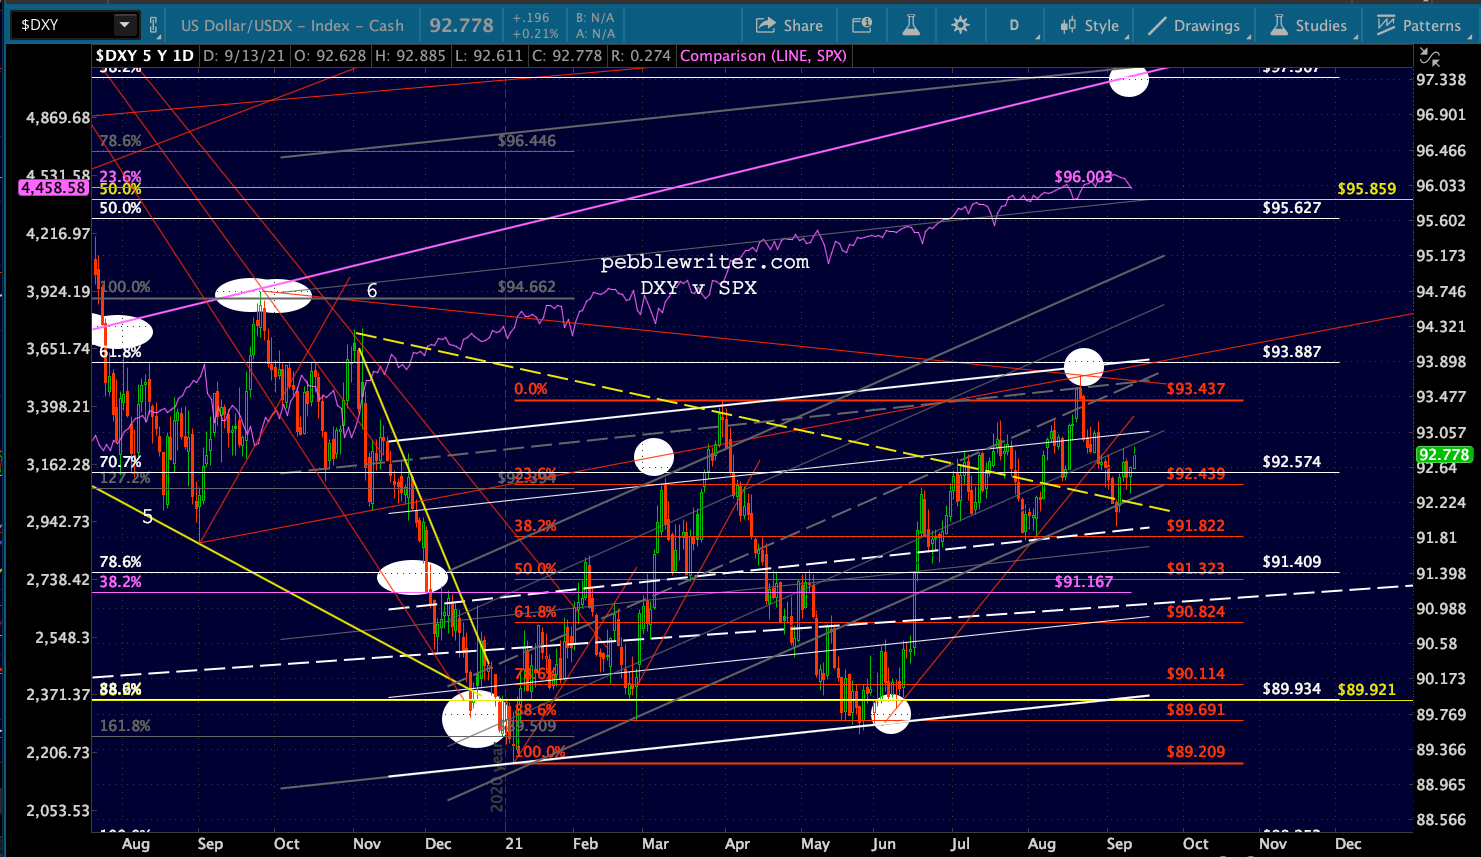 GC remains on the verge of a breakdown…
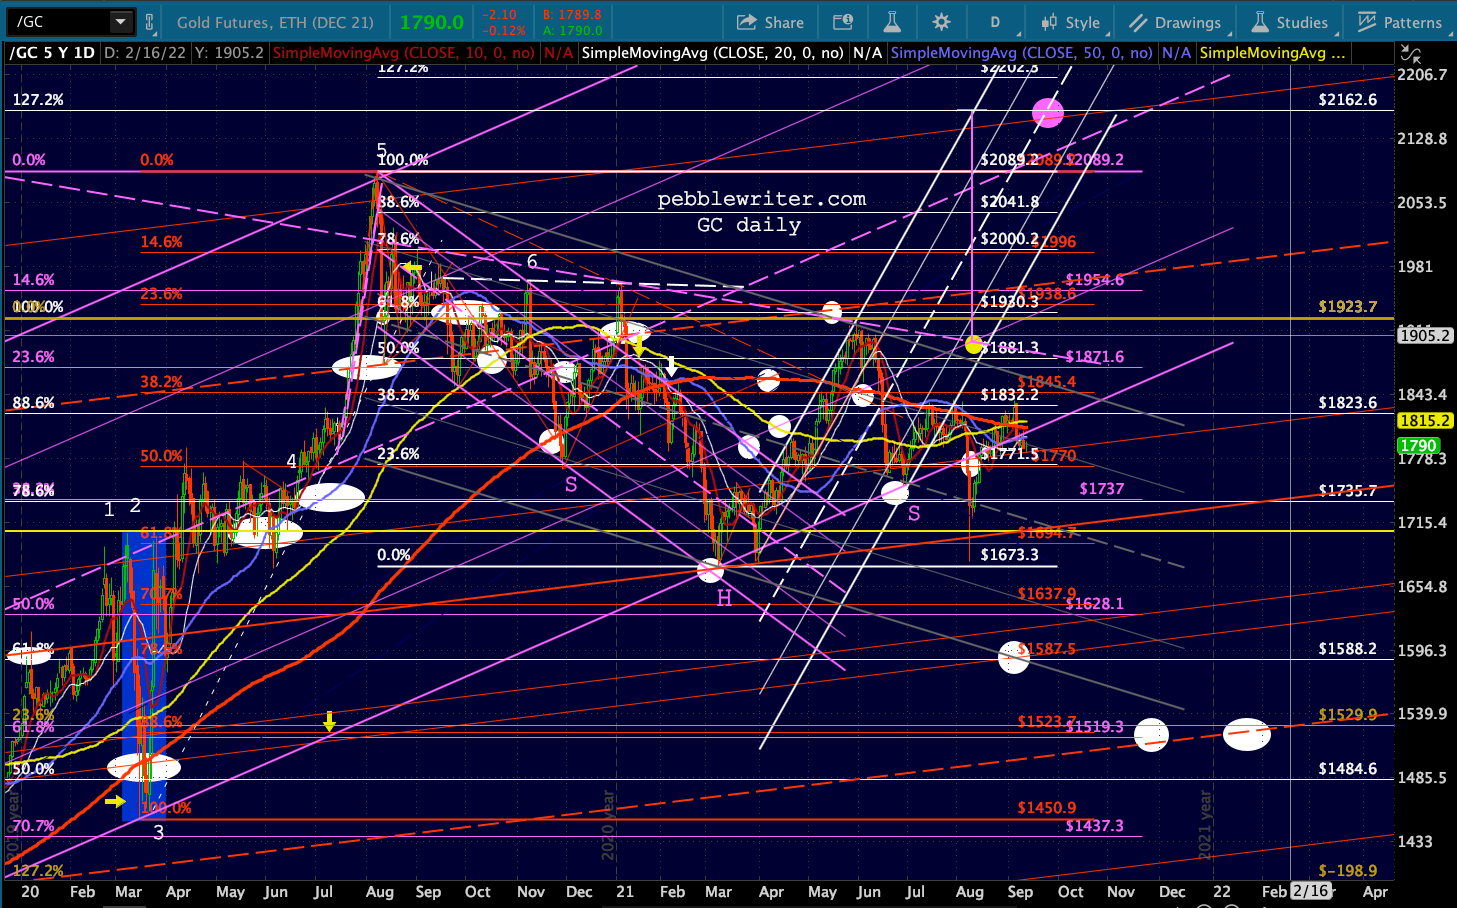 …as does SI.
 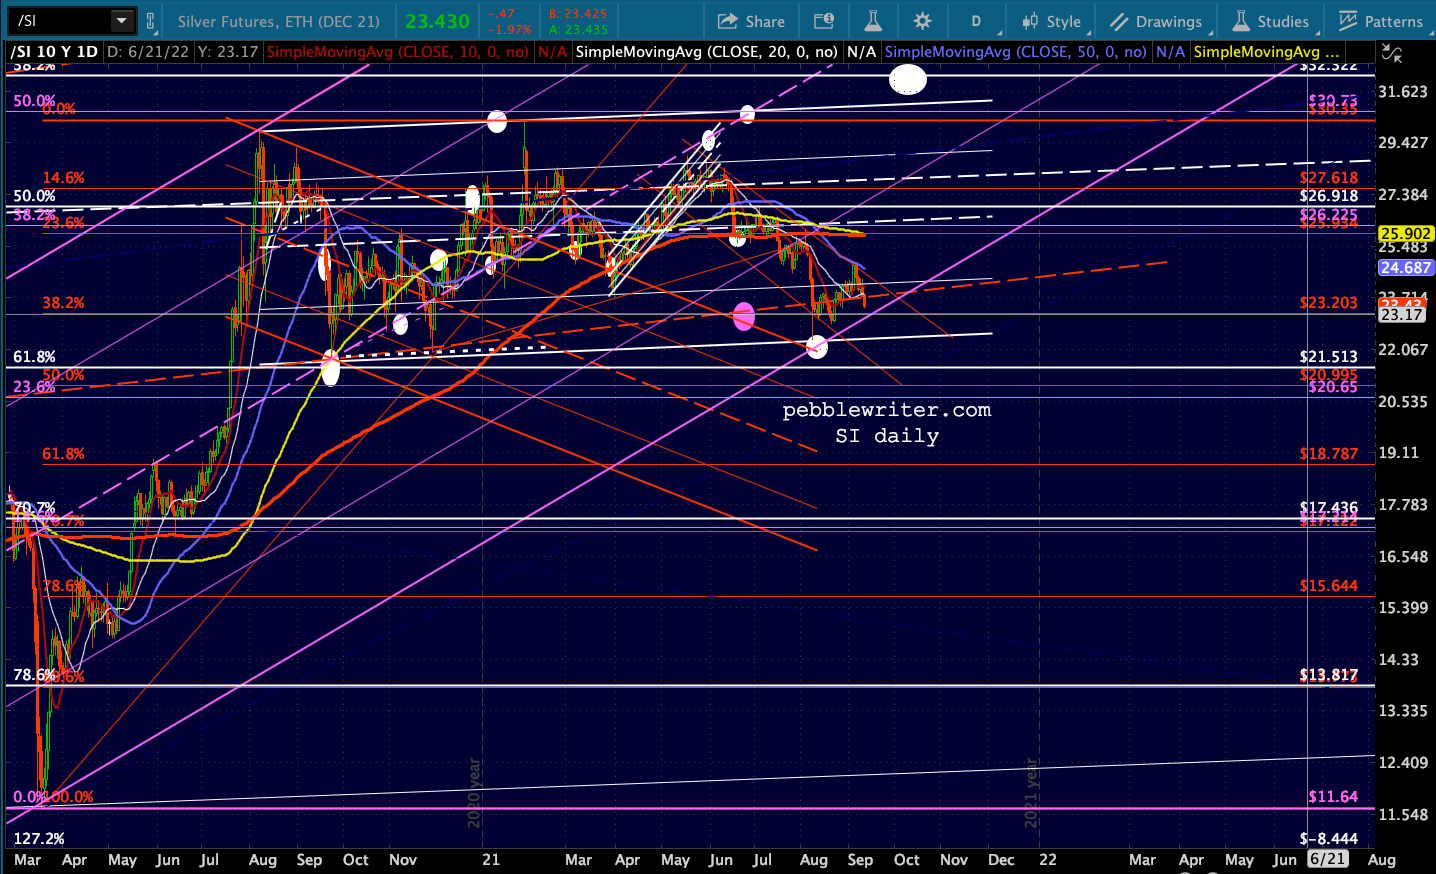 While BTC is buttoning up that cloud backtest a little more convincingly that it did last week. Again, I expect it to push lower. But, we have no proof of a breakdown just yet.
 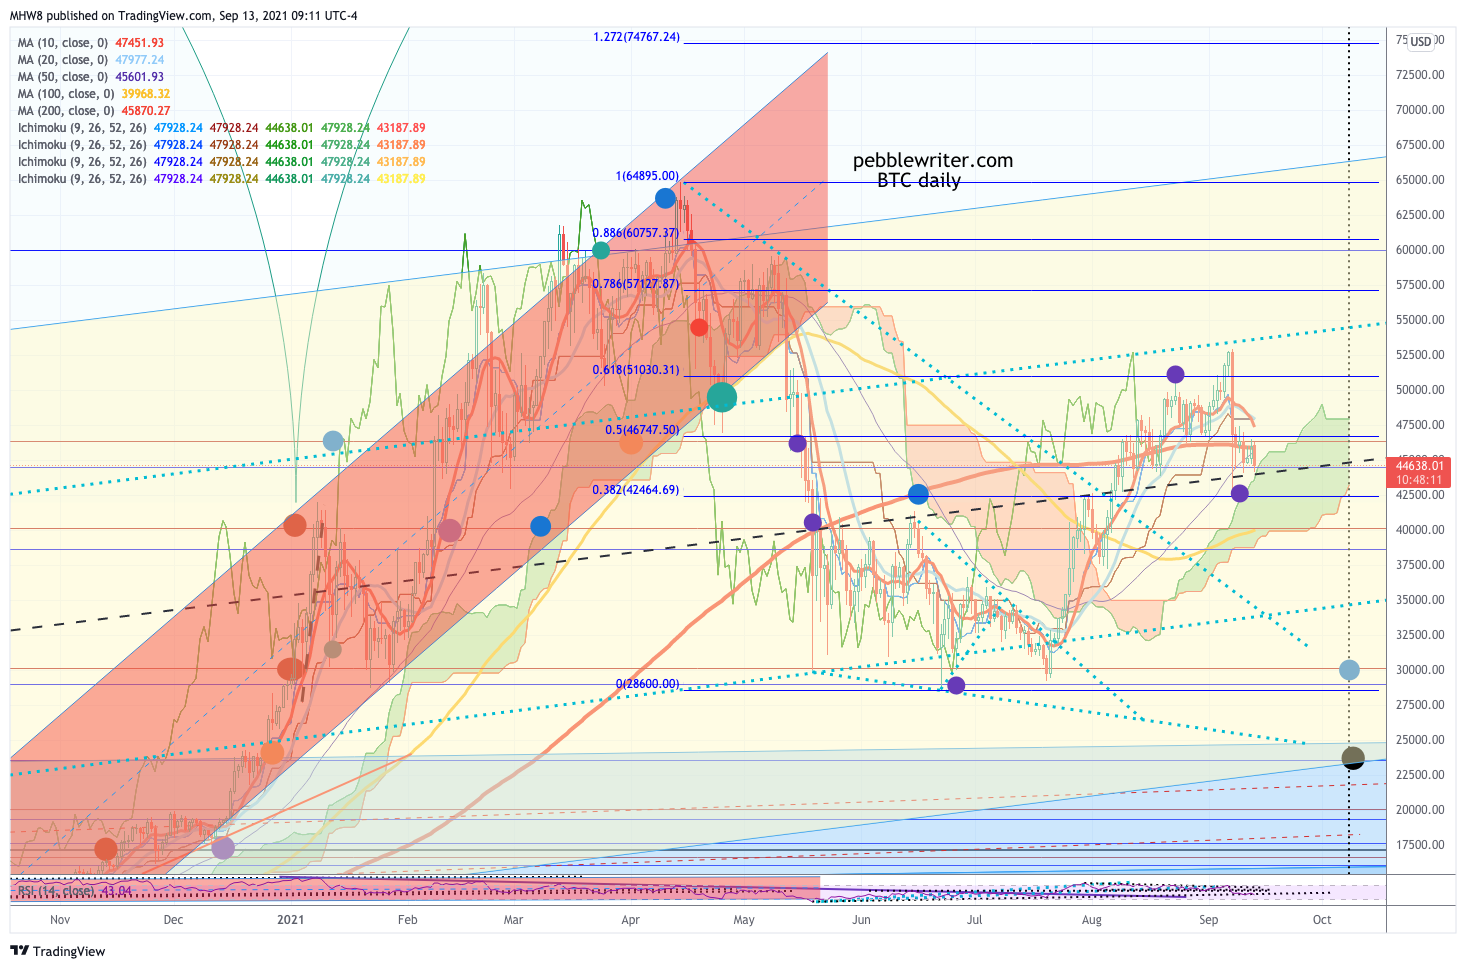 UPDATE: EOL
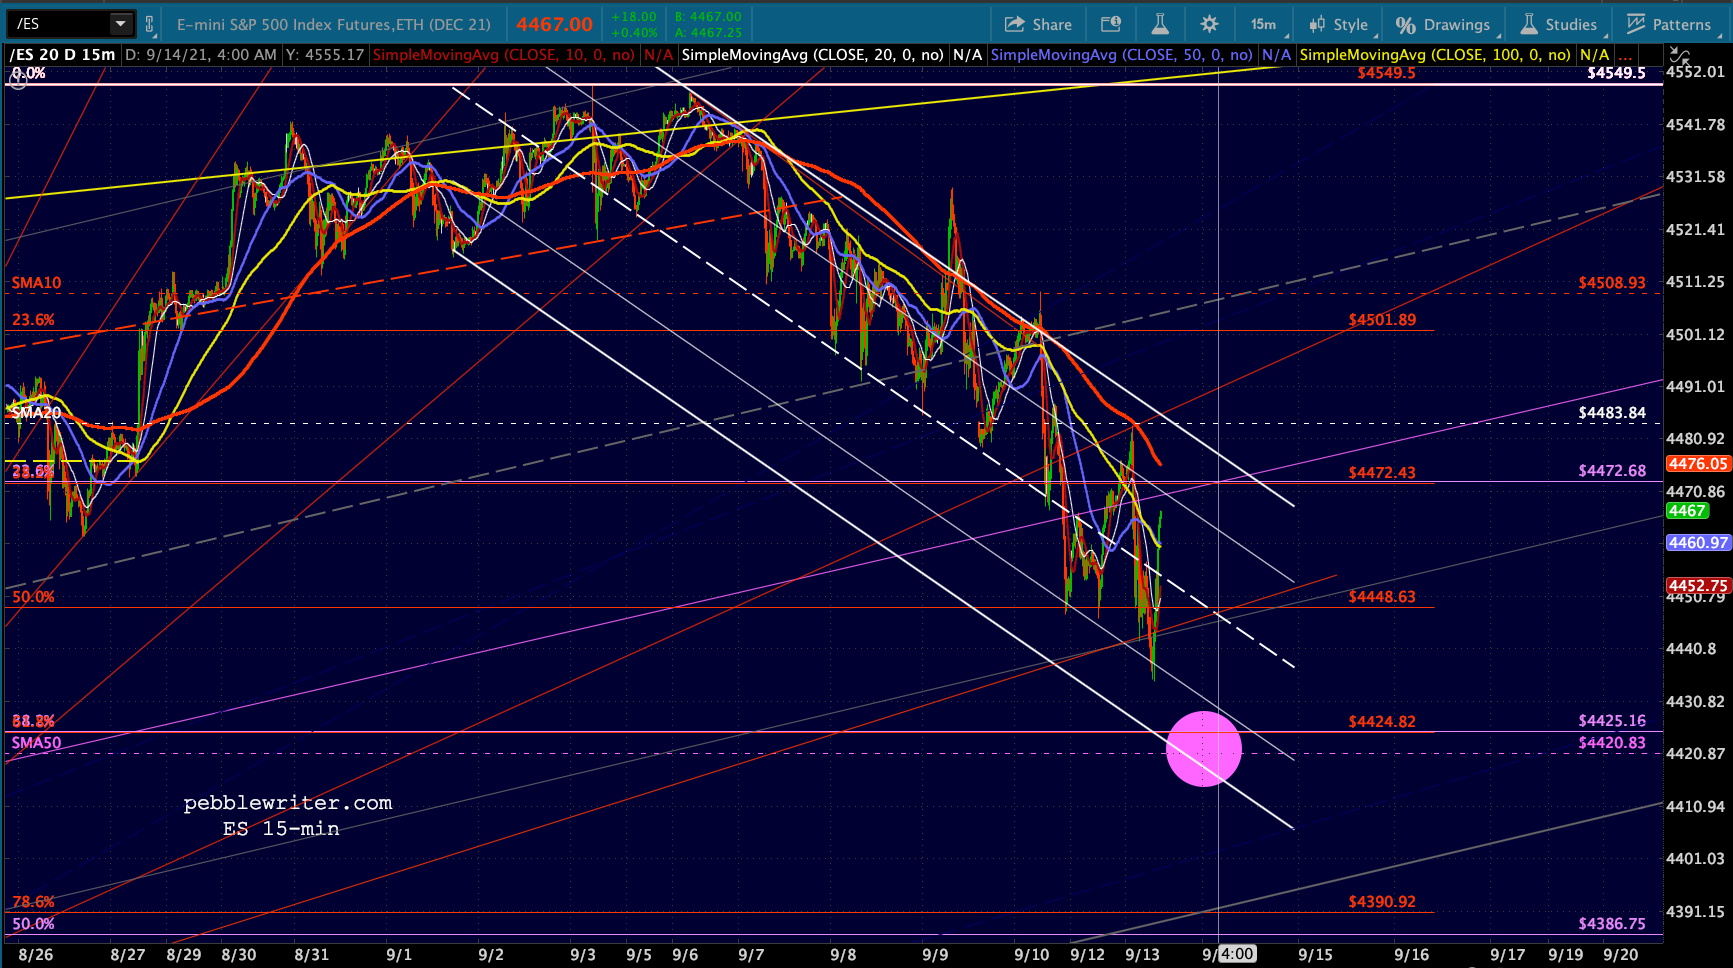
Things were looking pretty good for the SMA50…until the 43 point meltup into the close. If the CPI print is scary tomorrow morning, we could still get to 4420 in the pre-market, allowing ES to bounce on its SMA50 for the umpteenth time in a row and depriving cash bears of the opportunity. Otherwise, it’s yet another pretty good head fake.
 VIX managed not to push above its .618 and only slightly above Friday’s highs.
 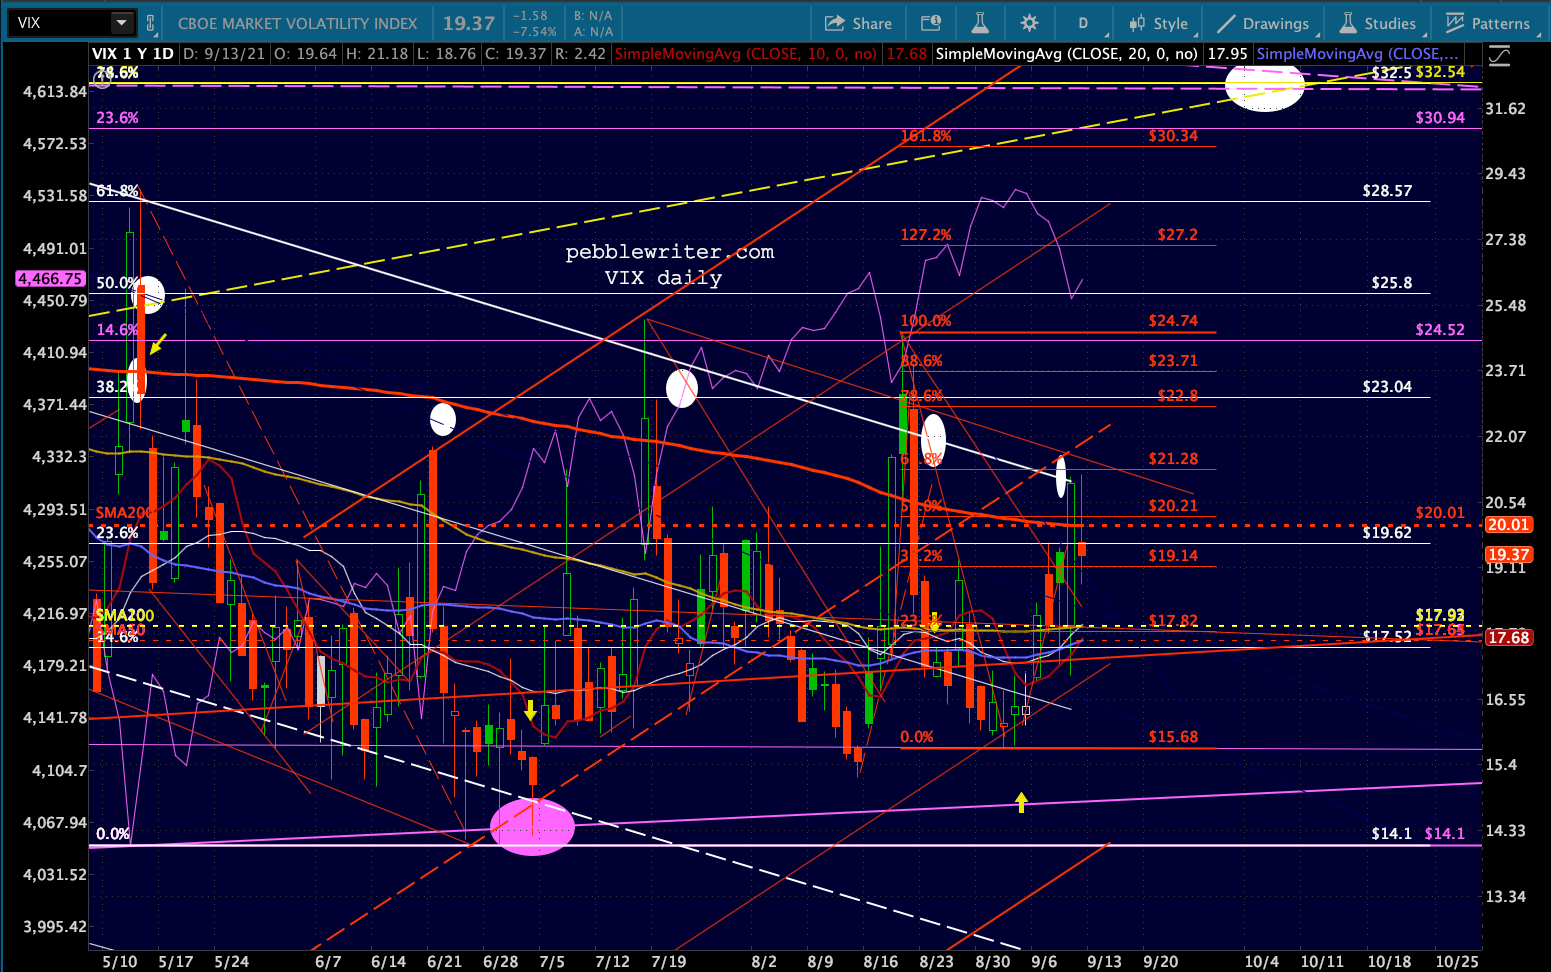 And CL and USDJPY are still fueling the bullish fire.
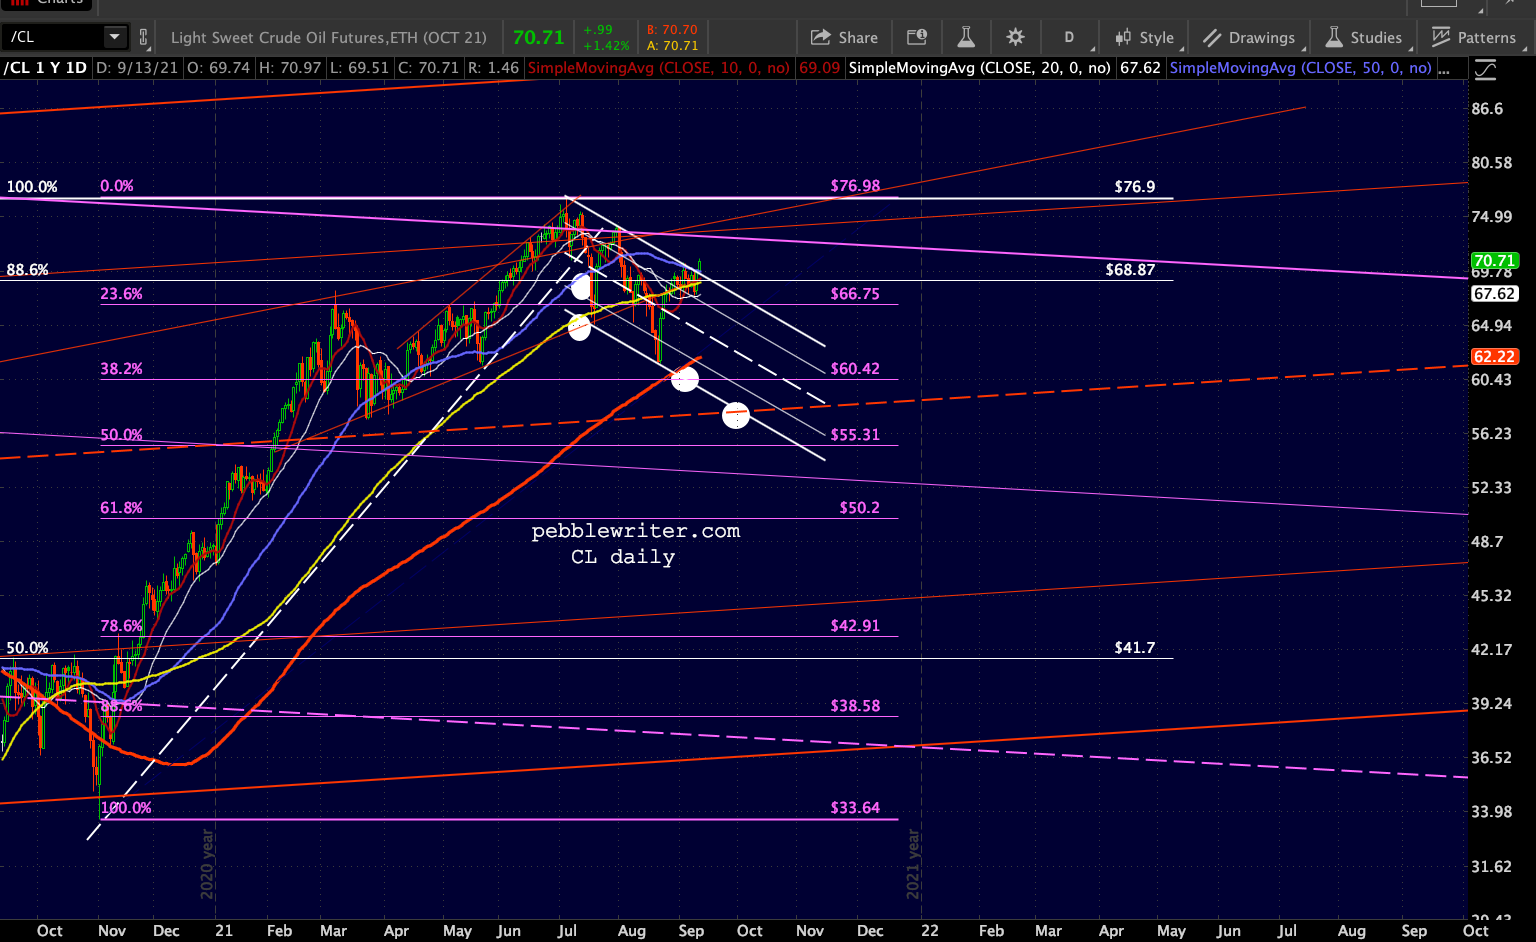
 GLTA…
GLTA…