In our Dec 29 update on XLF, we noted that the rising white channel from Aug 24 and an important TL would be tested were the SMA200 to hold.
Note that XLF just tested its 200-day moving average at the top of the falling red channel within the rising white channel which is, itself, rising within a larger falling white channel.
If it breaks out, then the top of the falling white channel and/or the rising white channel midline is the next overhead resistance to consider. If it doesn’t break out, then we should see the rising white channel fall and the yellow TL tested again
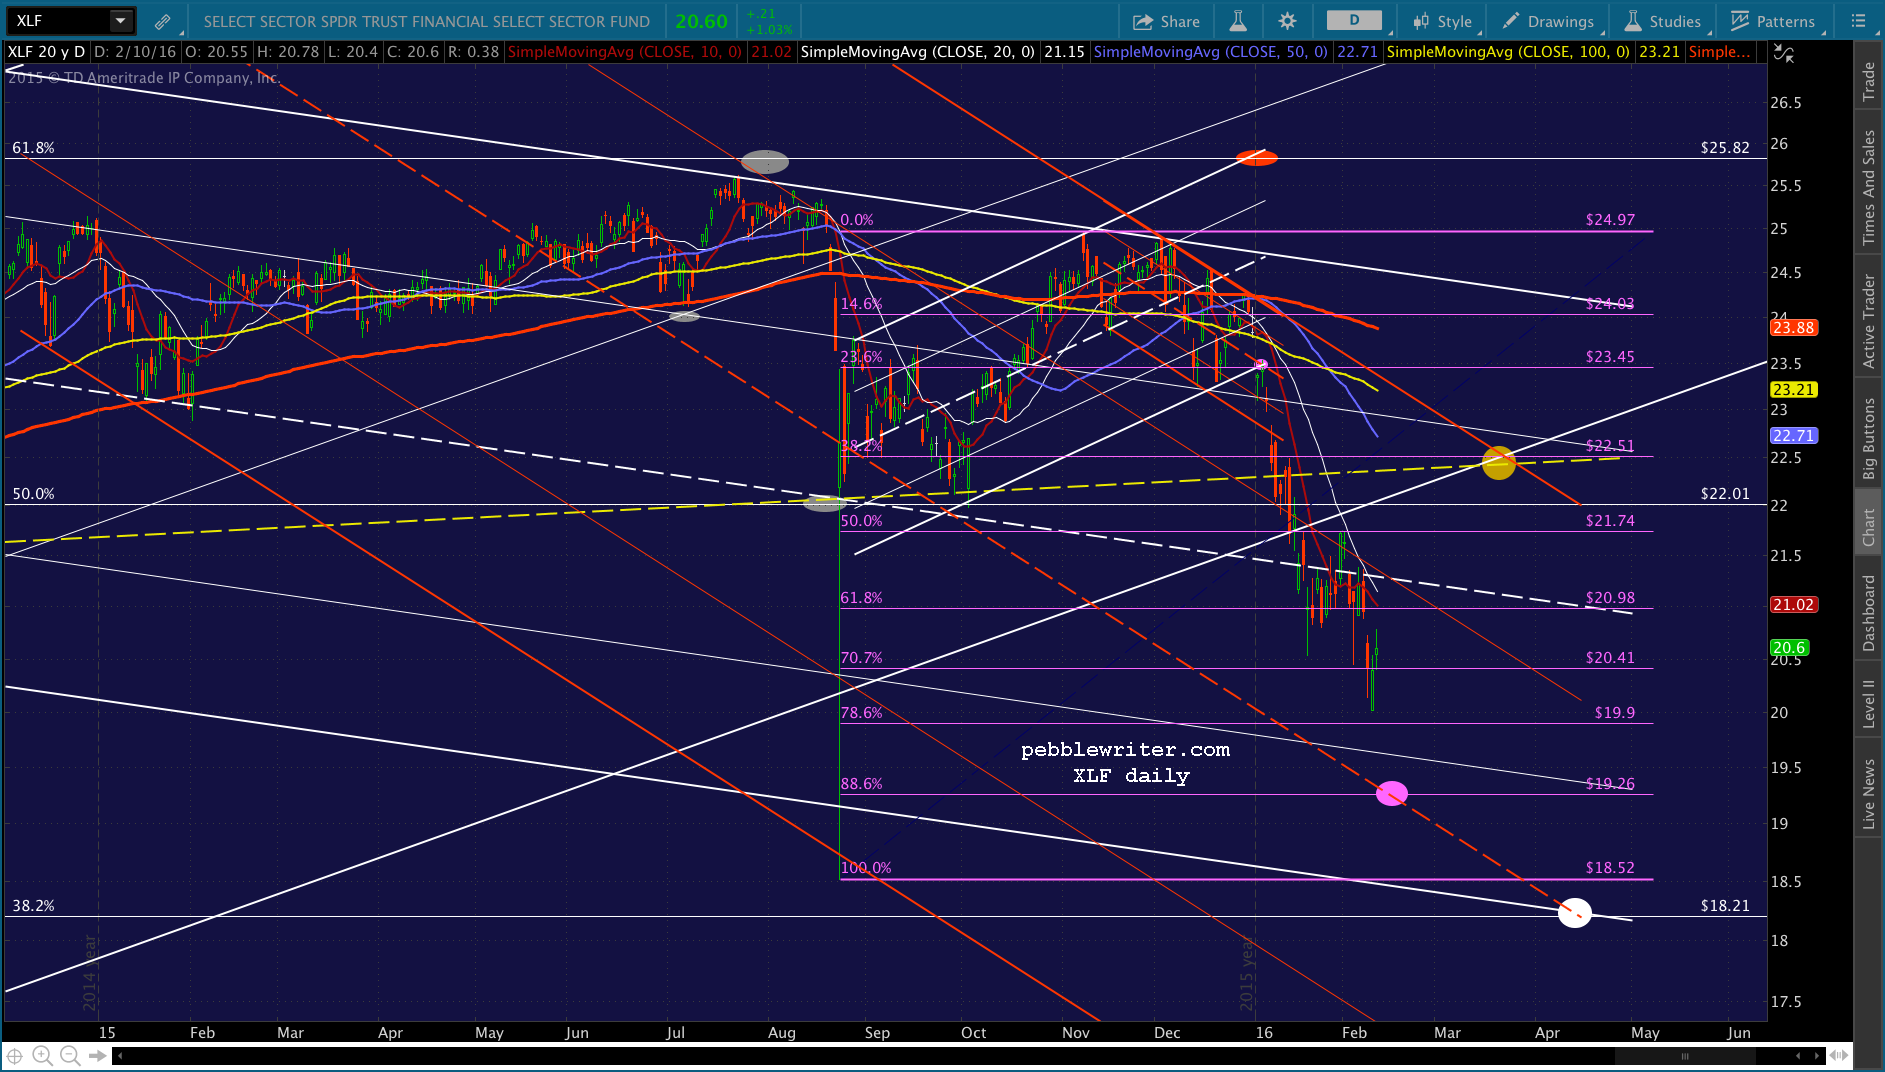
Not only did the rising white channel break down, but the yellow neckline failed as well. Given these bearish developments, we’re left to wonder just how much worse things can get.
 continued for members…Note that the drop also took XLF below the bottom of the rising white channel from 2009. The same thing happened on Aug 24. But, this time, there was no immediate USDJPY response to boost it back above intraday. It dropped out of the channel, and has remained there for almost a month.
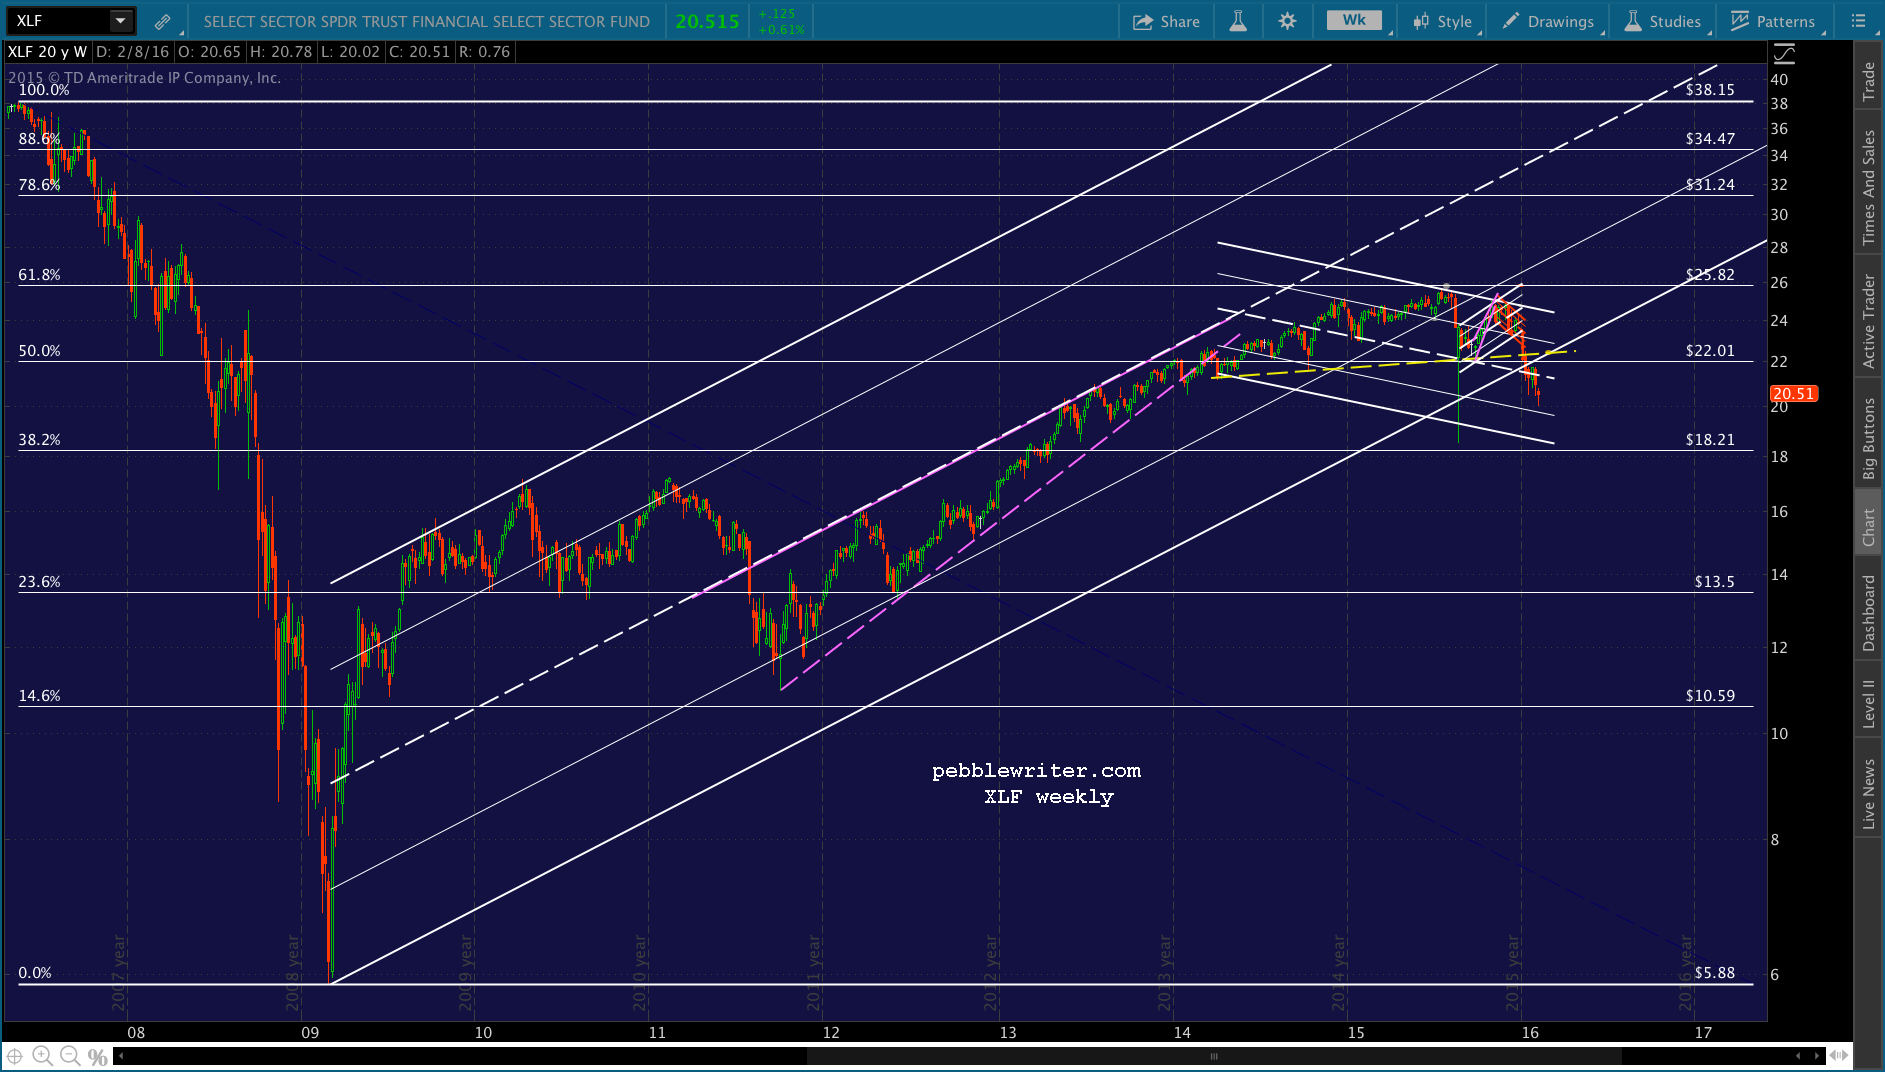 Looking ahead, I’ve identified a few potential targets. It think the next downside target has to be the purple .886 at 19.26 where it intersects with an expanded falling red channel midline in the next couple of days.
If it fails, the white .382 and that midline intersect in mid-April. This would also complete a pretty clear C=A corrective wave.
If it holds, the immediate upside case is pretty much limited to a backtest of the broken yellow TL and white channel bottom at 22.51 in mid-March.