

It’s been a while since we dedicated a post to all the currencies we follow. Since USDJPY, EURUSD and DXY are closing in on our targets, it seems like a good time to remedy that situation.


 Lately, the driver has been interest rates or, more specifically, interest rate expectations. Note that TNX finally officially tagged our 20.34 target.
 But, there are other factors at work. Just yesterday, JPM opined that the BoJ will likely drop short-term interest rates from -0.1% to -0.3% and the 10Y to -0.2% Why? They want to stay well ahead of the US in debasing their currency.
Another story which caught my eye was this one about a Danish bank offering negative interest rates on mortgages. Imagine taking out a mortgage and having the bank pay you interest.
continued for members… First, a quick look around at the rest of the market…
I’m still operating on the premise that the market is about to tank.  Of course, with every tick higher in SPX/ES, it gets harder to stick to that assumption.
 VIX is hanging in there, weak but no breakdown.
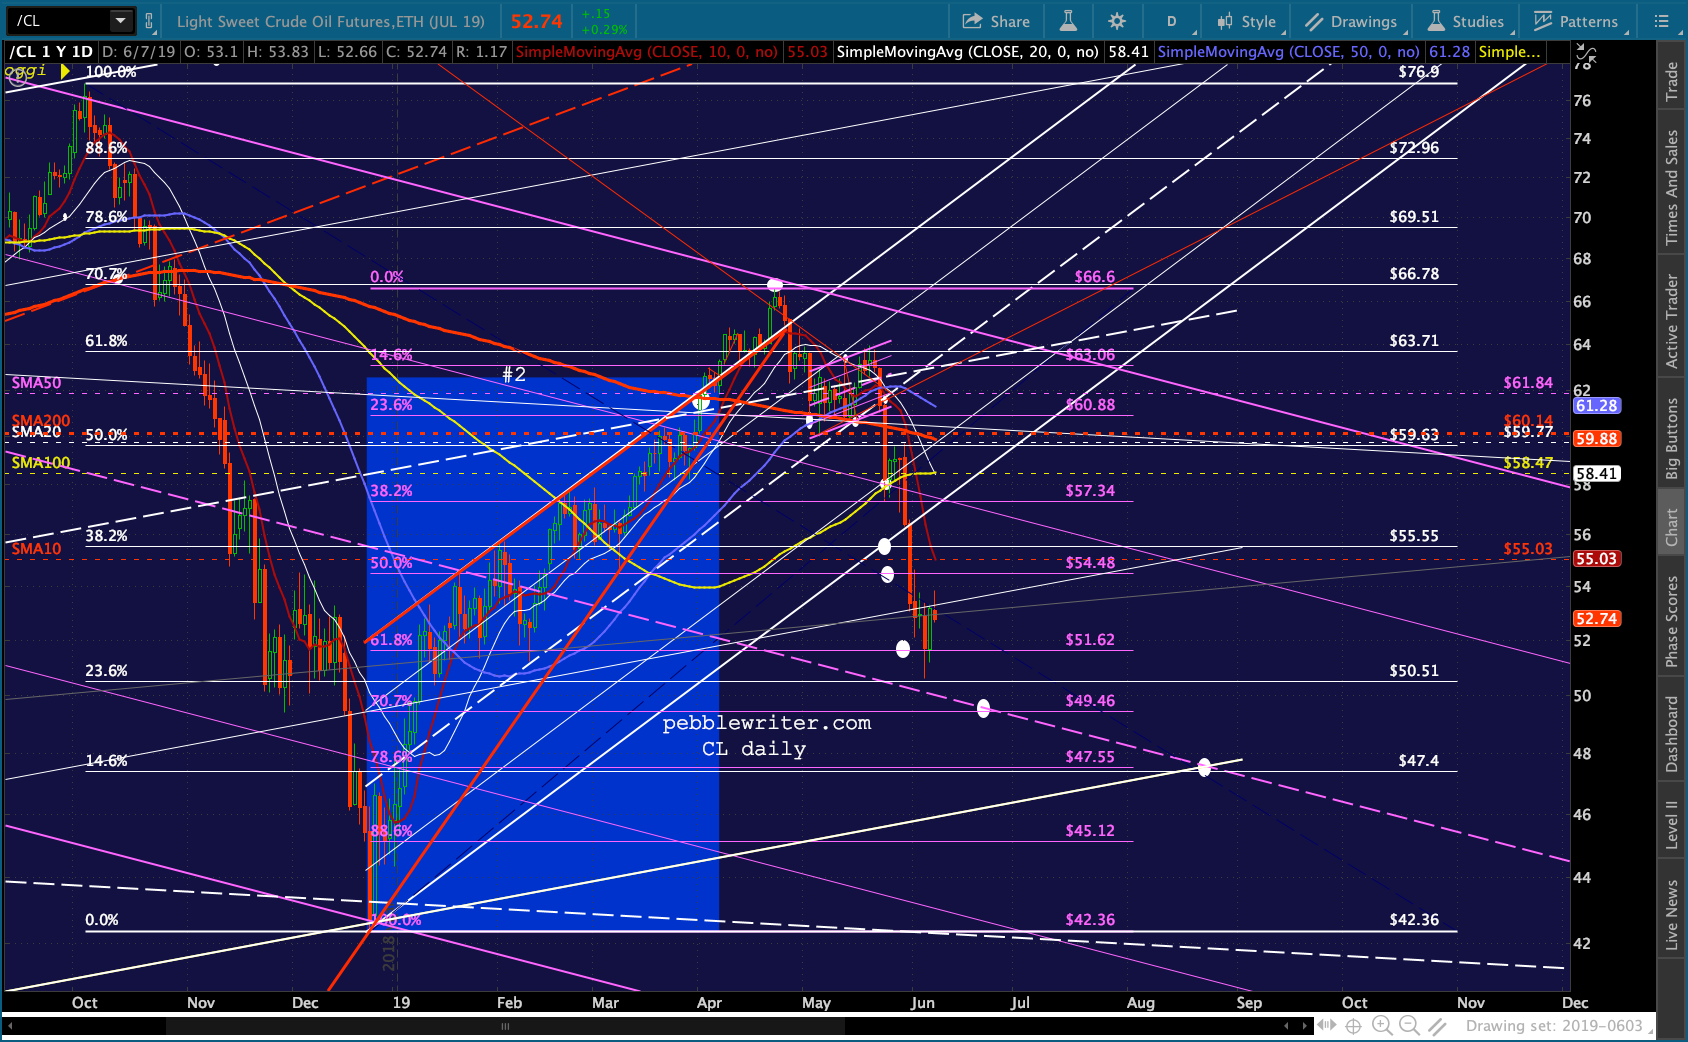
 Oil and gas…still looking weak, but waiting. The next leg down for each seem to align nicely with the Jun 19 FOMC decision.
 Now, on to the currencies…
We’ll start with the EURUSD, which readers will recall has to eventually make a decision between the rising white channel or the smaller falling red channel. There’s a rising yellow channel that works pretty well because its mideline is such an excellent fit with reversals beetween 2003 and 2018. I think EURUSD will eventually test its bottom.  But, for now, it’s being very careful not to dip below a backtest of the falling white channel it broke out of in Jul 2013 — even as it remains in a falling purple channel dating back to Dec 2017. This equilibrium smacks of a deal that apparently suits both the FOMC and ECB.
 At its current levels, it’s not only testing the purple channel top but the SMA200 as well. If it is able to break above both, then the most interesting target is the top of the red channel at around 1.21 in November. This would mean a sharp weakening of the dollar/strengthening of the euro — something that practically nobody believes is going to happen.
The more popular view is that while the USD will continue to weaken, the other currencies will do the same — potentially to the same degree in order to maintain their relative “discount.” This, I believe, argues for EURUSD to continue riding the white channel top into the future, bouncing very slowly lower until it reaches intersecting support such as the white channel bottom (1.0930 – the red 1.618 in late 2020.)
This would require a breakout of the falling purple channel, of course, which might be happening right now. The pair is pushing higher in order to reach the SMA200, which is a breakout of the purple channel. If it doesn’t immediately retreat, the purple channel has been broken.
 If the pair breaks down, there are all sorts of interesting targets – starting with the 1.618 at 1.0935 early next week. But, we’ll cross that bridge when we see how it reacts at the SMA200.
In the meantime, I still consider EURUSD as not worth trading. A 3.8% move over 16 months is hardly worth the effort. I would wait until it breaks down or out.
The USDJPY is more interesting. It has been holding off on a tag of its .618 all week. It could tag it as soon as this weekend or as late as Jul 1. If it sticks to my preferred sell-off date, it’ll happen around Jun 19 – which is about where the red channel midline crosses the red .618 Fib. But, of course, the longer it takes the more of a breakdown of the rising purple channel that drop would represent.
Note the large, yellow triangle that originally utilized the Mar 2019 lows as a guide for the lower bound and ignored the long tail on Jan 2. Since USDJPY has now broken below that lower bound, the triangle can be considered to have broken down. This is just as well, as the large white channel had already broken down.
 Note that within the large white channel, we originally had a smaller, steeper rising red channel. It broke down in Mar 2016 and was ultimately replaced by the white one.
The white one is just as flawed as the red one. It is legitimized, however, by a pretty well-fitting midline in 2013-2014. If central banks want to avoid the next equity correction, they would construct a new rising channel which rises at a lesser slope and accommodates the recent lows — something I call channel tilting.
But, I have yet to find a good alternative based on recent lows. About the only one that makes any sense at all is the white channel shown below. It’s not a great fit, but it’s the best I can find. If it plays out, it would mean a drop to the white .886 at 101.23 very soon. If it doesn’t hold, it would suggest a drop to the larger scale .618 at 94.77 — even though the intersection between that Fib and the falling white channel top has already passed.
 One of the more interesting things about the USDJPY is how different the very long-term chart looks from the ones displayed above. Consider this one dating back to 1971. It’s arithmetic rather than logarithmic. But, talk about trends!
 Looking at a closeup of 1990 to 2019, we can see that breakouts have almost always been bullish for stocks and breakdowns or failures to break out have almost always been bearish for stocks.
 Aside from that, note how important it is for the pair to hold the triangle bottom and ultimately break out above the dashed, purple TL of resistance. A drop below the former high at 99ish could cause a great deal of trouble for stocks unless it’s offset by a sharp rise in CL or collapse in VIX.
more later…