

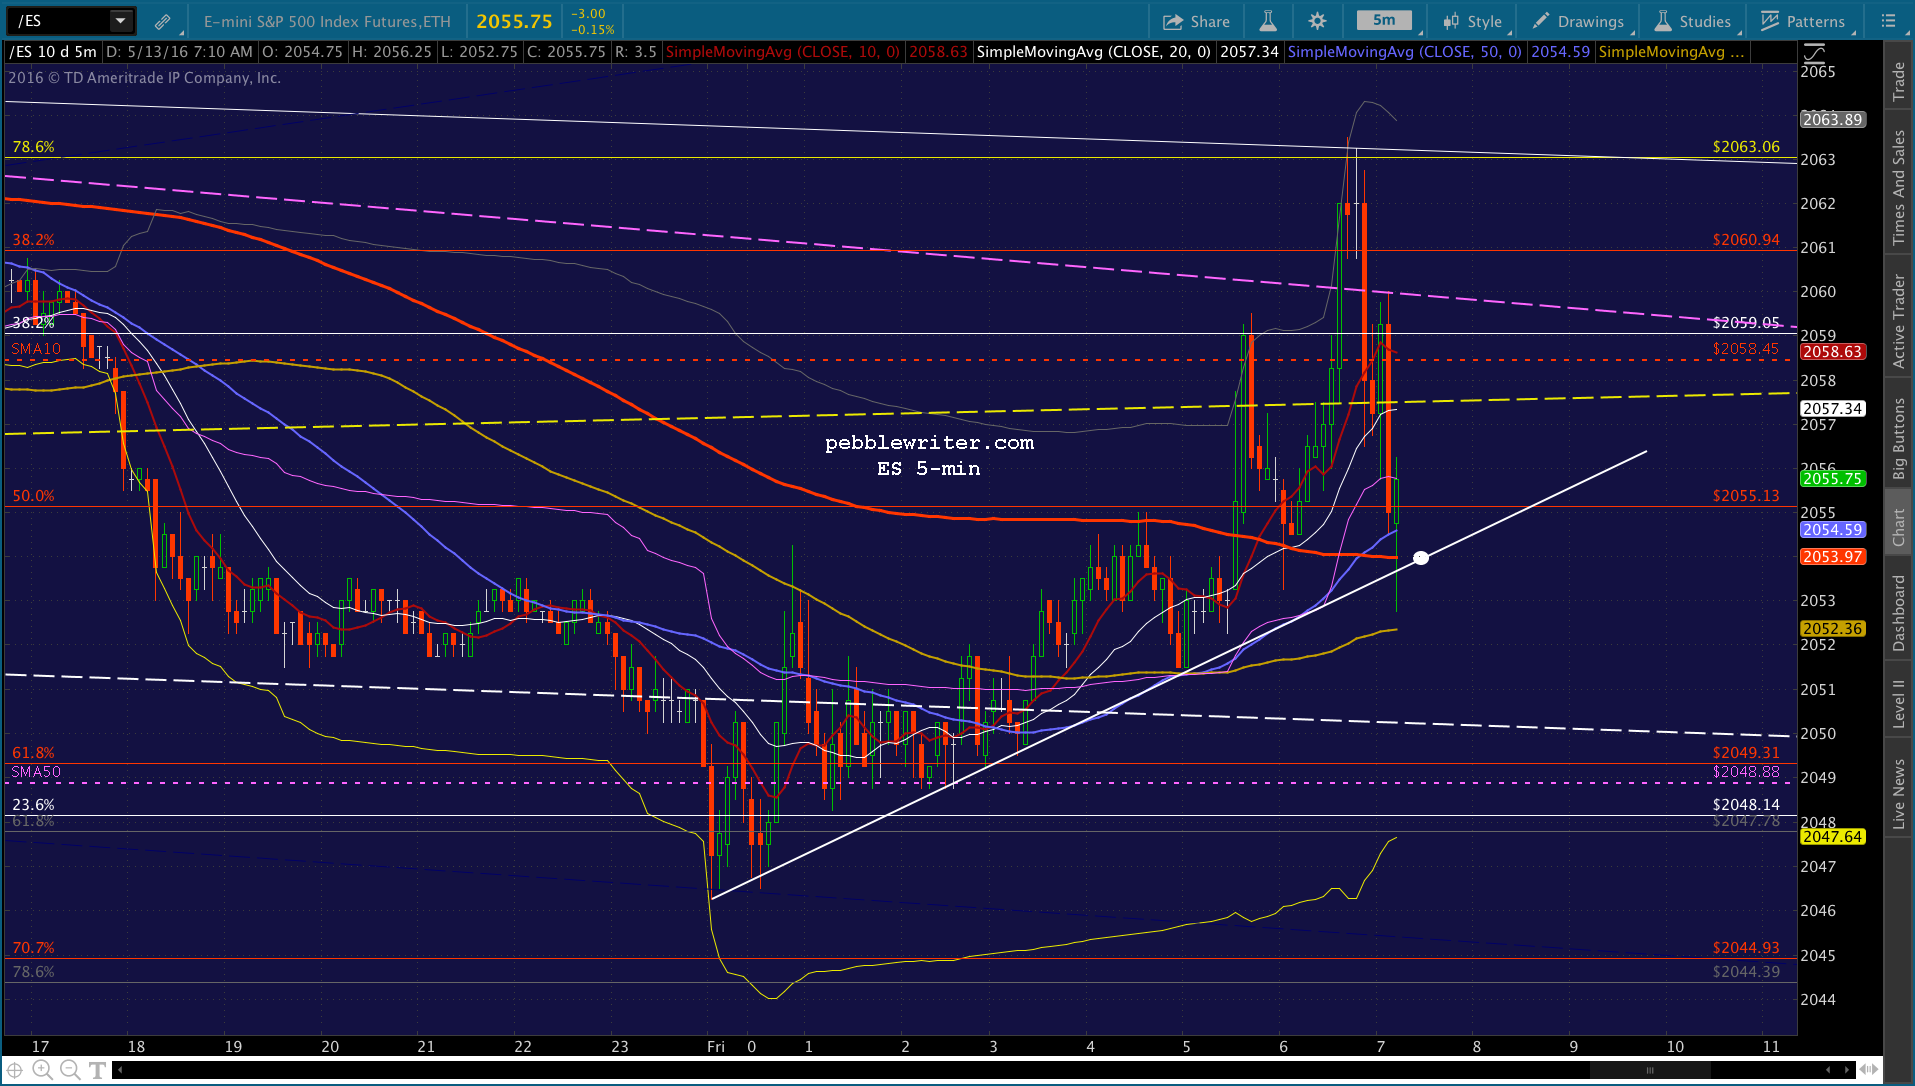
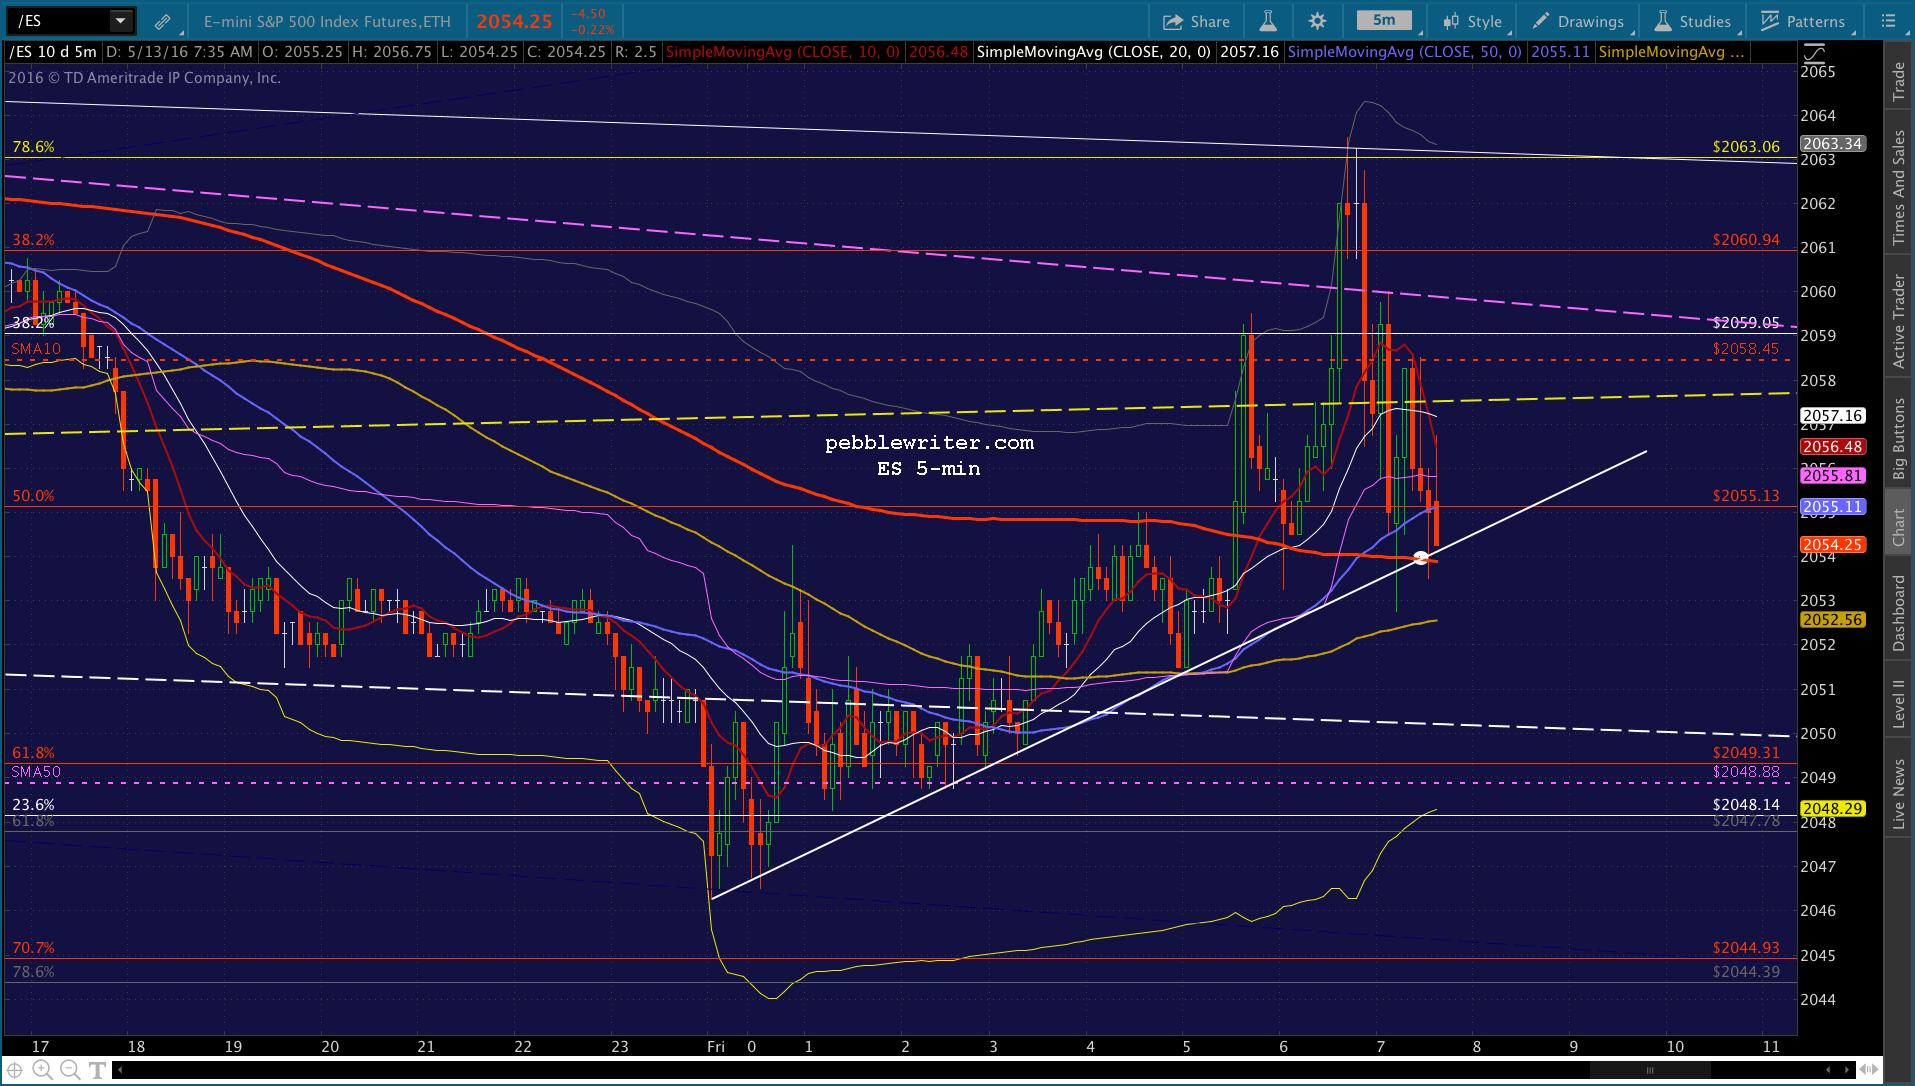
Happy Friday the 13th, everyone. We take a look today at the yellow H&S Pattern [what’s this?], seen here on the eminis. There are multiple patterns within the pattern – including the red one which has already played out.  But, the big yellow one has been very coy. It completed on May 4, even spent two sessions below the neckline before popping back above it. Yesterday, it dropped back below for the the 7th time.
We care about these patterns because they are great forecasters of future moves — this one targeting 1981. But, what does it mean when they suffer from a failure to follow through?
The obvious answer is that TPTB are working very hard in the background to prevent a big drop. Just look at USDJPY this morning, and you’ll see what I mean. Honestly, is there any reason why a slightly higher than expected, but still anemic, retail sales figure (which is probably rubbish in the first place) should send the USDJPY spiking like that? Of course not. But, the yen carry trade is still fresh enough in everyone’s minds (more importantly, the algos’) that it turned ES’ 7-pt loss into a 1-pt gain. Happens nearly every day.
continued for members…
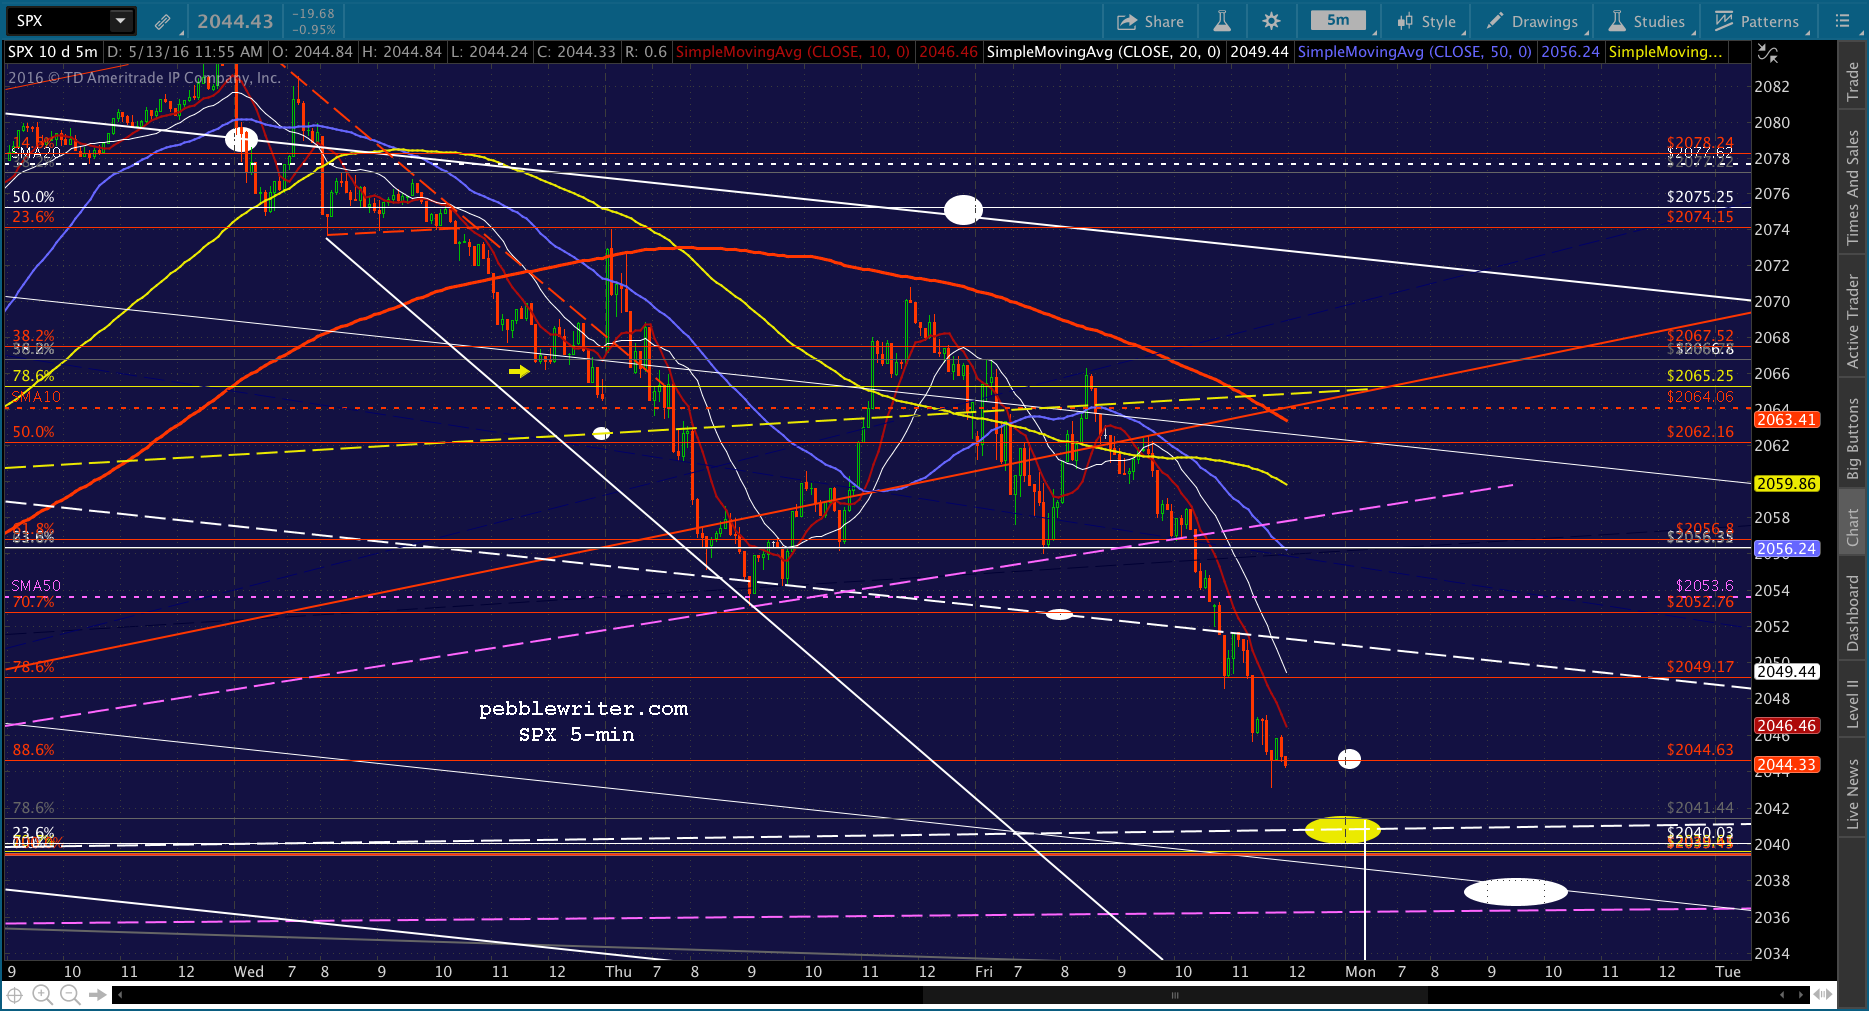
We saw, yesterday, how SPX worked diligently to regain its neckline, only to close right at it.  Understandable, as it targets 1988 — a massive (sarc) 3% drop from current prices.
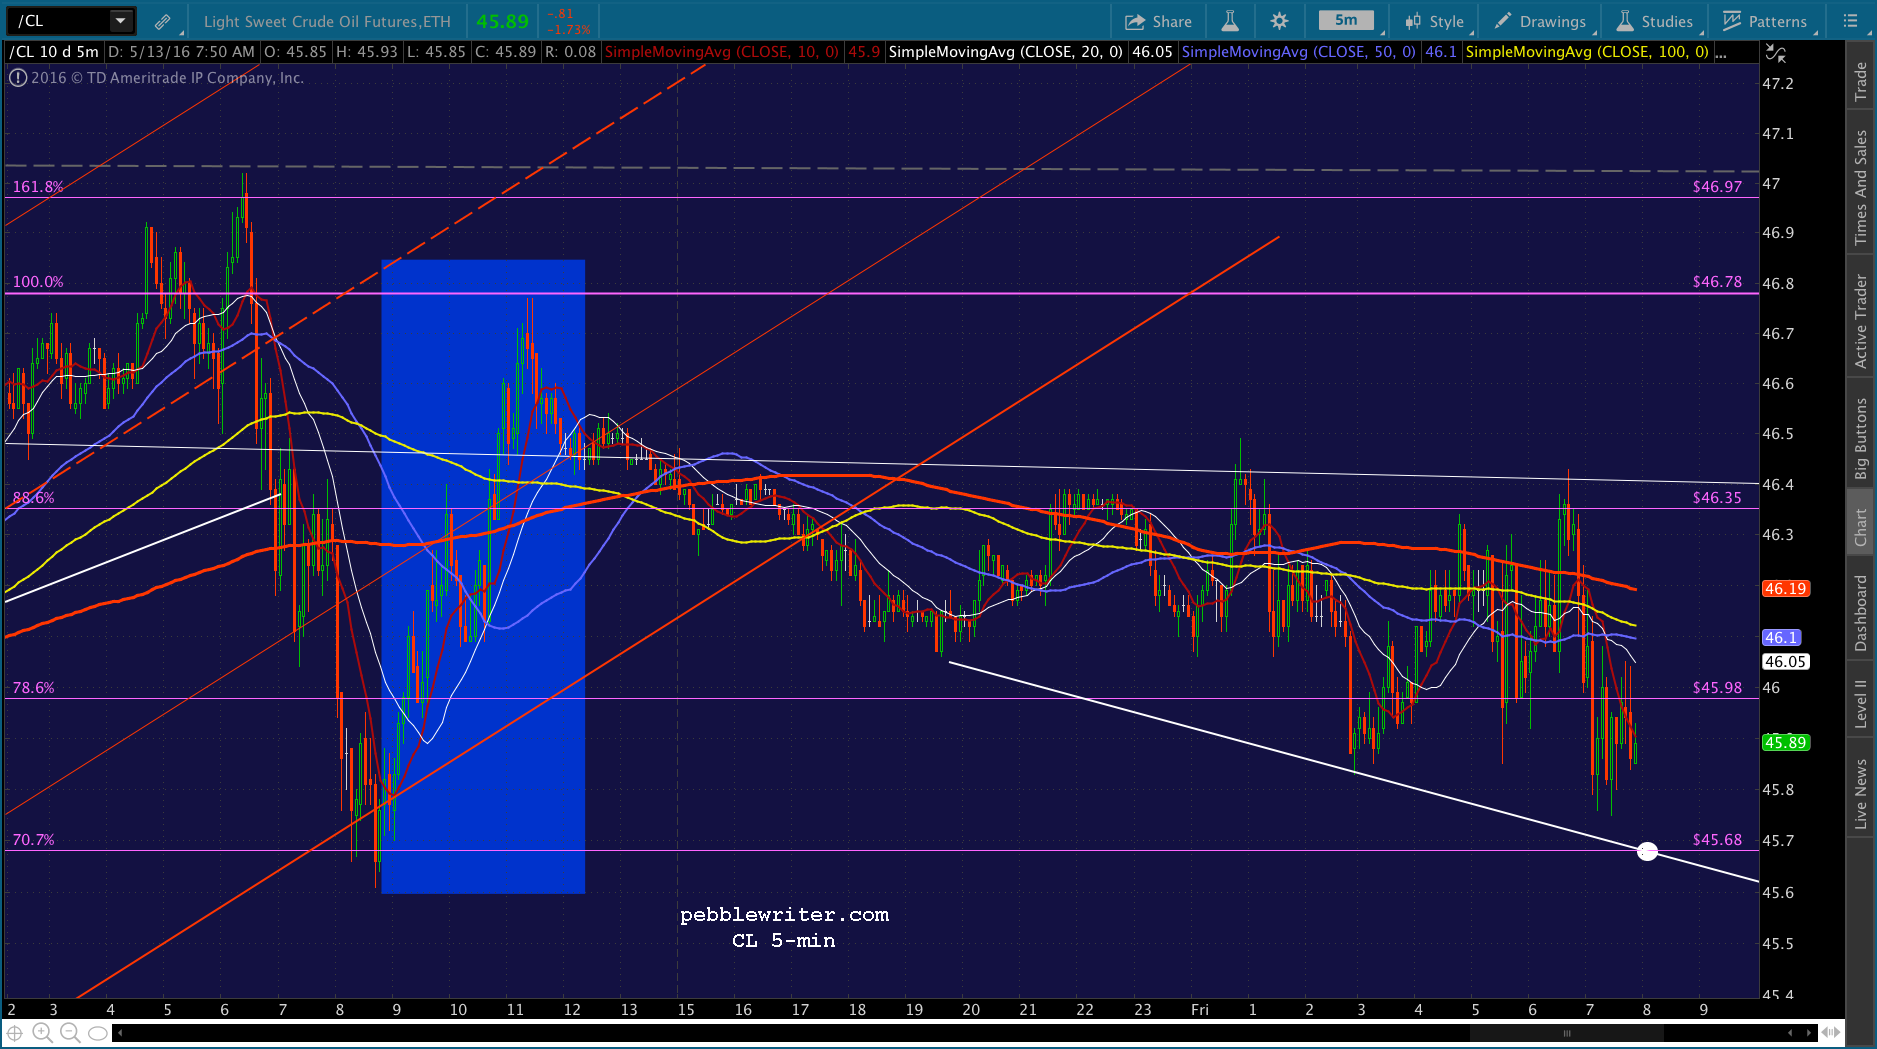
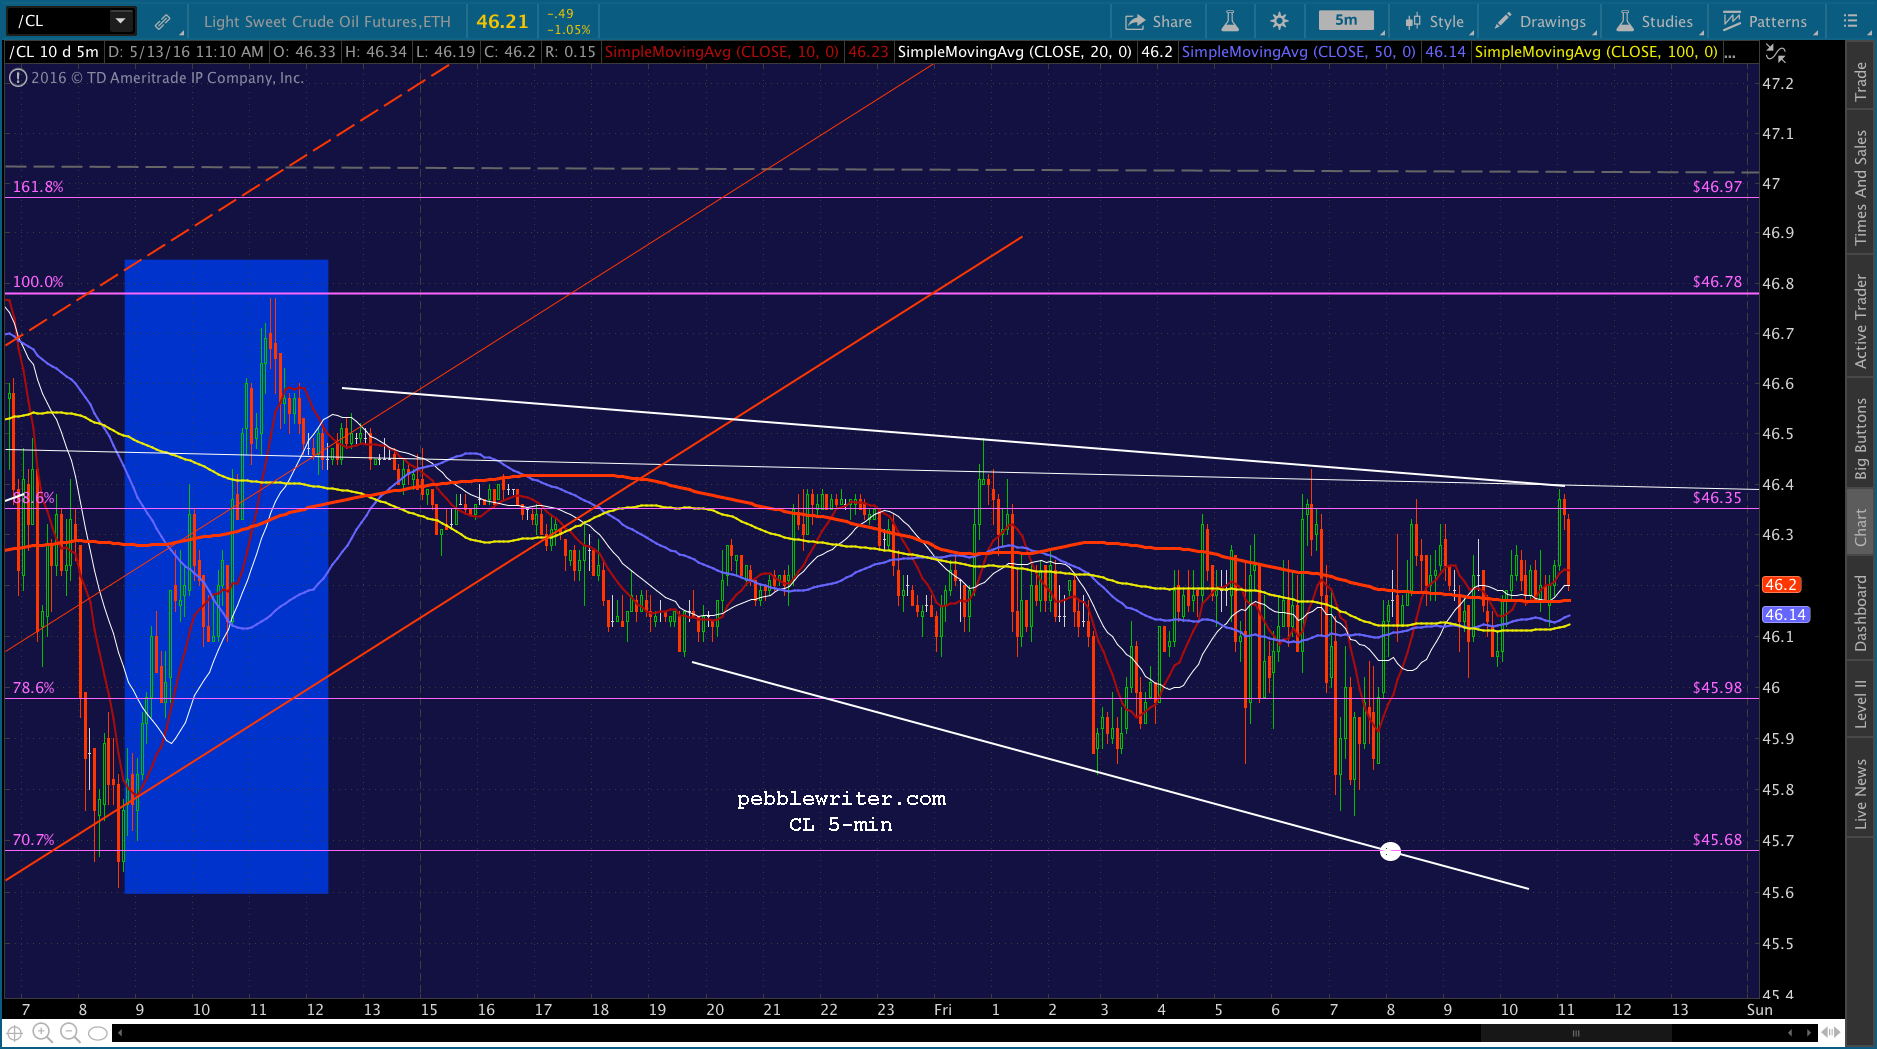
 We’ll keep an eye on the usual suspects today: CL and USDJPY.
 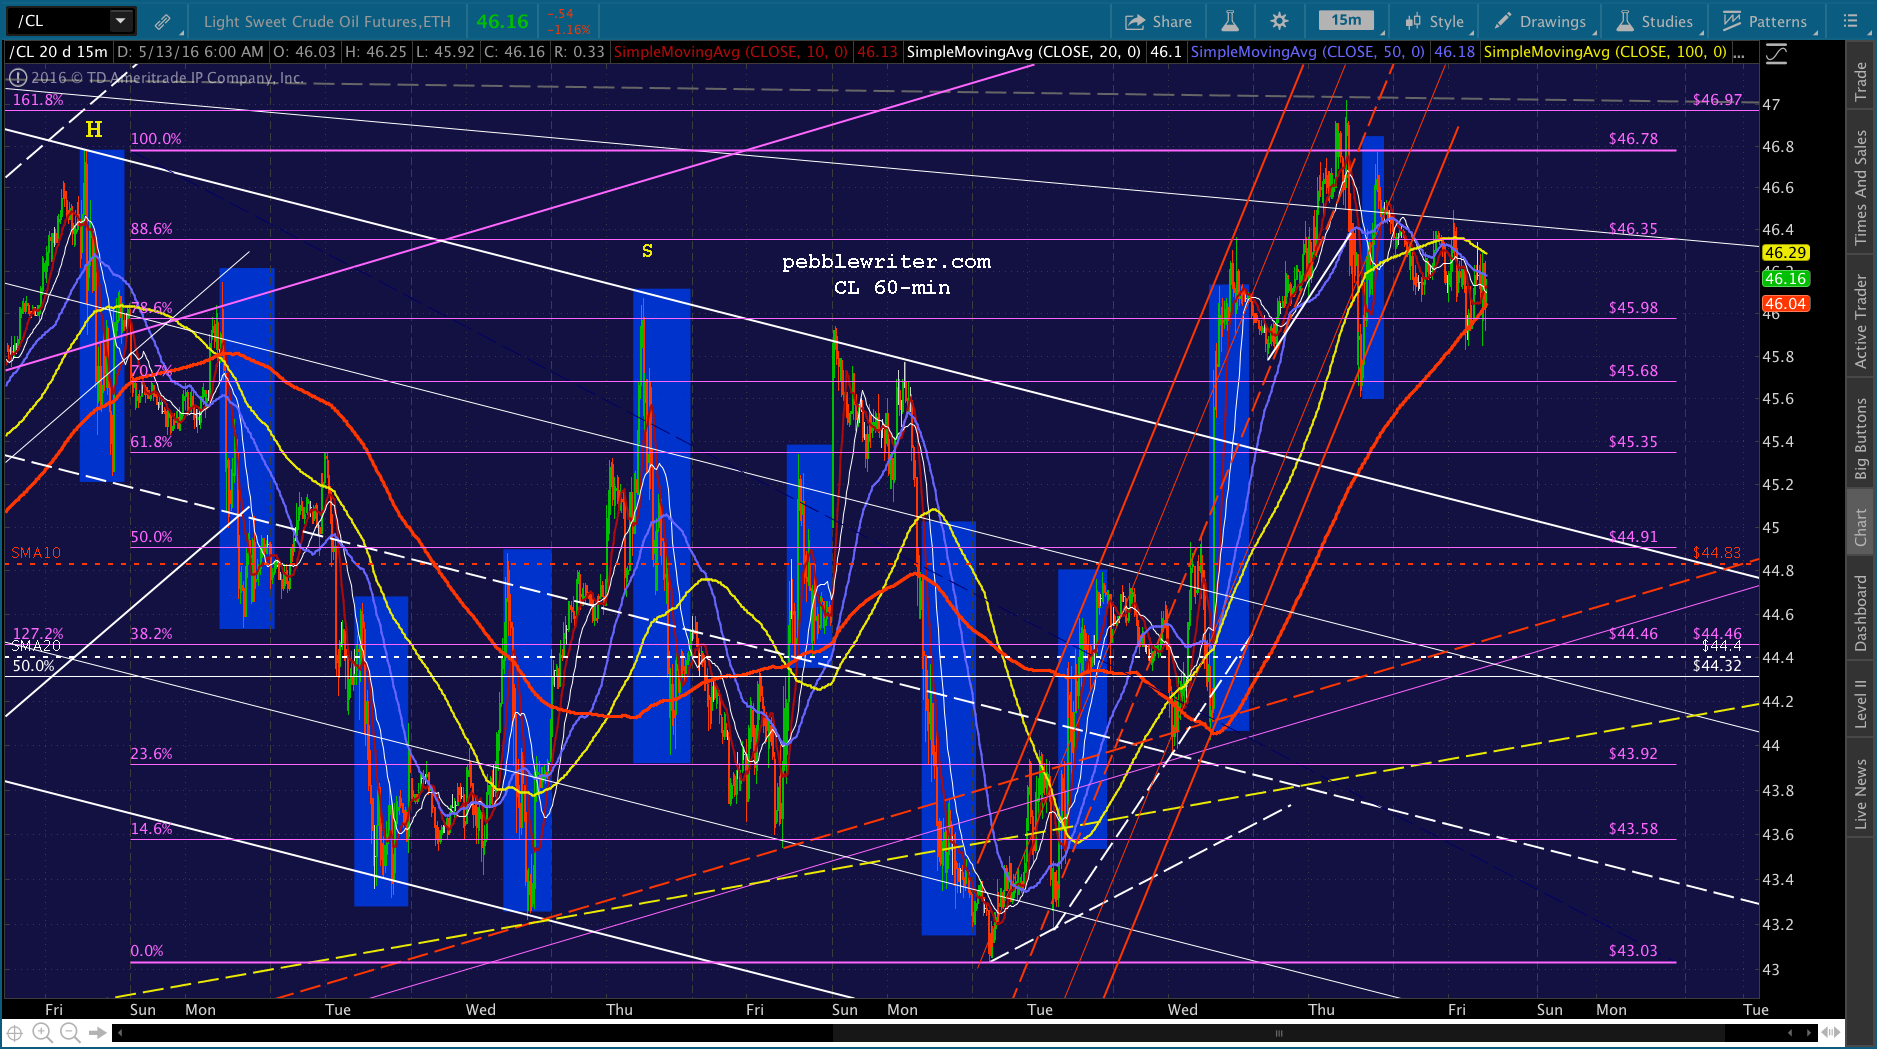 As long as their movements are dictated by central banks rather than traditional fear and greed of traders and investors, the H&S won’t play out. But, one has to wonder how long TPTB can continue to plug all the holes appearing in this dike we call a market.
UPDATE: 9:42 AM
SPX has rallied above the neckline to the SMA5 20 as ES reached the white channel .786 line. With inventories and consumer sentiment coming up at 10AM, I’d stay on the sidelines. This could break either way, with the upside target being the white channel top at 2074 and the downside being the white channel midline at 2052, followed by the .786 at 2049 and .886 at 2044.63.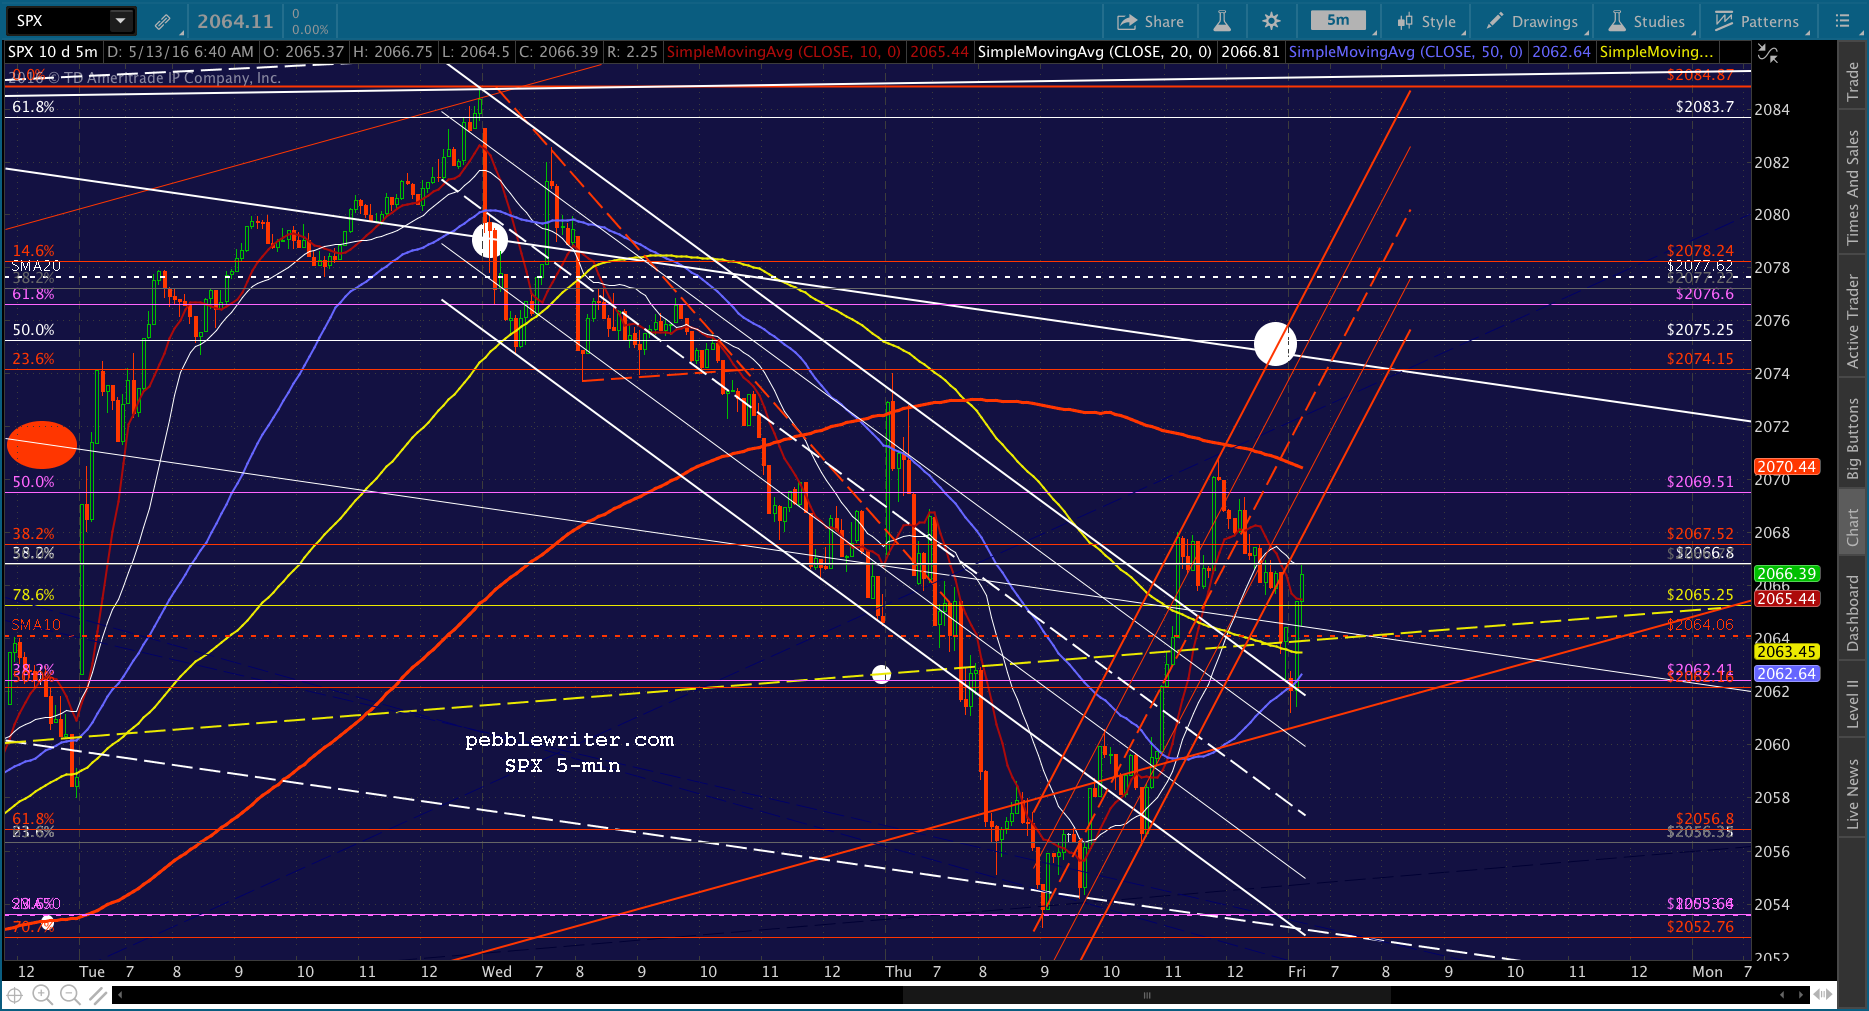 CL is back to the top of the falling white channel, and USDJPY is threatening to finally reach the purple .618. Both represent a breakout opportunity if TPTB so desire.
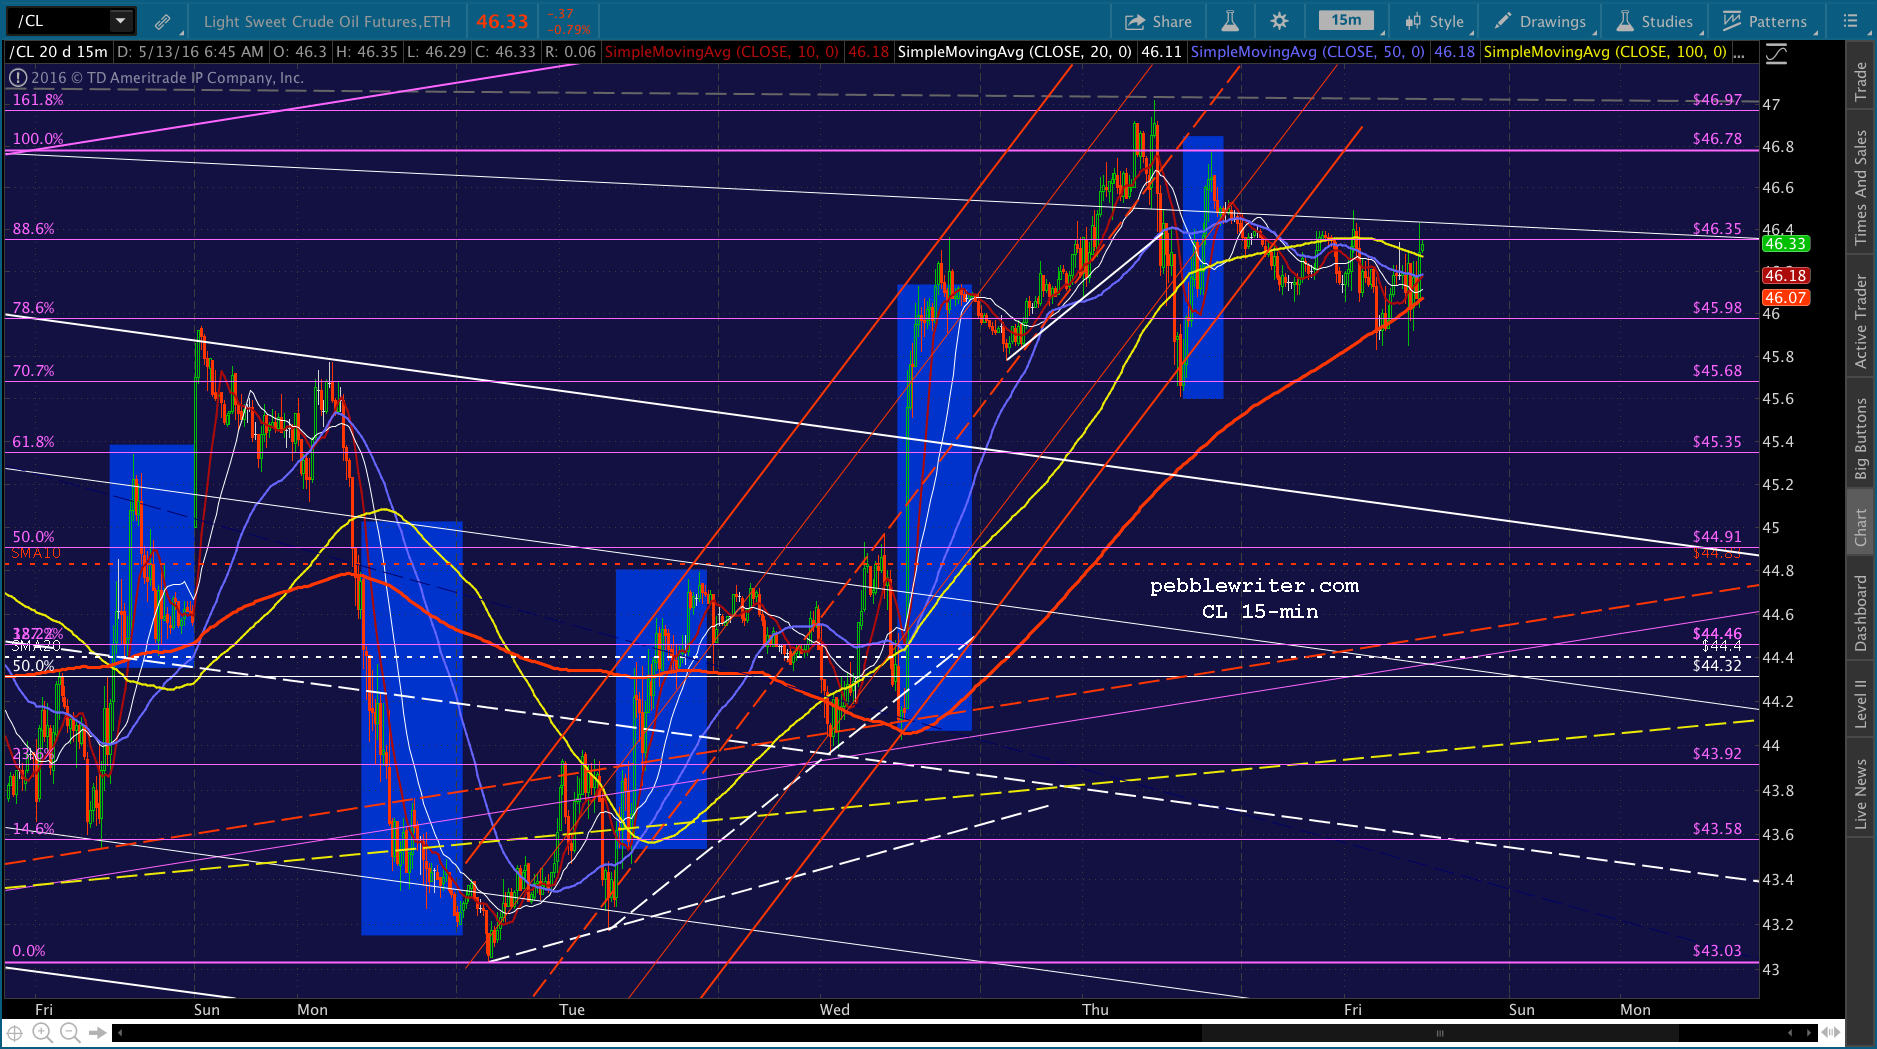
 UPDATE: 10:06 AM
Sentiment was higher, but business inventories doubled. Not good. Big spike by USDJPY up to the .618, and then it’s backing off. I’d short SPX here at the yellow neckline and see if it can make it back down to the red channel bottom or lower.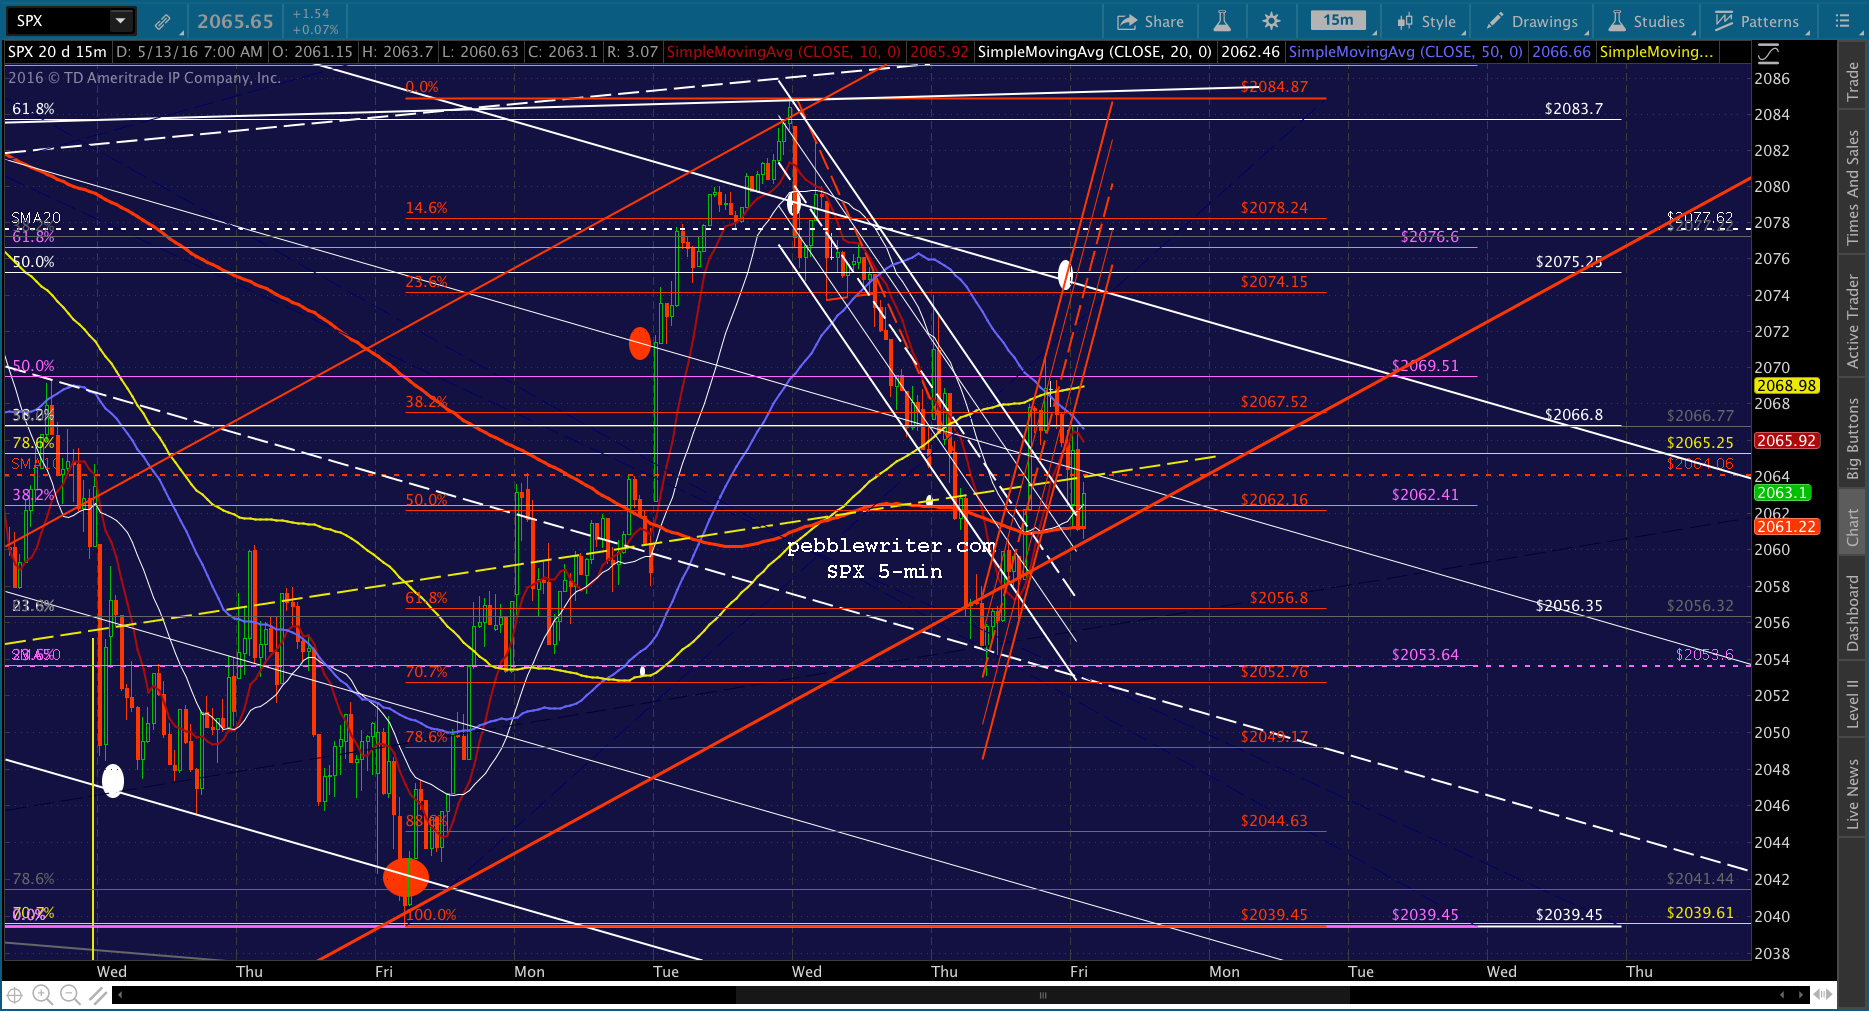
 It has support at 2058, as ES has TL support at 2054.
UPDATE: 10:10 AM
ES just bounced off support, so SPX could find its feet here. Back to cash.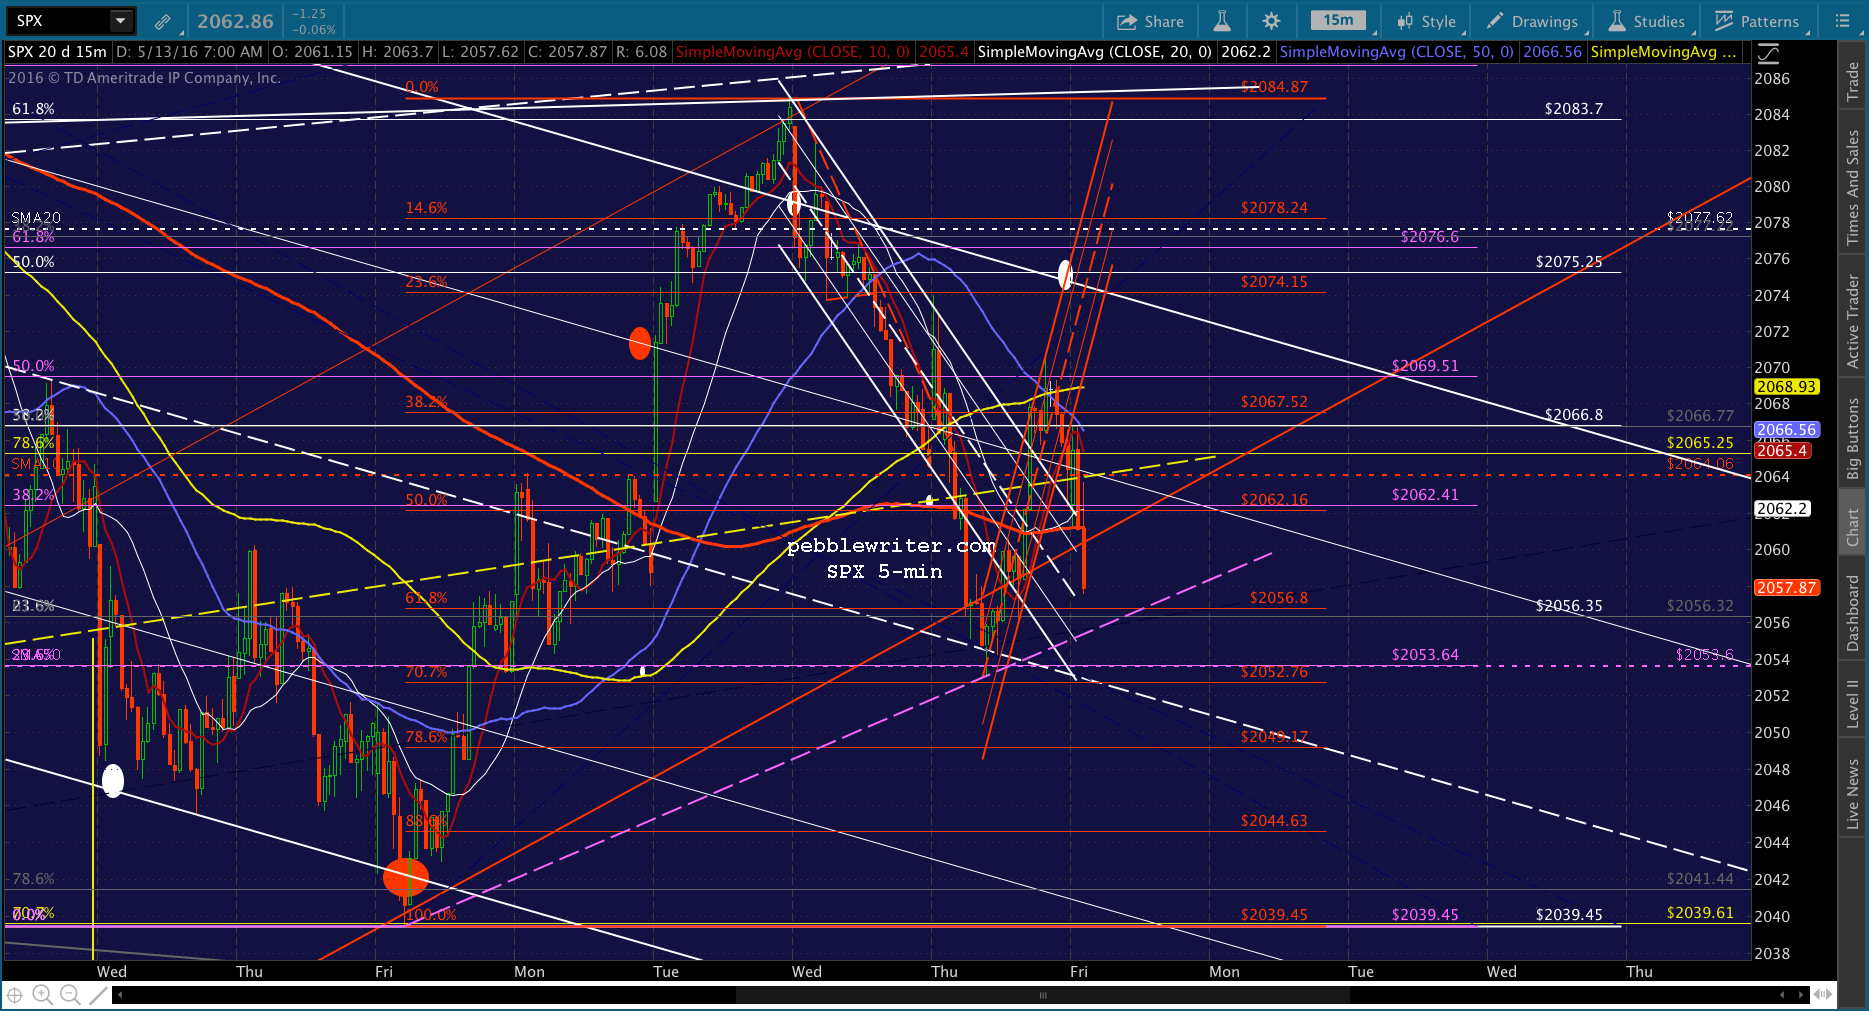
 UPDATE: 10:15 AM
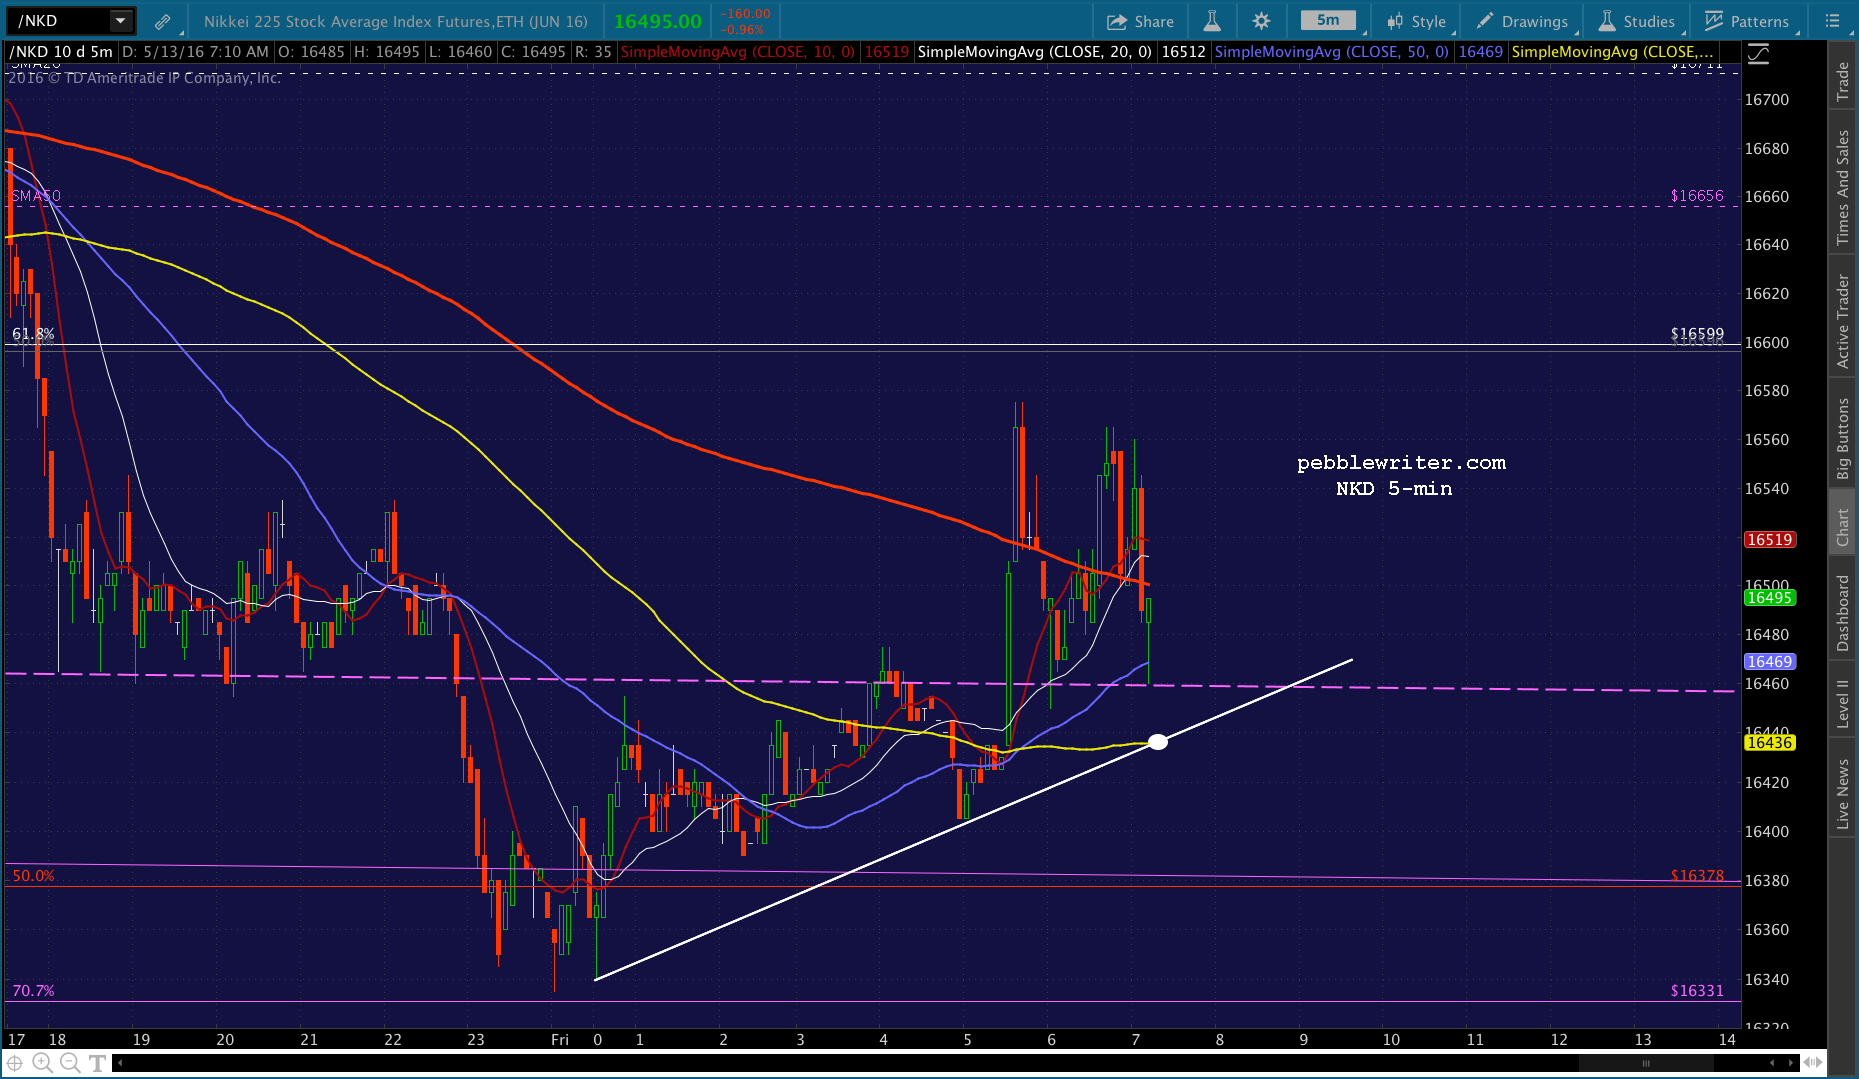
That should do it. Back to short with tight stops., as indicated by USDJPY and NKD. Targeting ES 2048.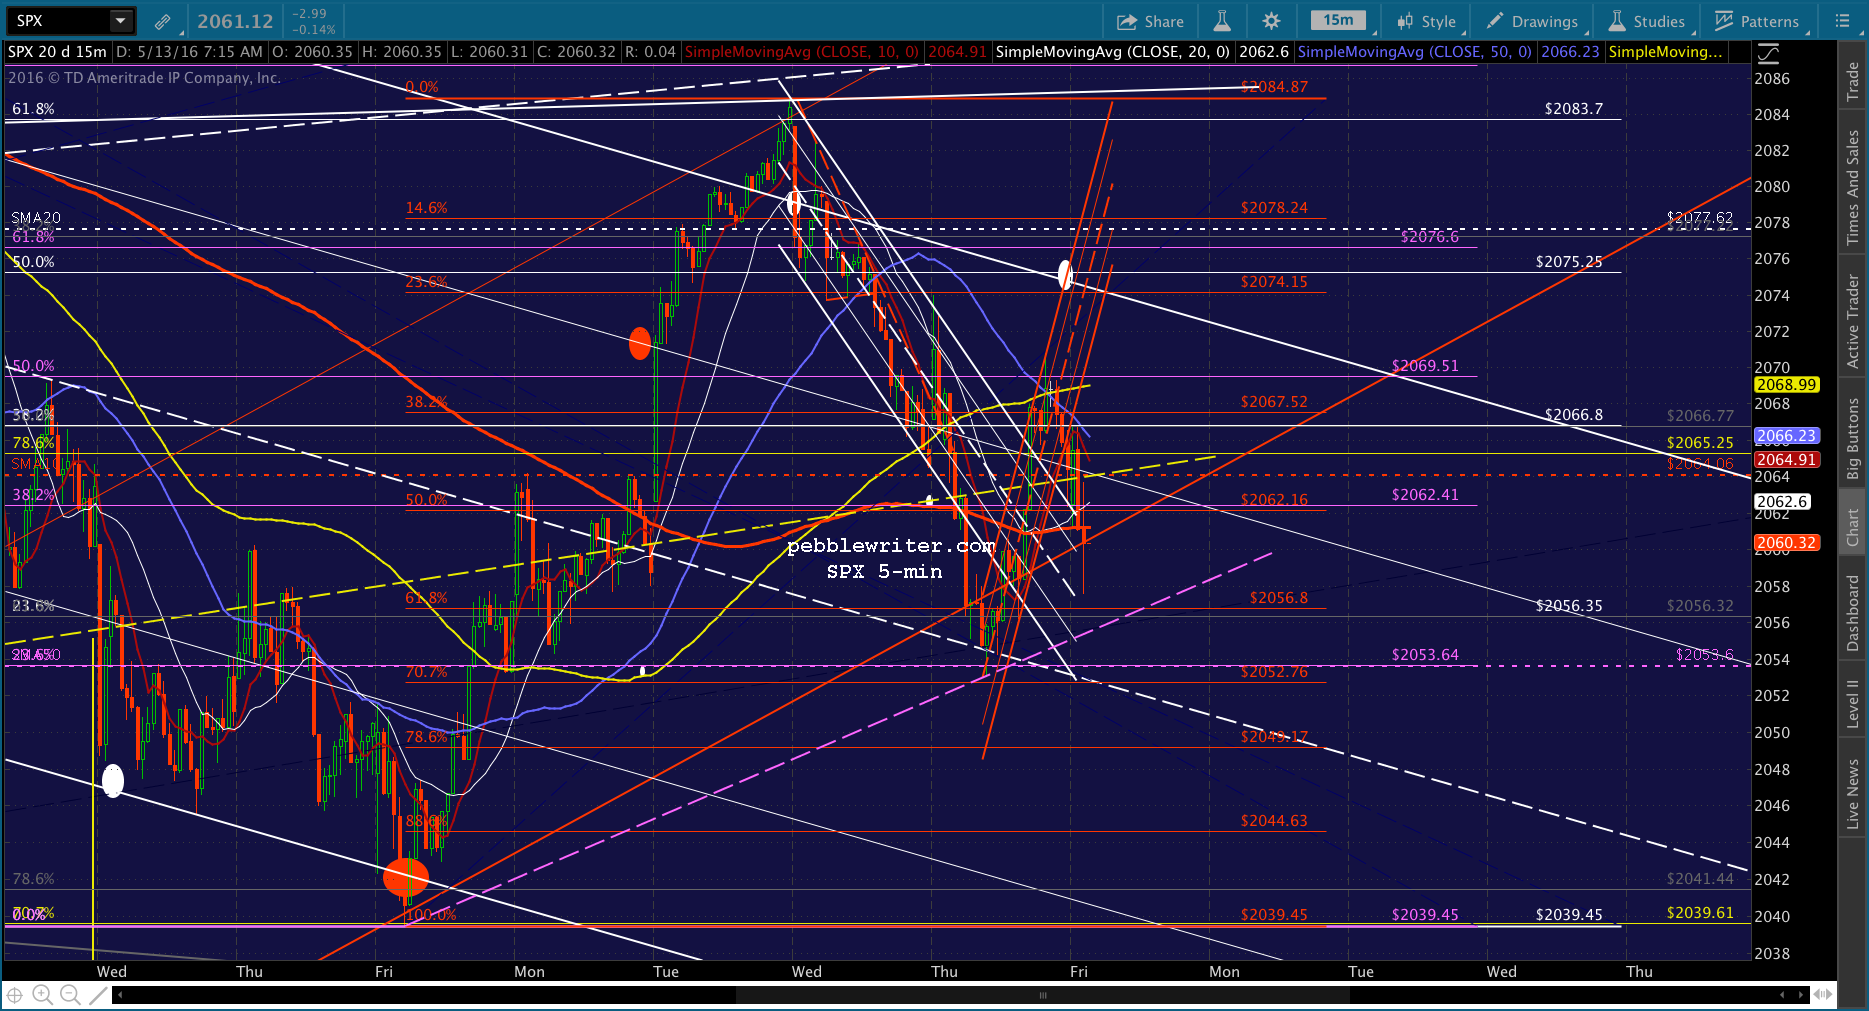

 UPDATE: 10:36 AM
While it should be plunging, USDJPY has so far been very chary, giving up little of its spike. This has allowed ES to remain above the white TL.
If USDJPY can get down to a backtest of the broken white wedge at 108.88, then SPX should follow through to the white midline at 2052.76. 

 UPDATE: 10:50 AM
They’re taking a stand here at the purple TL. It’ll probably fail eventually, but for now the bigger risk is a bounce. I need to run out for 20 minutes, so I’d revert to cash, or at least put a stop in at these levels.
If you can wait it out, CL seems to be headed for 45.68. I still see USDJPY dropping to backtest the wedge. Together, those point to lower prices as described above. 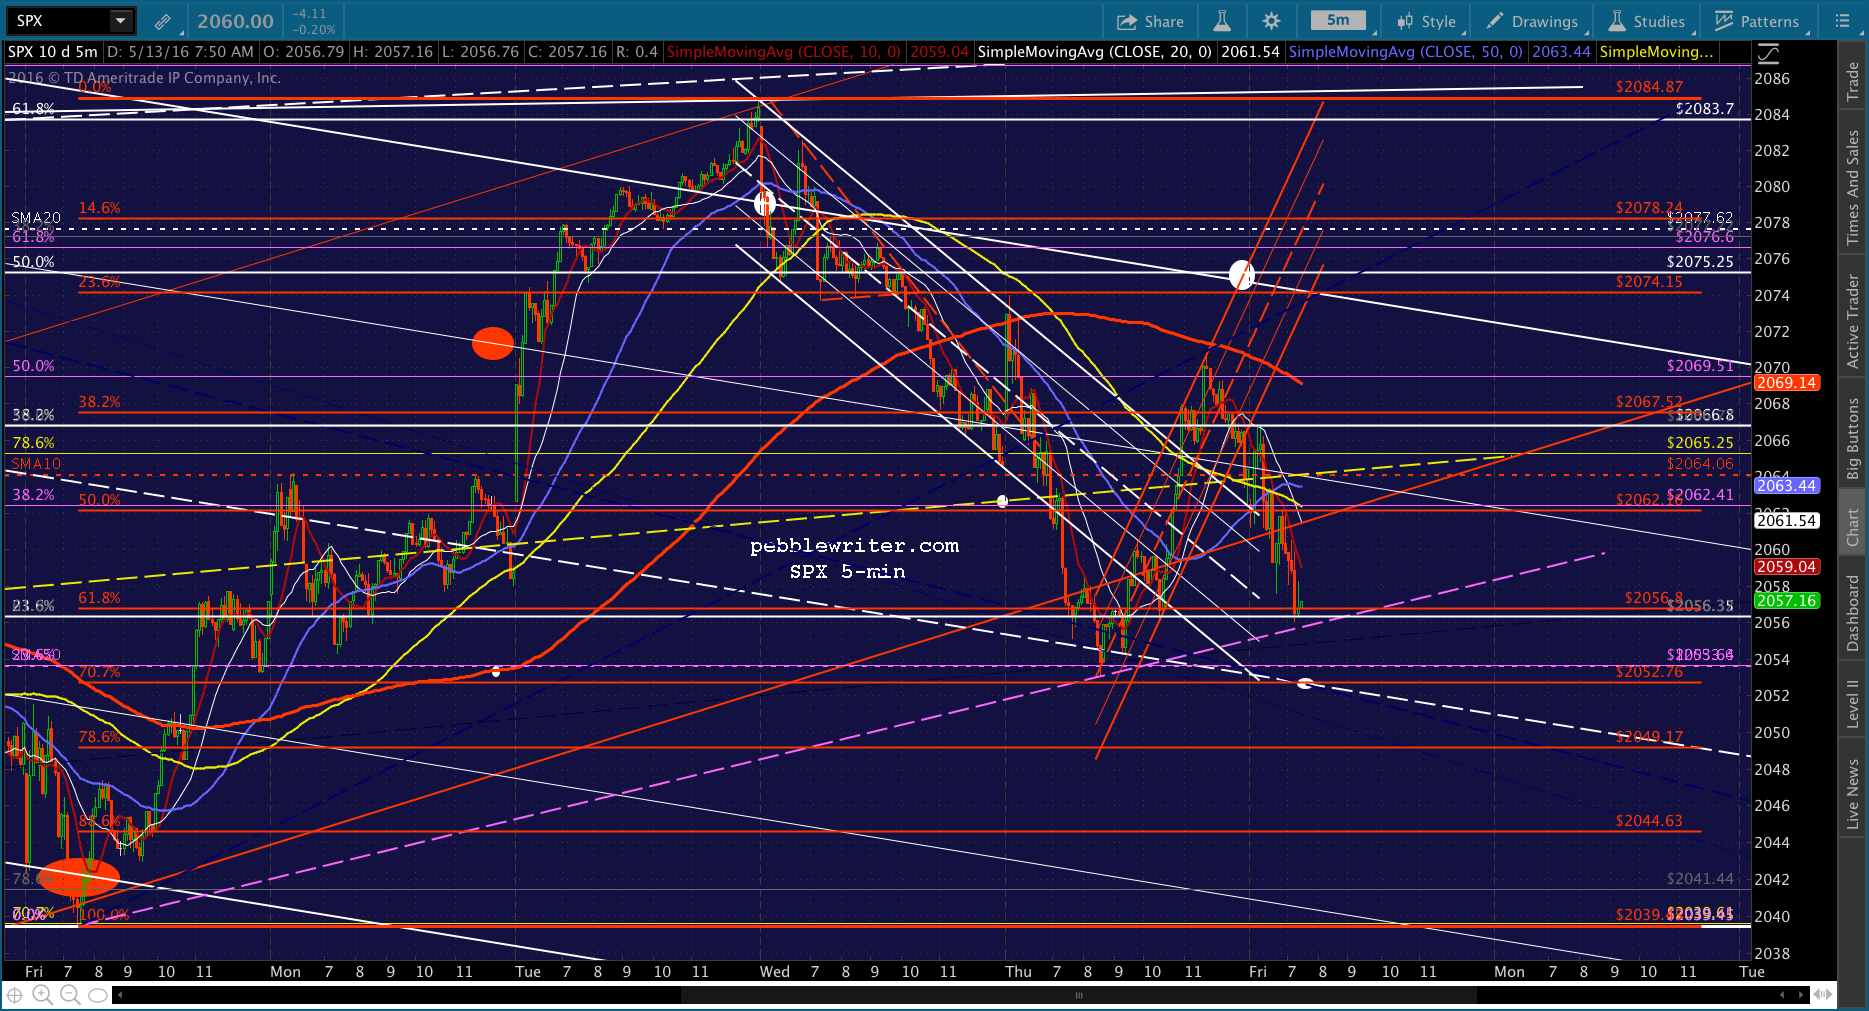
 UPDATE: 2:08 PM
Took a little longer than expected. My wife was having car problems, and it required taking the car to the shop.
Fortunately, things are moving along nicely. SPX bounced off the red .786 because USDJPY bounced off a TL and CL threatened to break out (it didn’t.)
We should get another leg down here as SPX backtests the white channel midline. I’d short here with tight stops in case they decide to leapfrog the descending SMA5 10 as it reaches the midline.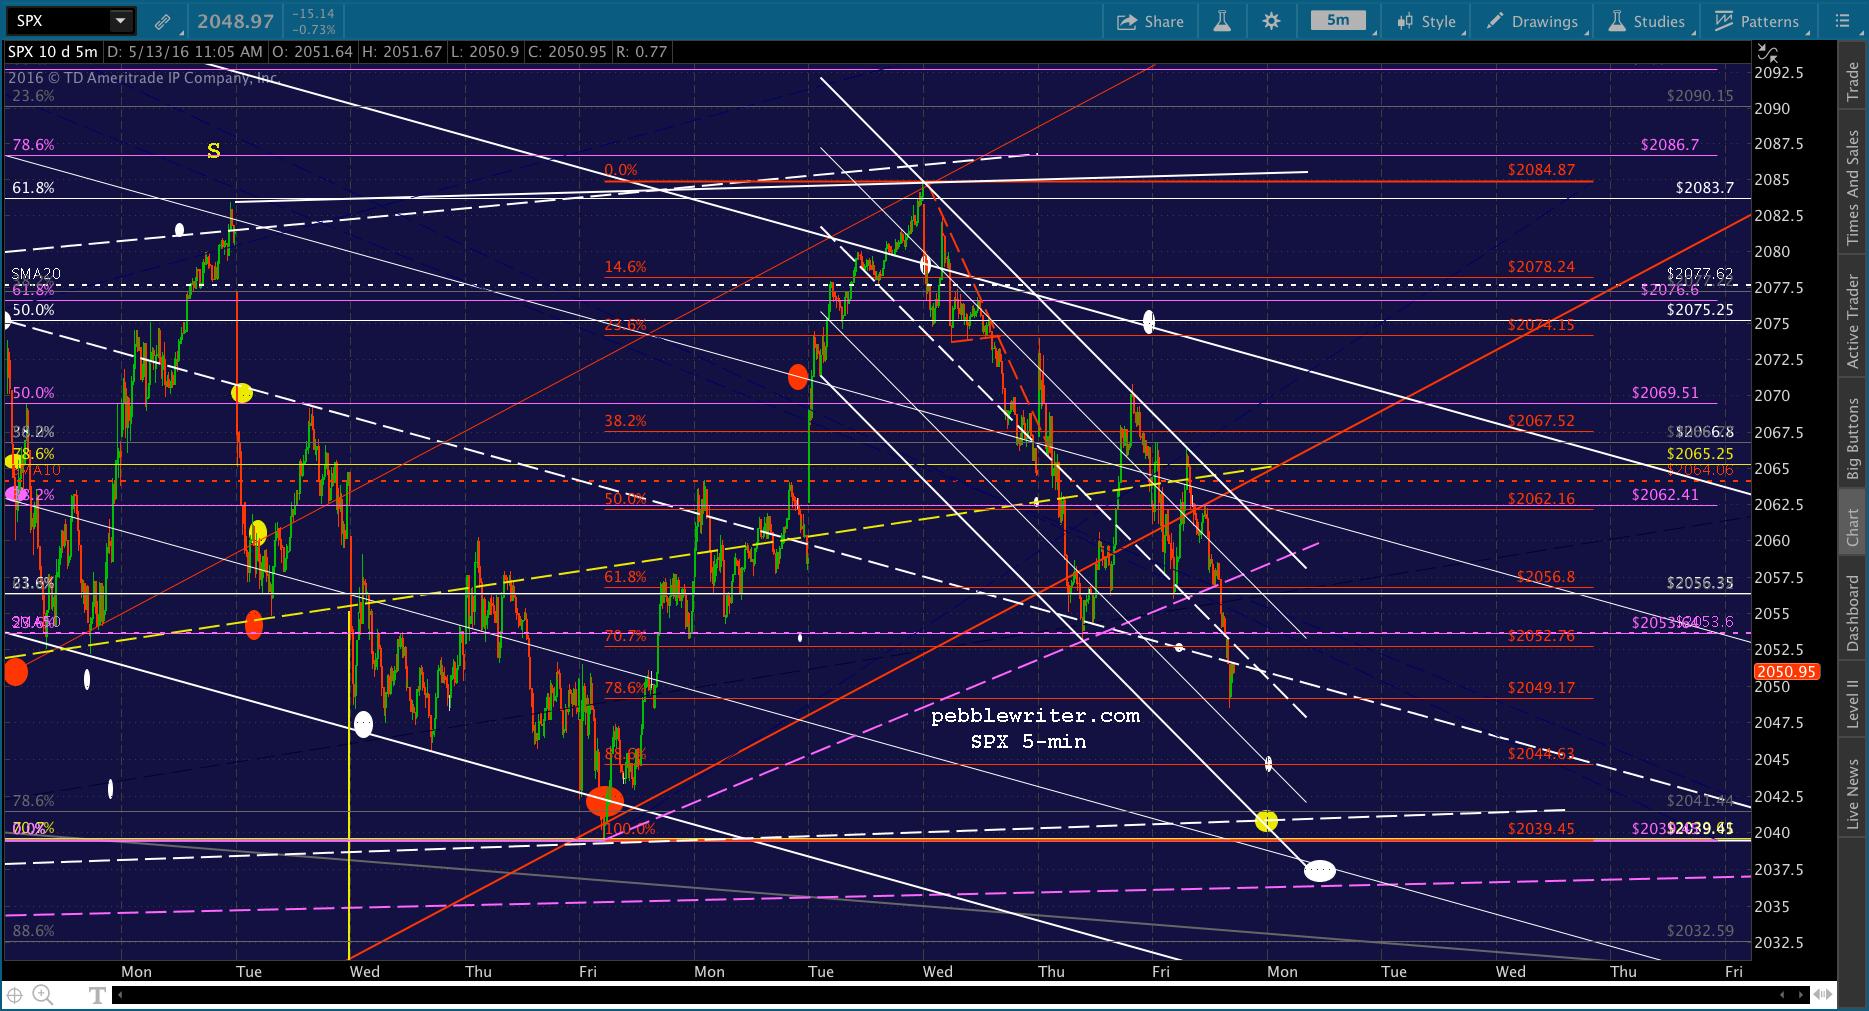 The bigger picture looks to me like we’re going to see the falling white channel’s .236 and, eventually, bottom get tagged — probably at the SMA200 (now 2012.58.) Note however, that another H&S Pattern could potentially complete at the dashed white line around 2041. It would target 1965, which is the 1.618 of the gray grid which rallied from 2022 on Mar 24 to 2111 on Apr 20. Watch out for an interim bounce at the .886 at 2044.63.
Could SPX drop below the SMA200 at 2012? Perhaps not. But, note that the yellow dot below is at the .236 of the rise from Feb 11, and the white H&S target would be the .500 Fib of that rise. So, in the absence of heavy manipulation (as if…) it makes perfect sense.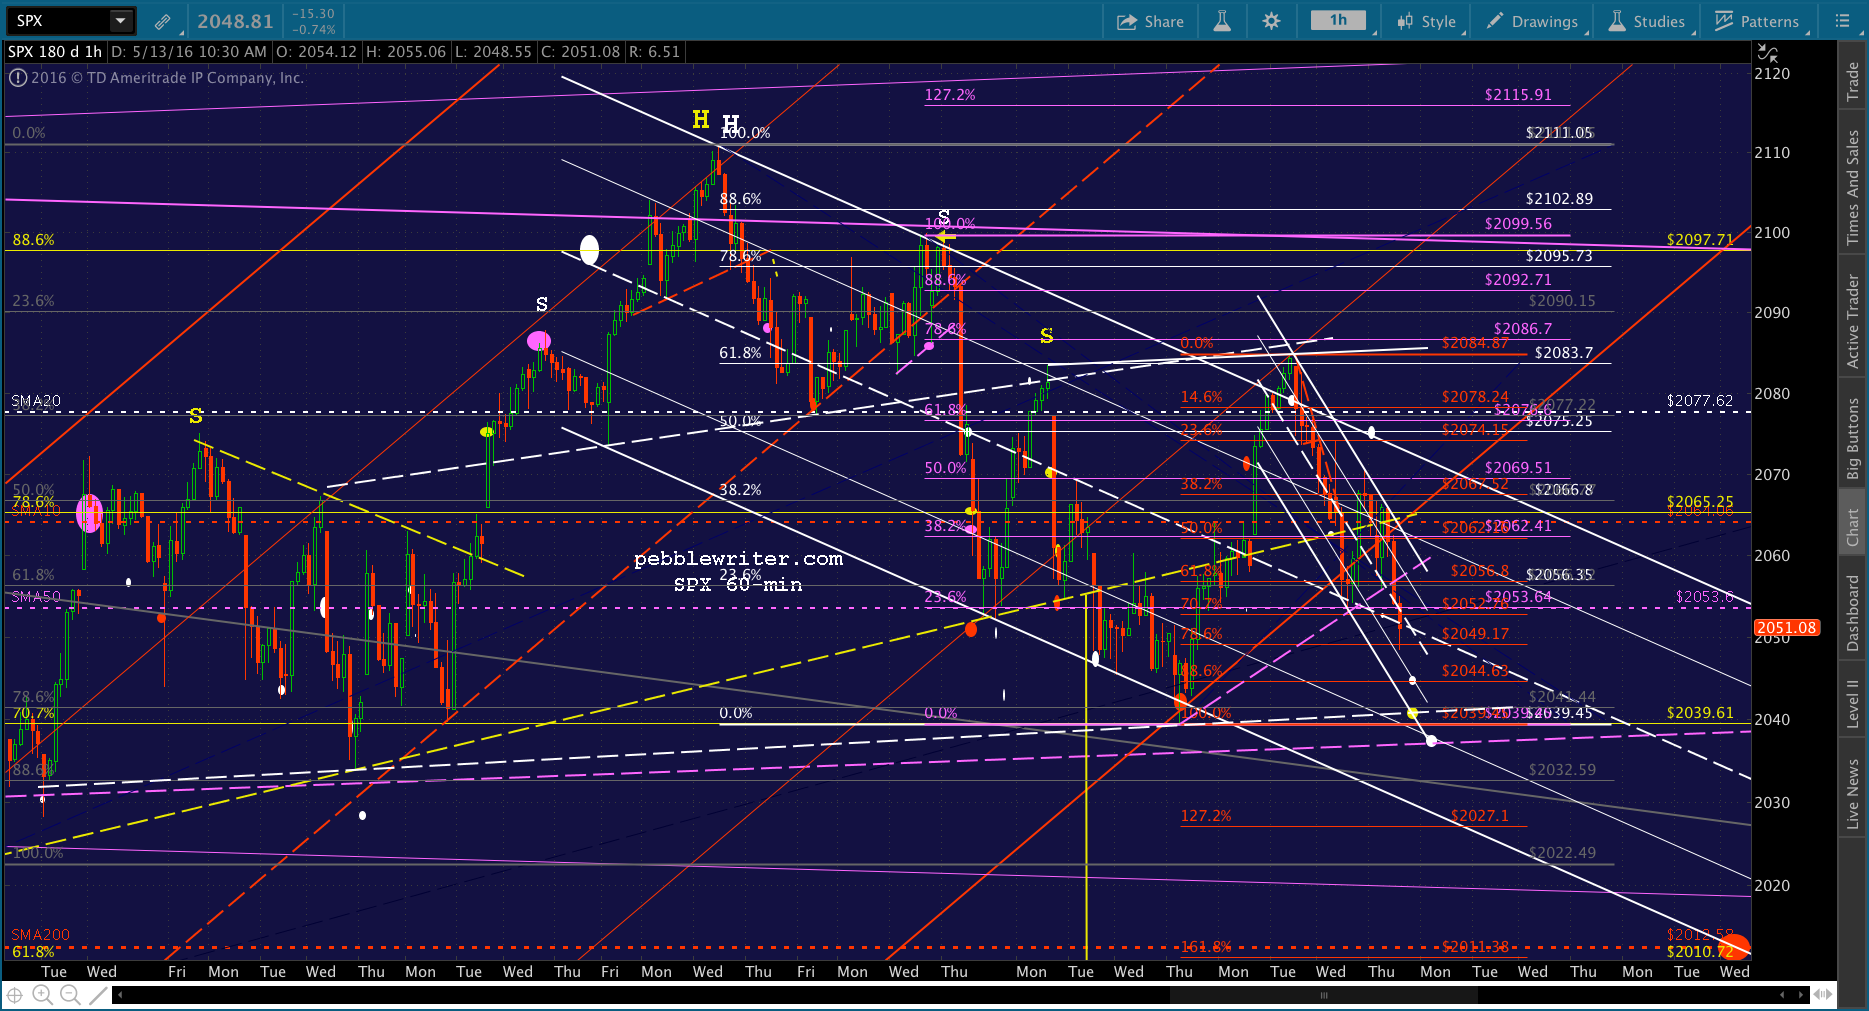
 Here’s a better look at the big picture…

 Note that 1965 is also the midline of the very large rising red channel from 2009. So, it’s a very legitimate target all around.
Keep an eye on USDJPY as we approach 2044 — it’ll tell us whether we’re in for a bounce or not.
 UPDATE: 2:55 PM
Two days ago (the yellow arrow) SPX was headed for a rendezvous with the yellow neckline at the close, but ended up bouncing 3 points between 2:55 and 3:00, only to peak around 3:30, drop back down and close 2 points above the neckline. Note that it didn’t reverse until the SMA5 20 had caught down with it.
The next day, SPX gapped up 10 points before settling back down and crossing the neckline. Just want to point that out as we approach 2:55. Back to cash.
 UPDATE: 3:22 PM
That should do it. Back to short for the close, ideally around 2041ish. They’ve gone to cross controls on USDJPY and NKD, which probably means they’re stalling. For fellow aviation buffs, this would be akin to a forward slip.
 UPDATE: 3:43 PM
Not dropping, so I’ll pull the plug here. If it drops back below the SMA5 10, I’d slam it back into short in a hurry.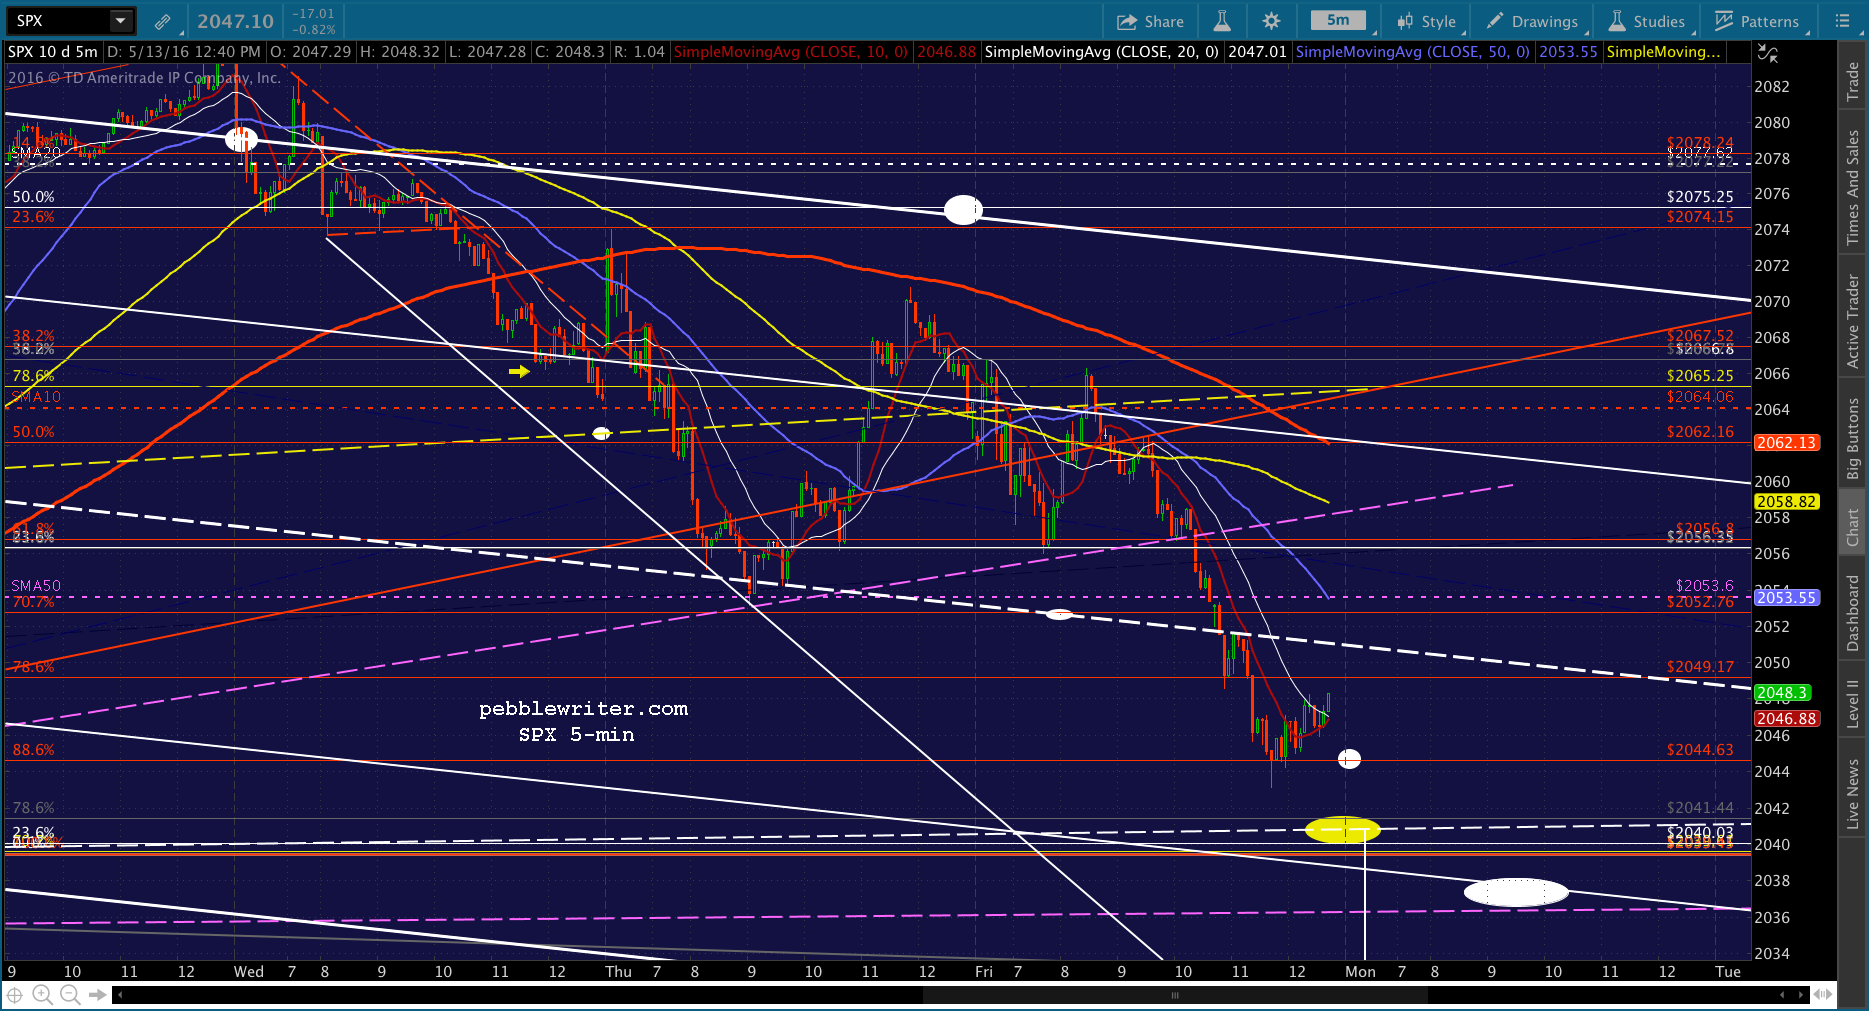 uPDATE: 3:46 PM
Oh VIX, you tricky little minx, you. What game are we playing today?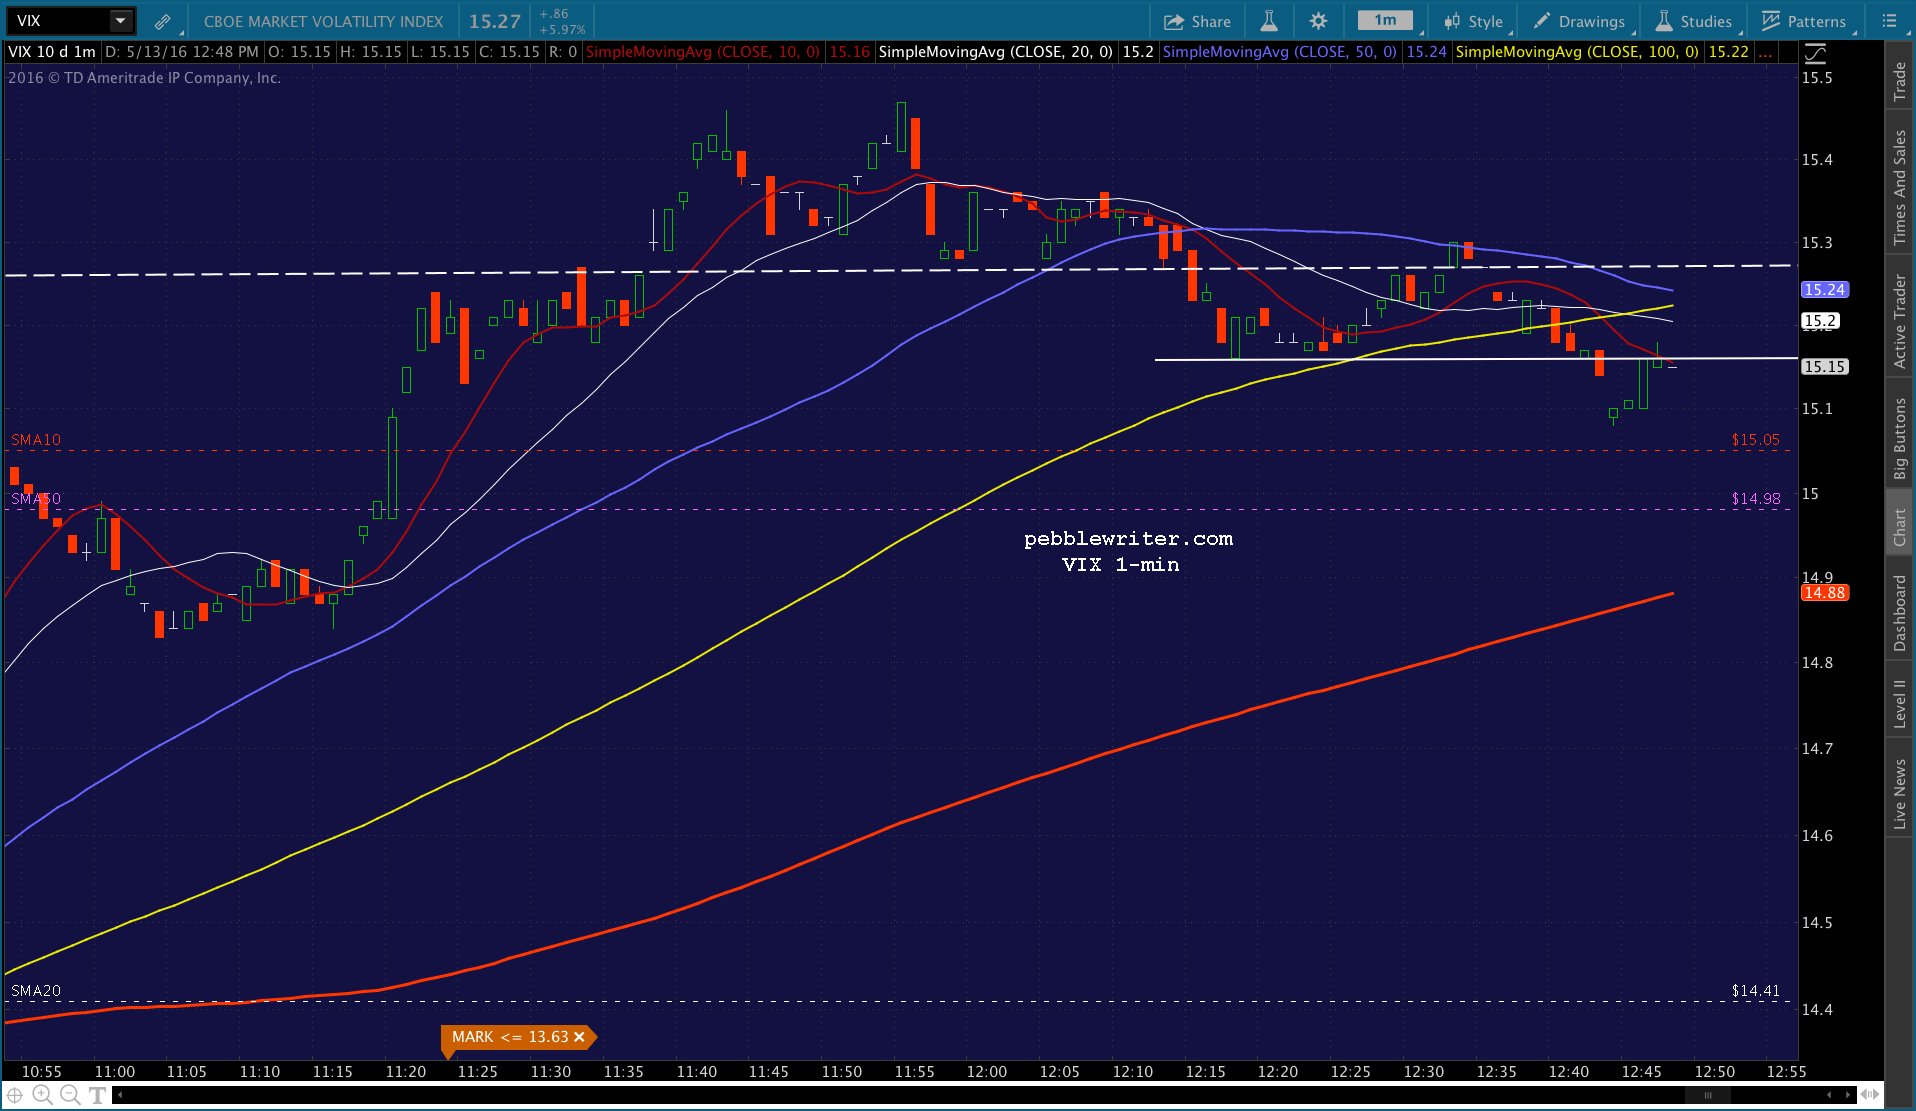 Back to short into the close. Tight stops, of course.
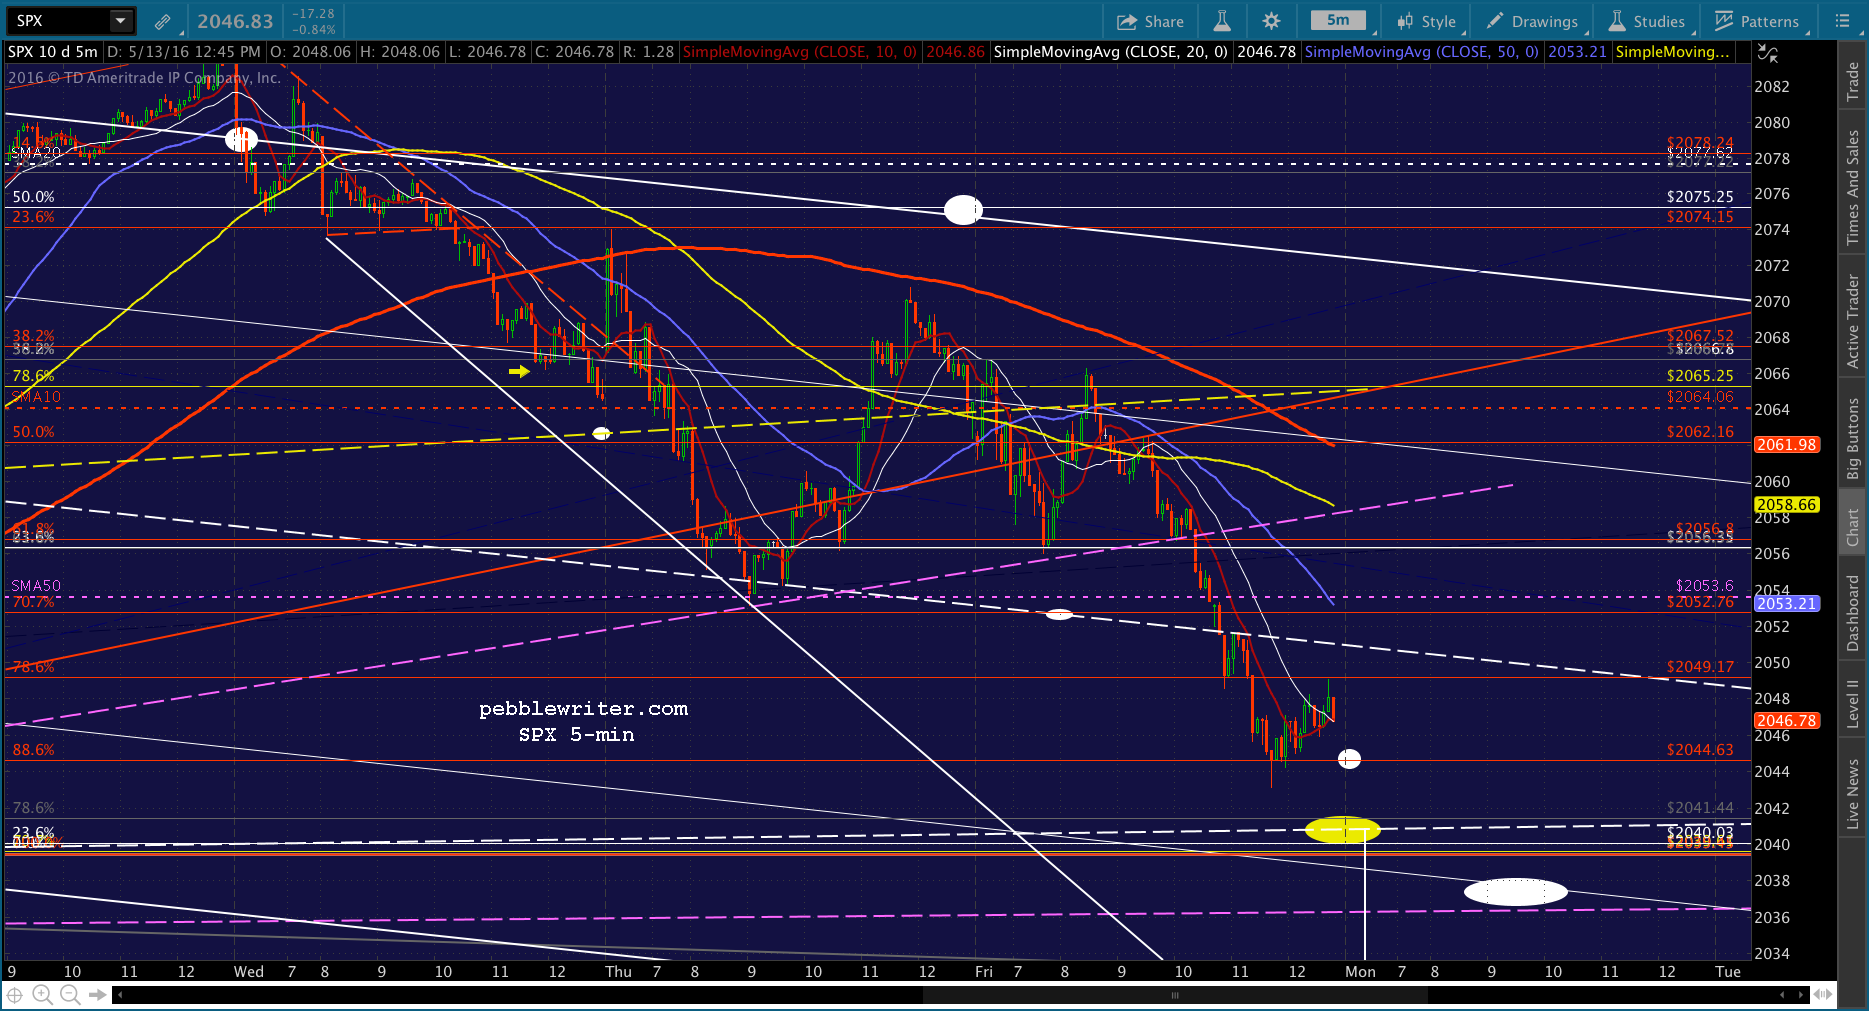 UPDATE: 3:59 PM
Oh, well. Back to cash for the weekend, unless you can hedge and/or watch carefully.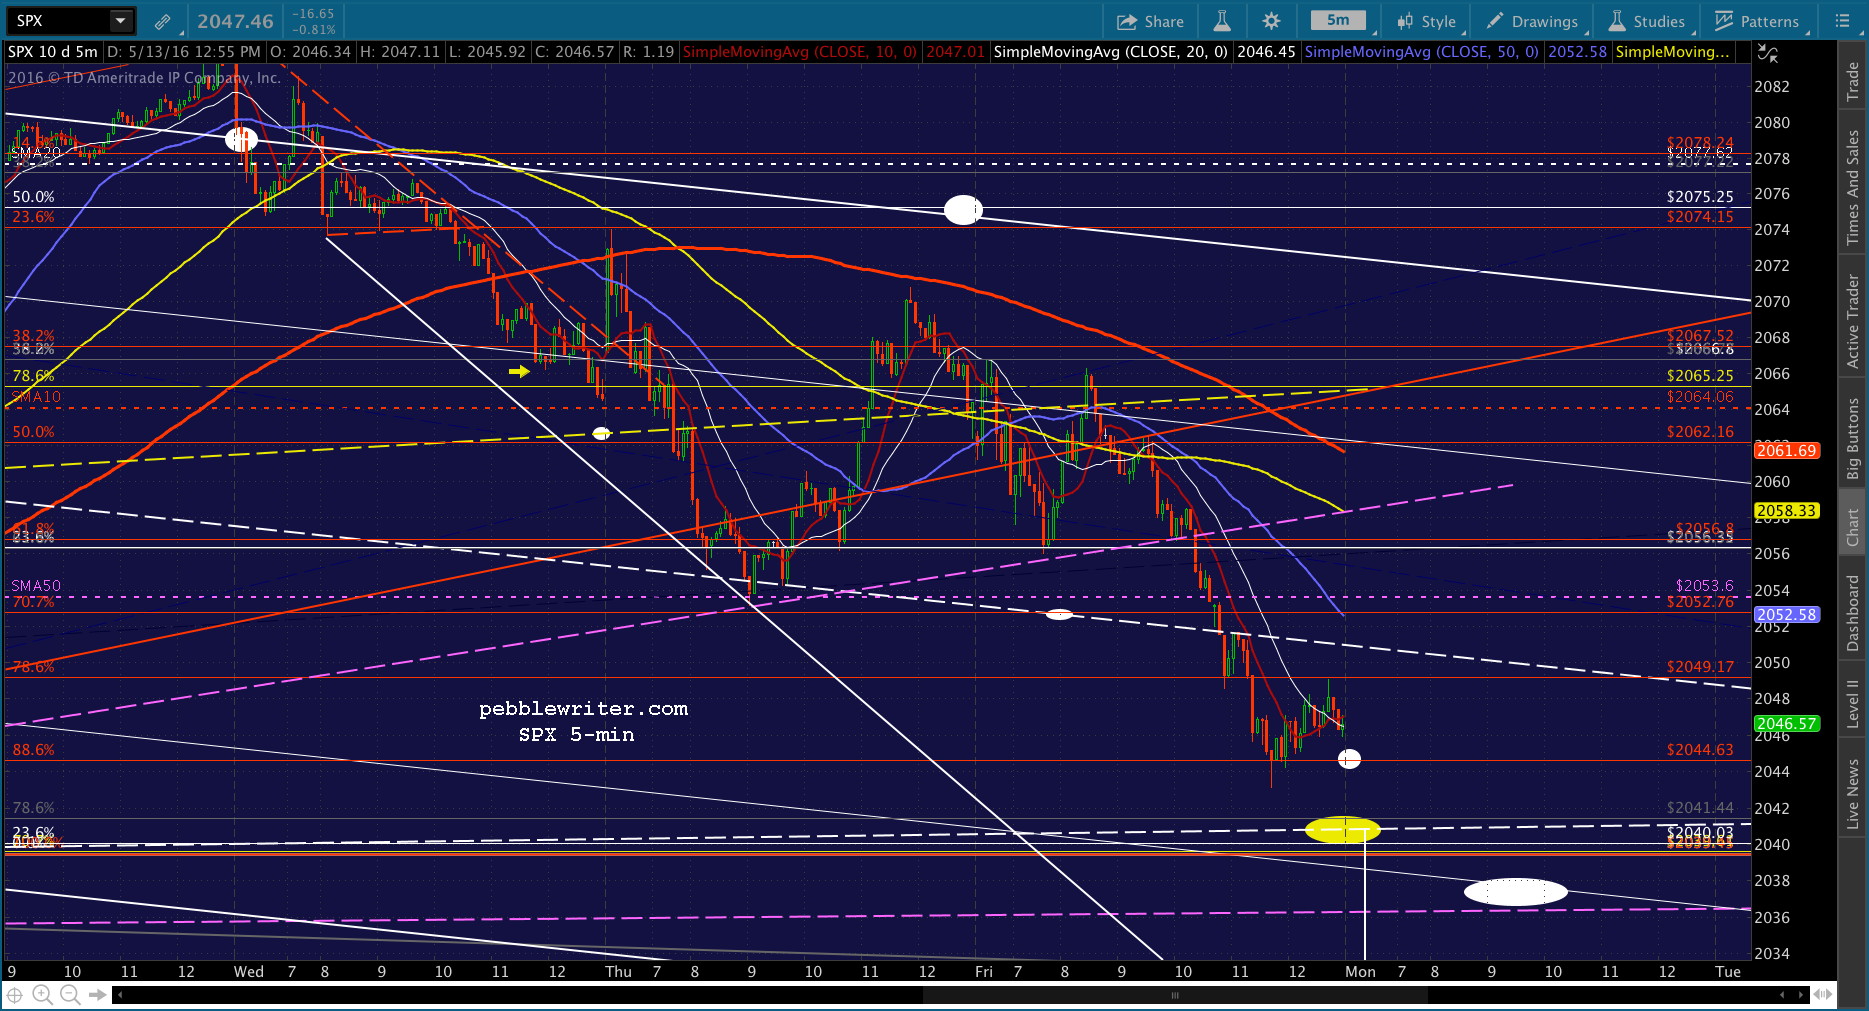
Comments
6 responses to “To H&S or Not to H&S”
Peeble, What do you make of the potential Bat Pattern X=2111.05 A= 2039.45
AB=.618@2083.7 BC=.886 2044 targeting 2102.89. Seems if TPTB want
to leave everyone guessing over the weekend they would let it
close right here or a little higher.
That’s the $64 question, right? If they really wanted to screw us over, they’d close it a little below the white neckline and get everyone nice and short before a weekend ramp job. Honestly, I don’t know. USDJPY should drop more than it has off the .618. But, what’s CL going to do? Who’s the monkey going to fling the shit at — bulls or bears? I think we go down further per all these pretty H&S Patterns, but I can easily imagine them cooking up another announcement that’ll at least reverse the current drop. As usual, I wouldn’t hold long or short unless you can hedge or can stomach a 1%+ directional move in the wrong direction.