

It’s been almost six months since we called the top on SPX. On May 20, I noted that SPX was nearing a key Fibonacci level that should produce a reversal [see: The Last Big Butterfly.] I laid out some potential targets that might be tagged in an unrigged market:
Is there any chance in hell that the world’s central banks and their Wall Street (and, Chicago) accomplices would permit the enormous sell-off that a Butterfly Pattern would normally produce? A typical response would be to the .886 at 1472, .786 at 1381 or .618 at 1228. Even the closest Fib level is 1823 — a 14.7% drop.
SPX didn’t reach 1823. It only dropped to 1867 — a still tasty 12.5% plunge. While TPTB averted another backtest of the 1.272 Fib (it already did it in Oct 14), they left what feels like unfinished business.
 continued for members…By not reaching 1823 itself, the Butterfly didn’t produce even the smallest reaction one might expect — a drop to the nearest Fib. Of course, the reason is pretty clear. Since the Aug 24 lows, USDJPY has rebounded by 6.4%.
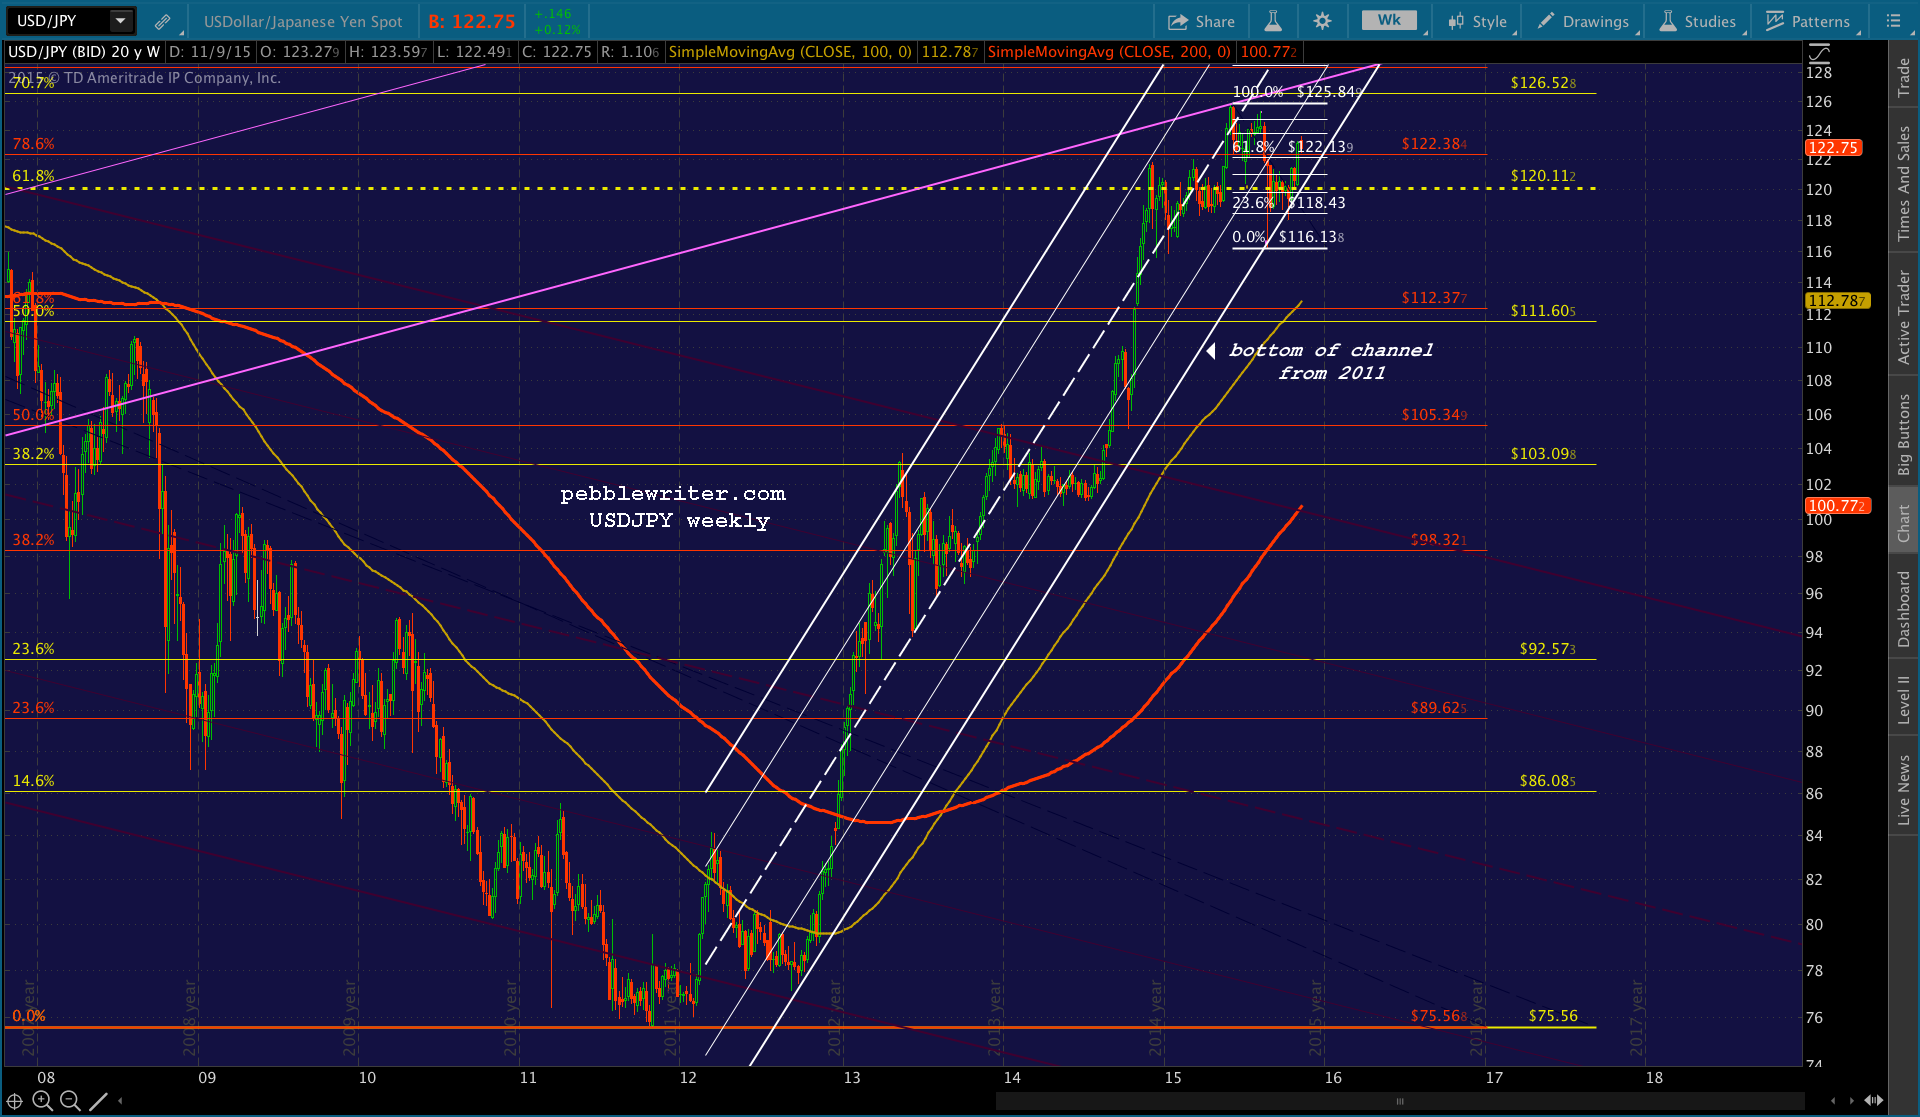
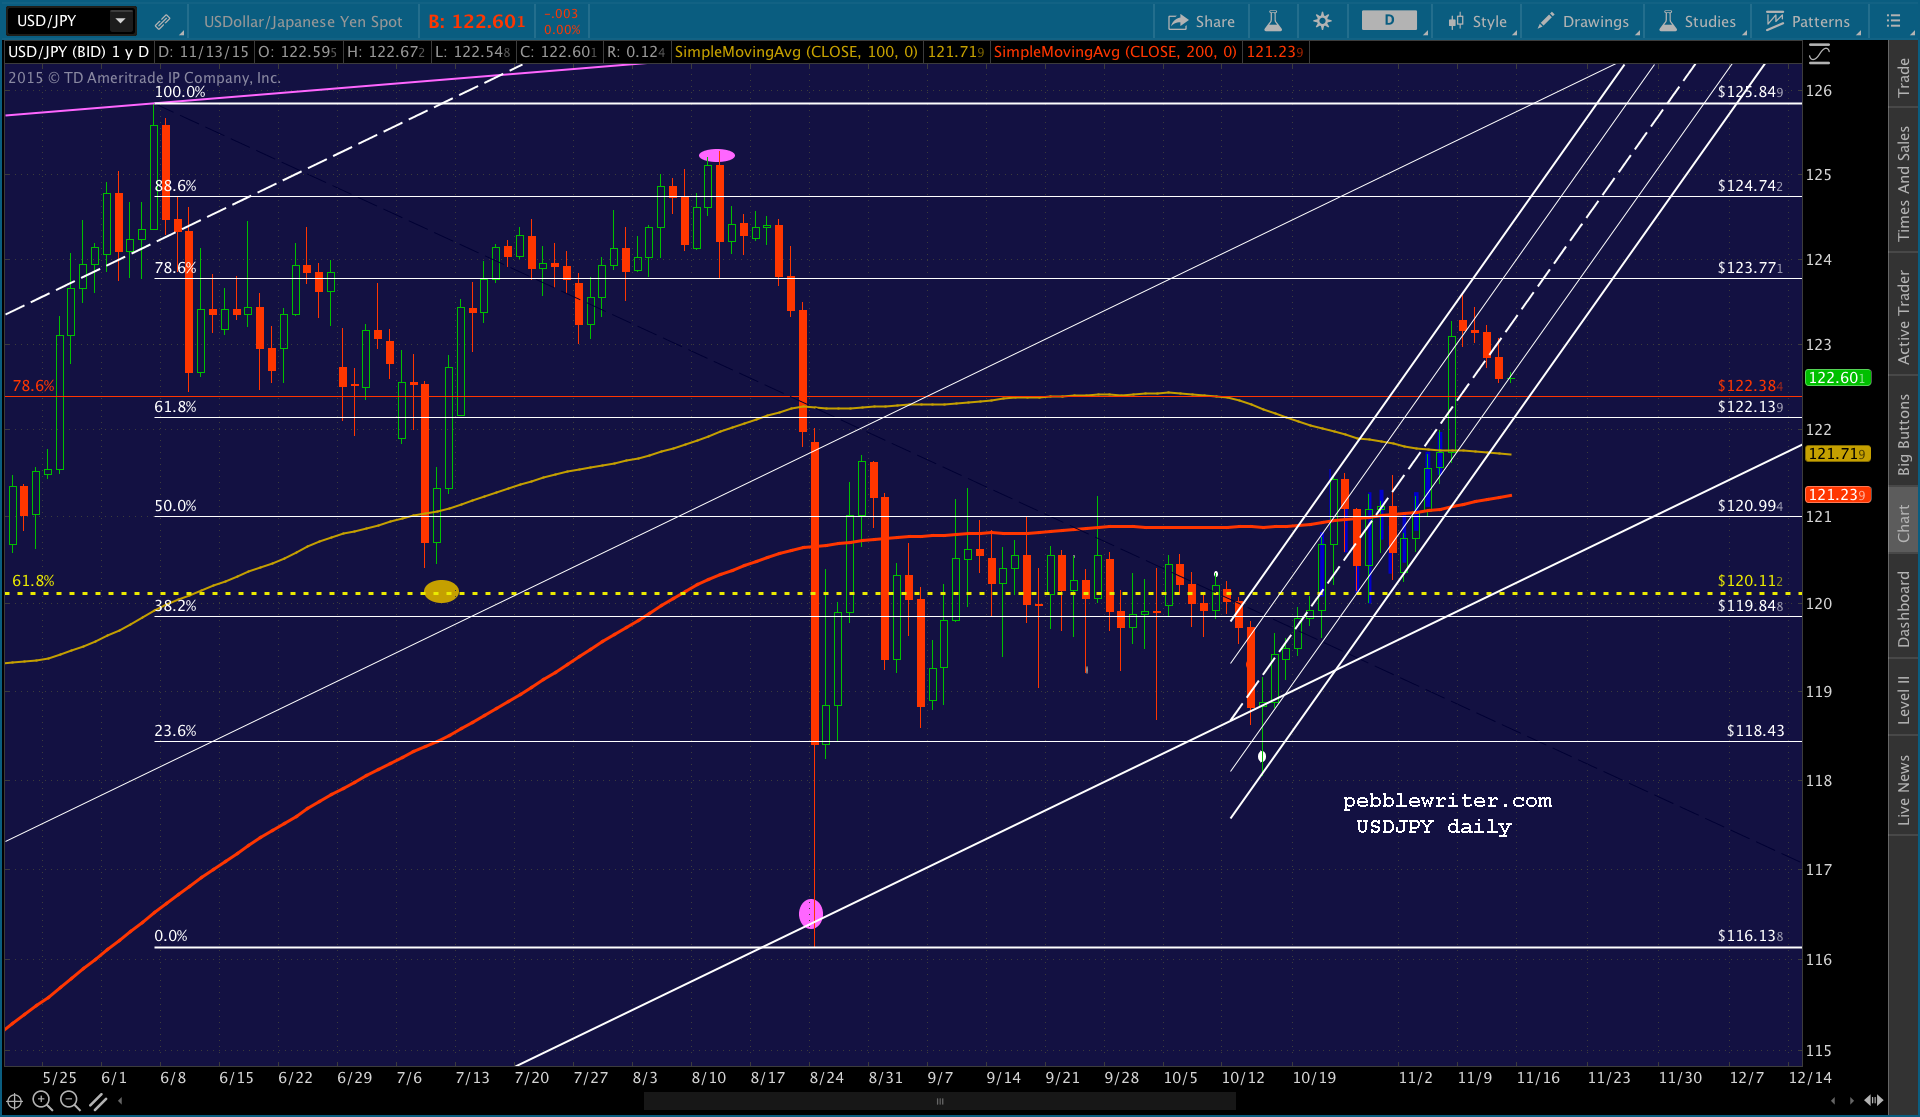 When SPX hit 1867, USDJPY hit the bottom of the channel that’s guided it higher ever since 75.56 in 2011 to its current 122 — a 62% moon shot that made the yen carry trade the most important carry trade on the planet.
Surprisingly, the latest rally in USDJPY didn’t derive from an increase in QQE, nor even a declared intent to cheapen the yen. It was pure currency manipulation – central banks bidding up the dollar and selling the yen.
 Accompanied by CL-driven overnight ramp jobs, SPX had little trouble retracing 88.6% of its drop from 2134 to 1867. We noted the Bat Pattern’s completion back on Nov 2.
Since then, SPX has fallen as far as the SMA200, and is nearing the confluence of the SMA100, the .618 of the drop from 2134 to 1867 and the TL connecting the recent highs (in red, below.) We’ll call it 2032-2035.
And, I’ll be very surprised if it isn’t reached tomorrow or early next week. I’ll be even more surprised if SPX doesn’t get a very nice bounce there — possibly to new highs.
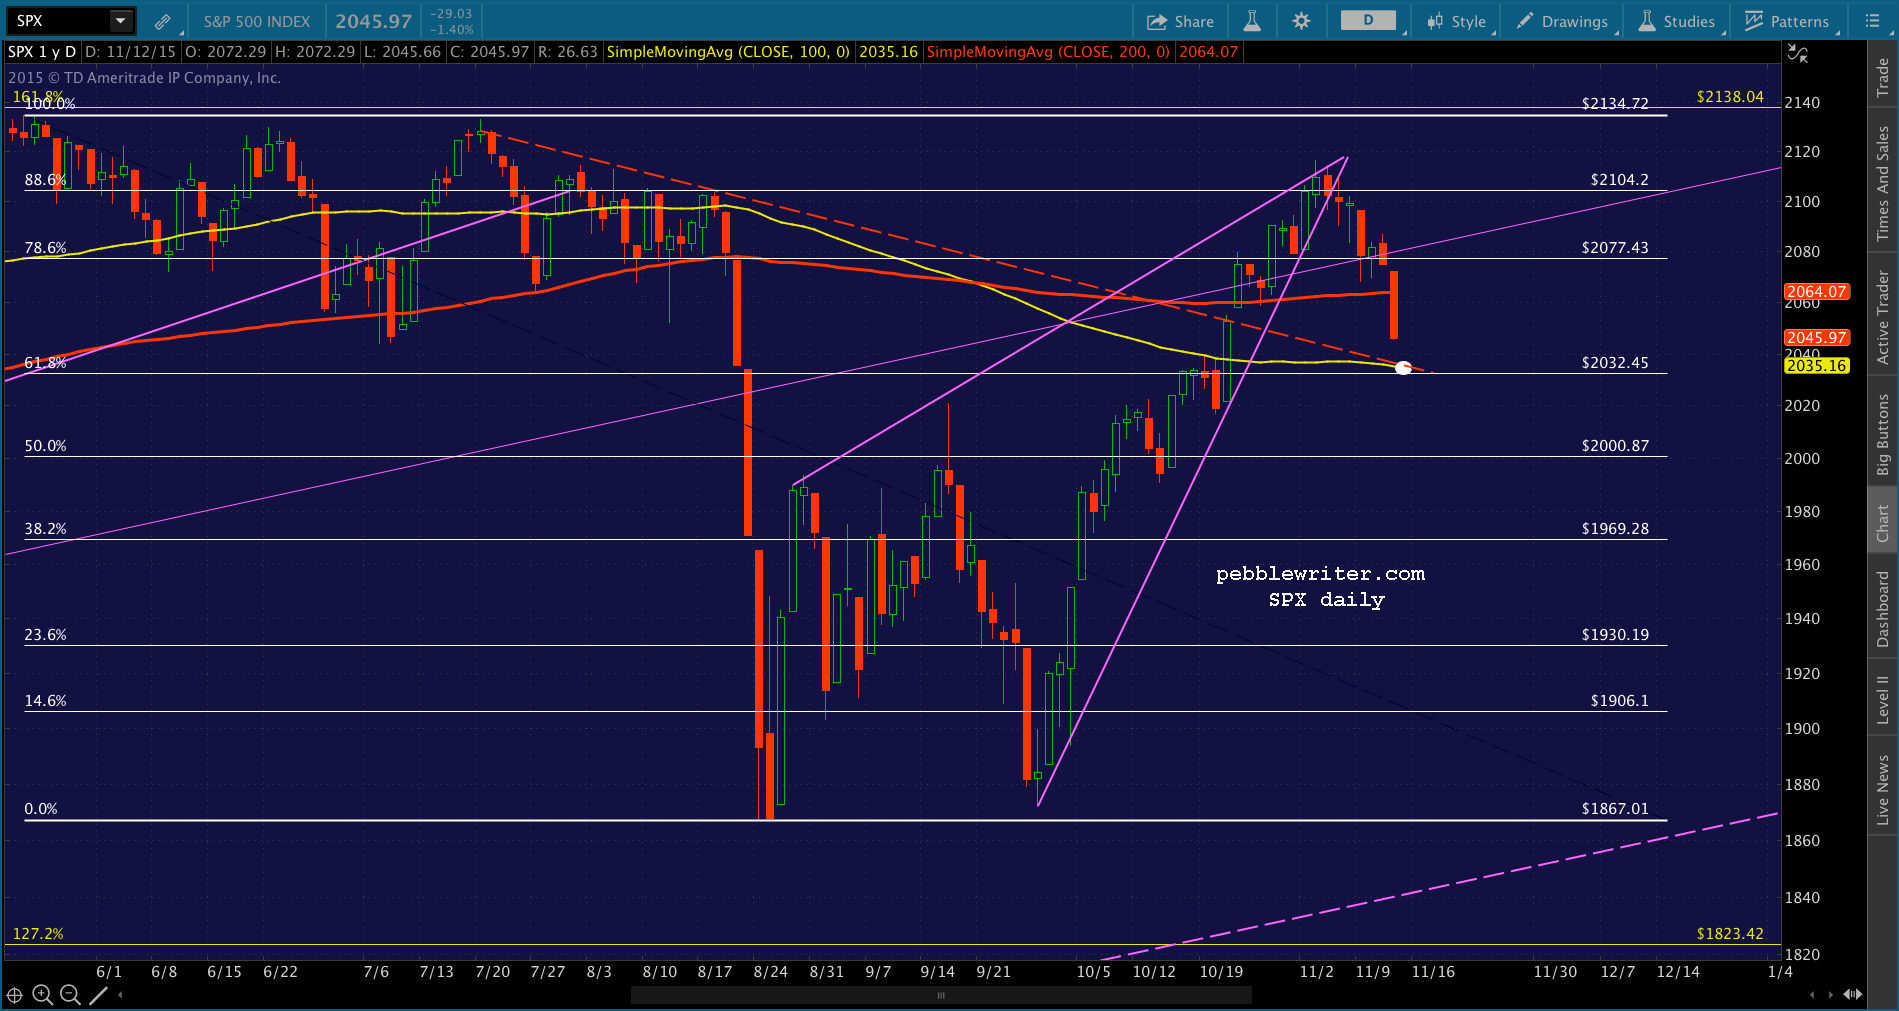 If it doesn’t, there are plenty of other lower targets to consider: lots of Fib levels and moving averages that were ignored on the way up. And, way down at 1867, the midline of the large purple channel from 2009 is slowly coming into view.
A drop to 1823-1867 would be a real ball-buster. While economic conditions, the widely-expected FOMC rate increase, and disappointing corporate earnings might justify such a drop, it’s hard to imagine TPTB permitting it after working so hard to get SPX back to 2100. For that reason alone, the test of 2032 will be incredibly important.
One side note: while the log charts shown above don’t do much to confirm the rising purple channel, the rising channel in an non-log chart work fairly well in many respects. 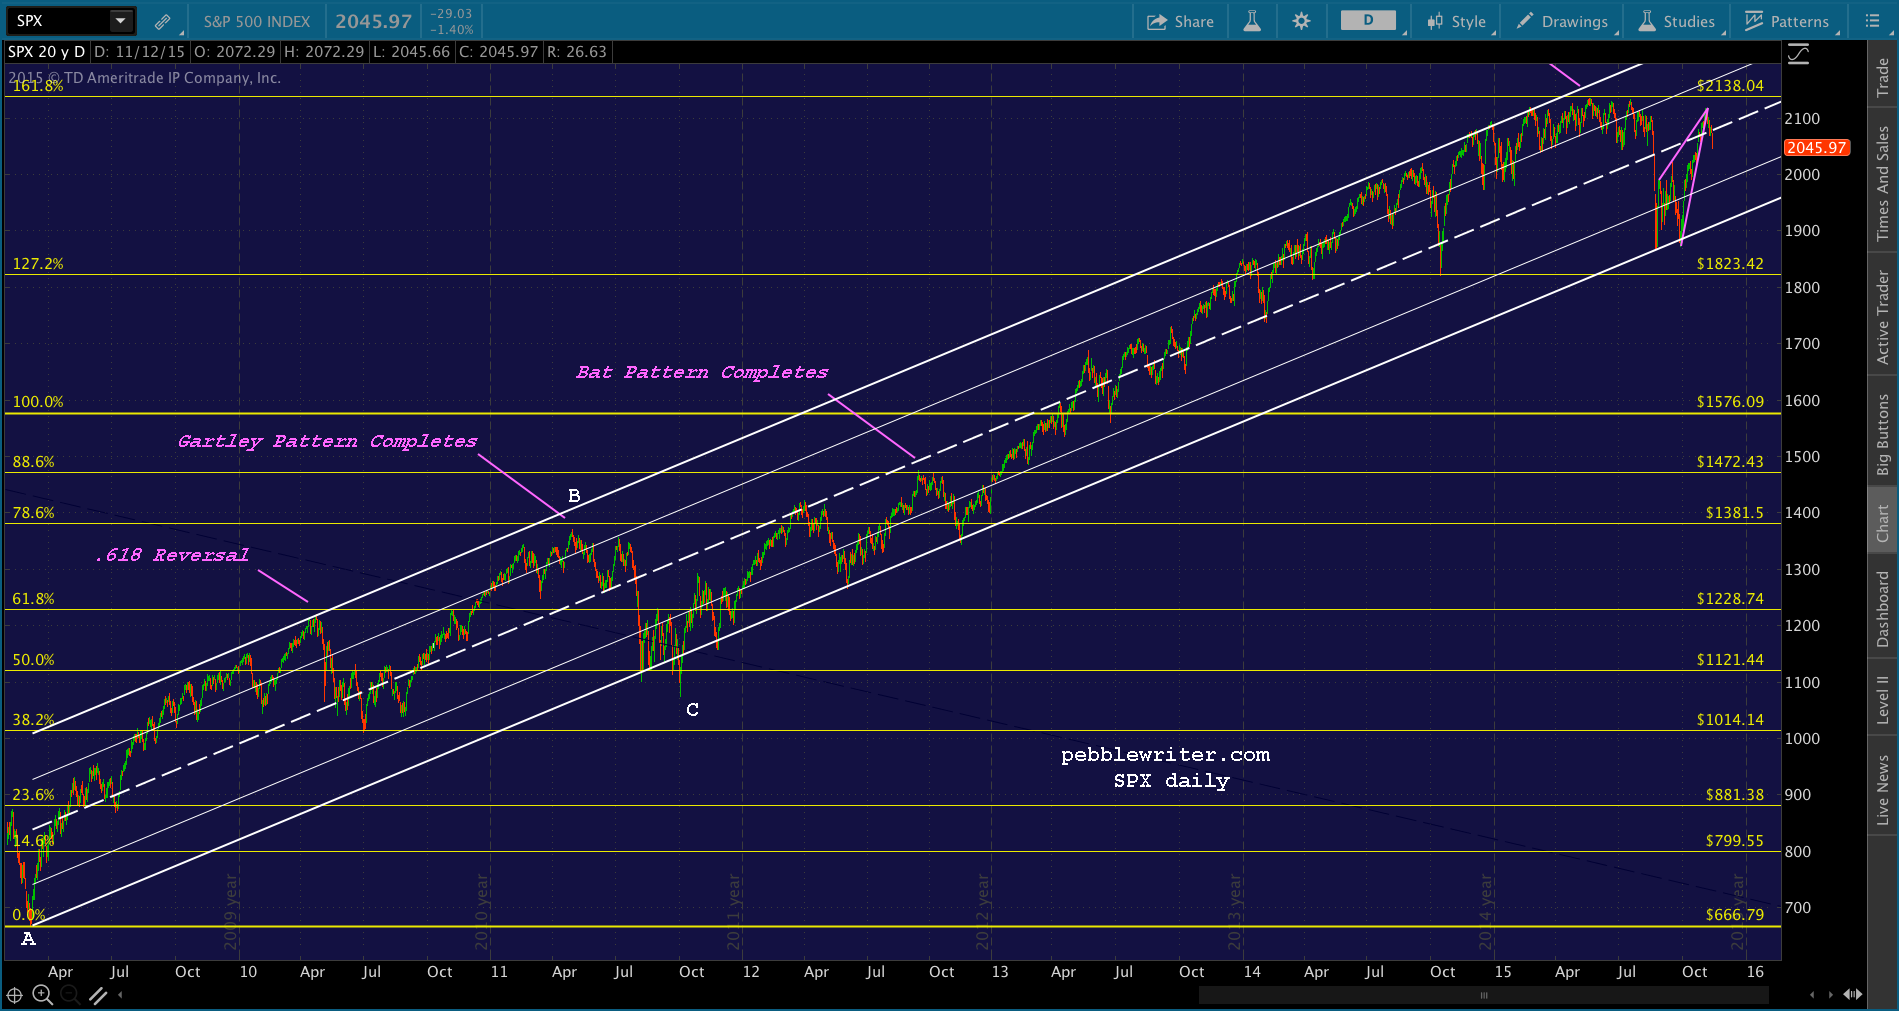 The Aug 24 and Sep 29 lows, in particular are in keeping with the white channel bottom.
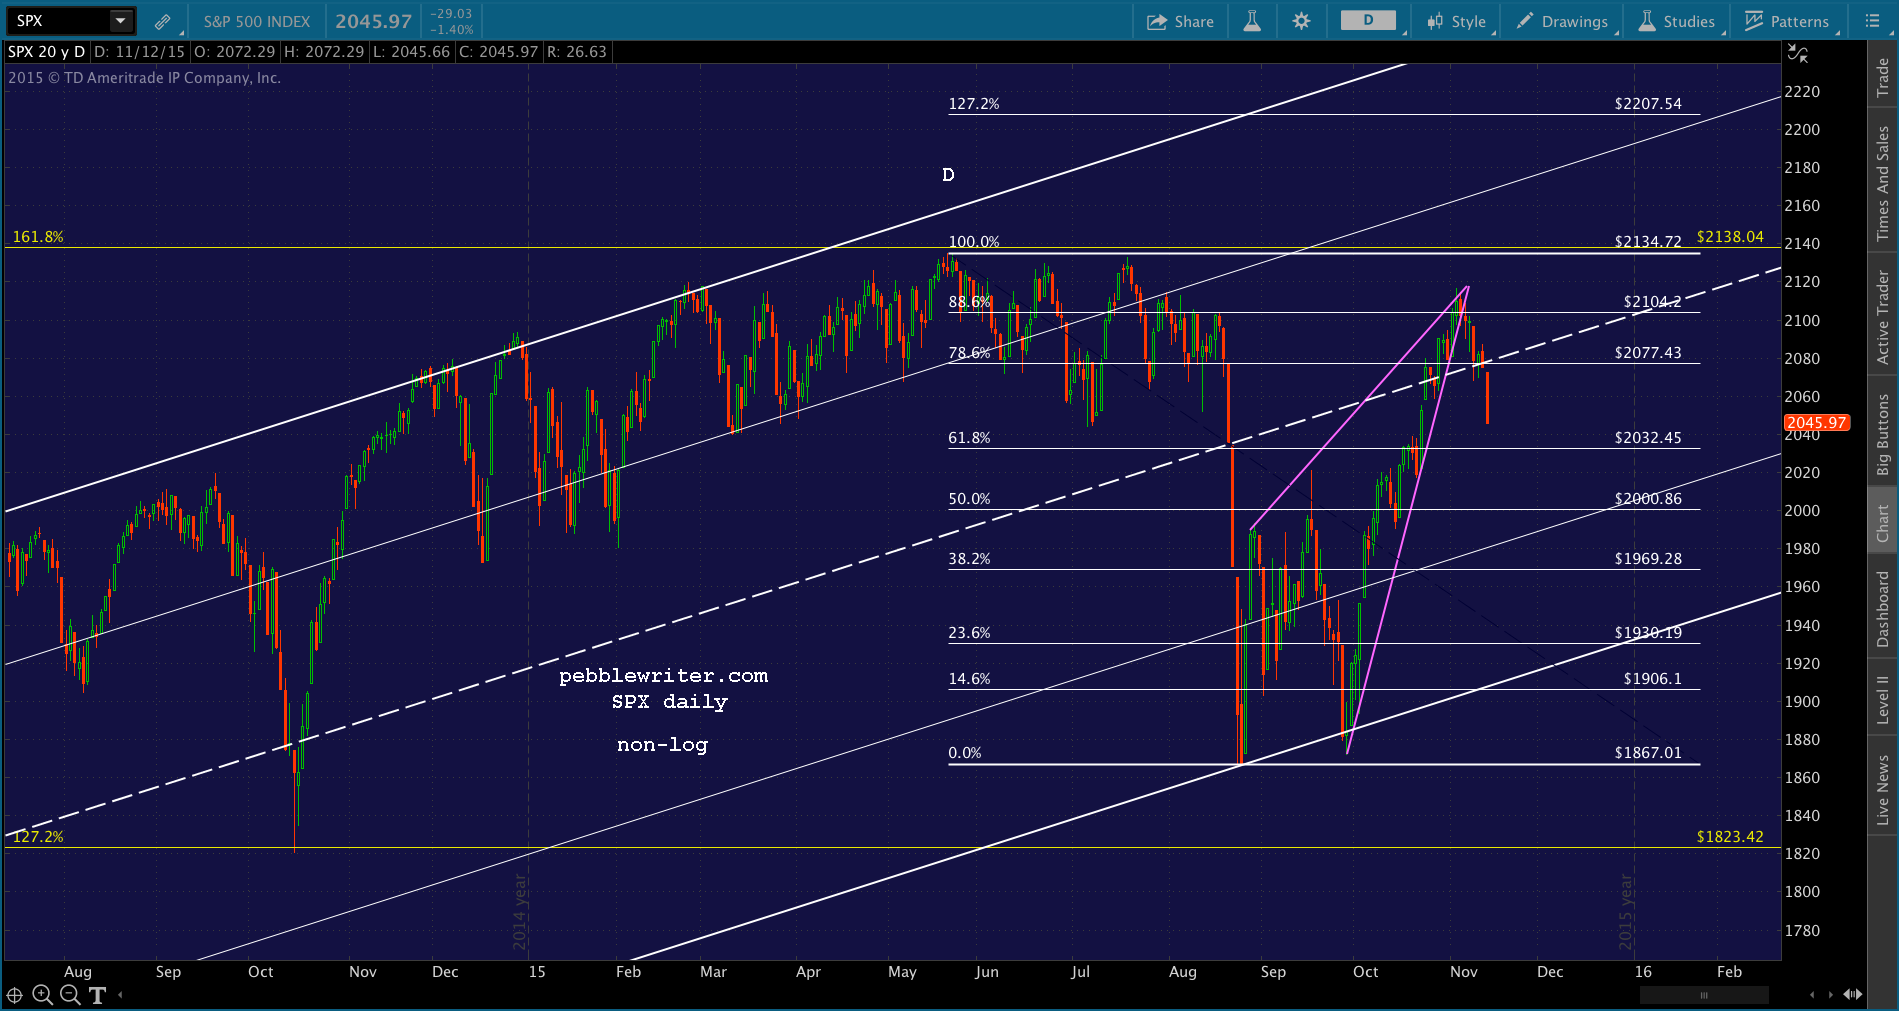 Charted in this manner, SPX’s SMA100 target isn’t reinforced by channel levels or the TL off 2134. Doesn’t make it right or wrong, but it’s something to be aware of if 2032 doesn’t hold.
Stay tuned.