

As scary as last week’s drop was to some investors, we saw it as the natural result of a Bat Pattern completion. From Nov 3, the day SPX topped out at 2116.48:
SPX reached our upside target of 2104.21, completing a Bat Pattern at the 88.6% retracement of the drop from 2134 (May 20) to 1867.08 (Aug 24.) The normal repercussions of a Bat completion would point to at least the .618 [2032.48] or below.
 As SPX dipped below our 2032.48 targeton Friday, it seemed like things were getting out of control. Still, our charts indicated otherwise. From Friday’s post:
From a technical standpoint, the bounce is having a hard time getting underway. I can only take this to mean that the MM’s are purposefully creating confusion for the purpose of shaking loose weaker players before whatever comes next — which still appears to be a big bounce… Think of all the great short bets over this past week that only paid off if someone was willing to hold overnight. I believe this is the flip side — a well-designed bear trap.
After yesterday’s stunning 33-pt rally, it’s now pretty clear that it was, indeed a bear trap.
continued for members…
We should see some follow-through this morning, with the SMA200 now in view as overhead resistance. A backtest of the SMA100, however, would make perfect sense if trend can be broken.
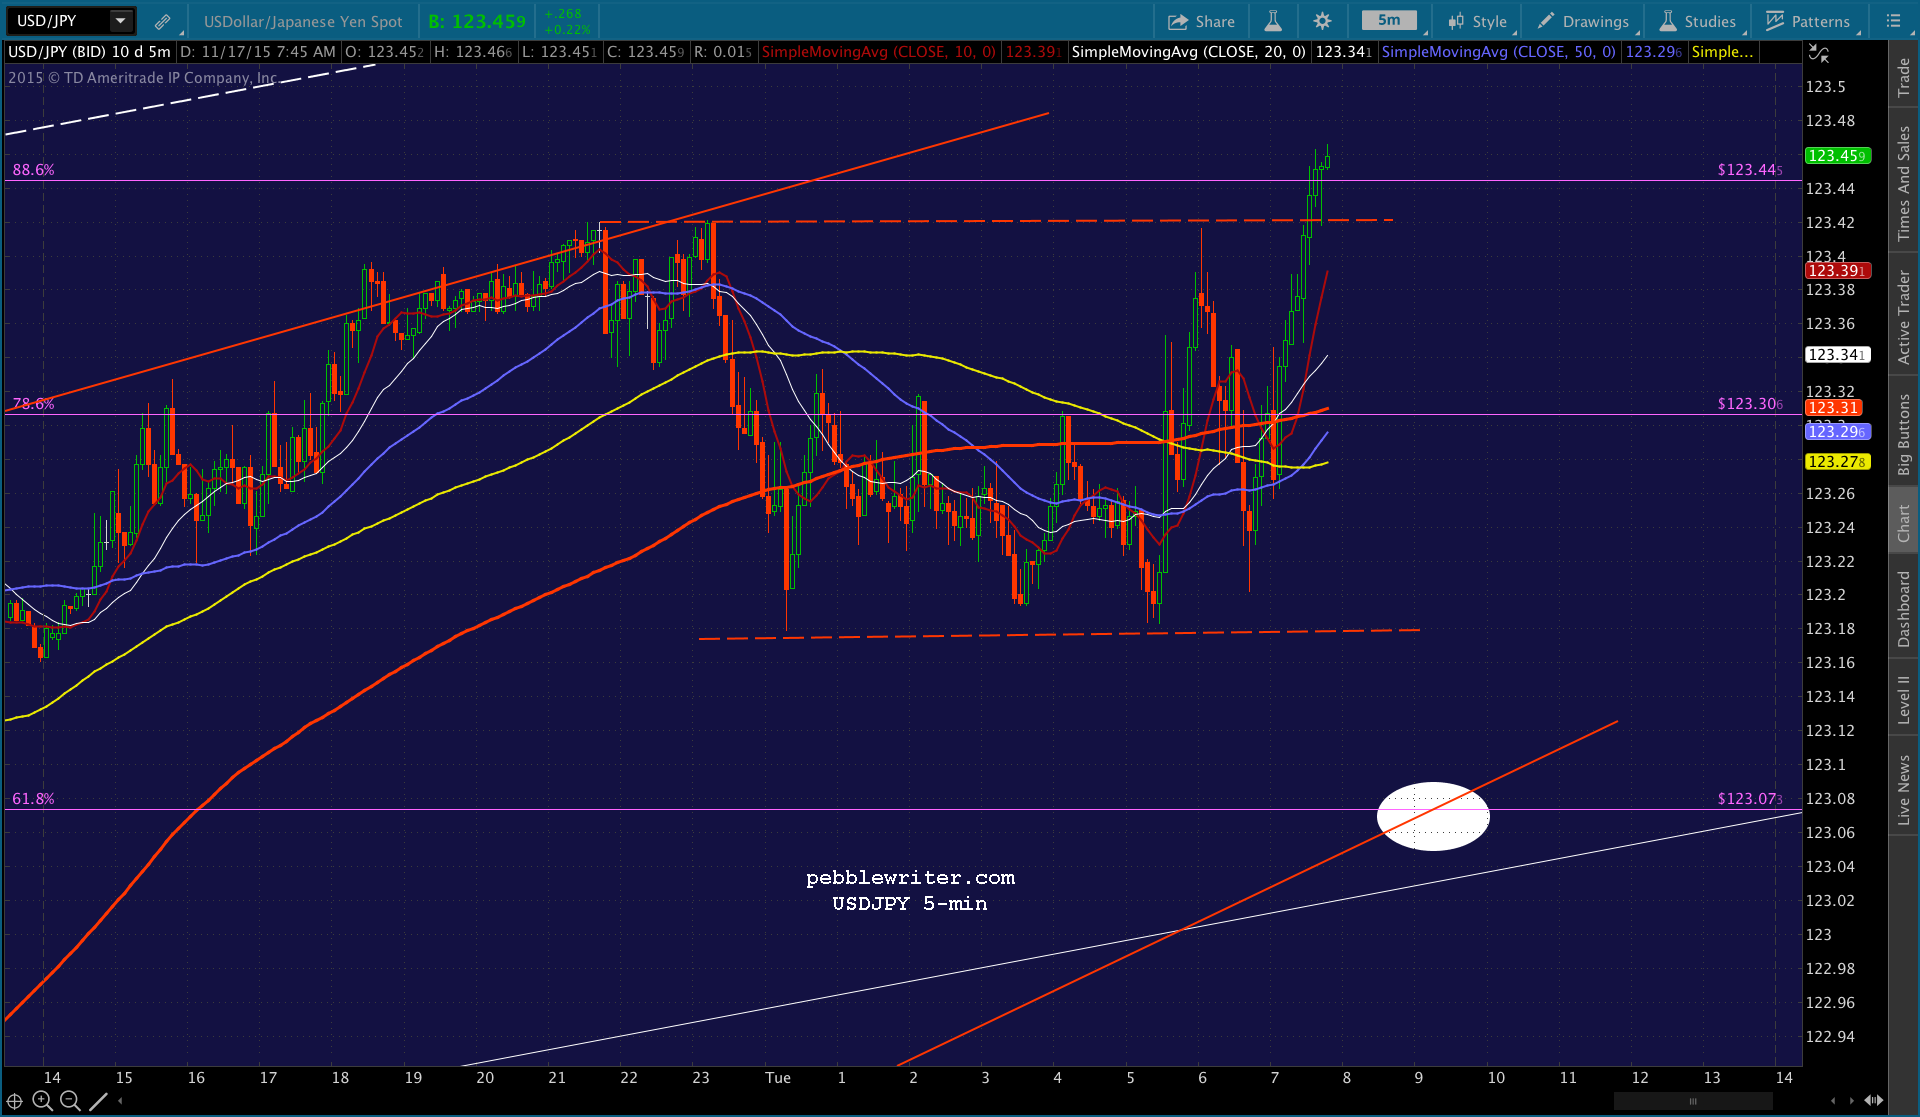
 Note that USDJPY, whose breakout was instrumental in yesterday’s bounce, is now nearing an .886 retracement of its drop from 123.60.
 Another key worth watching is DX, which is closing in on the .886 of its drop from 100.78 last March.
  The bigger picture:
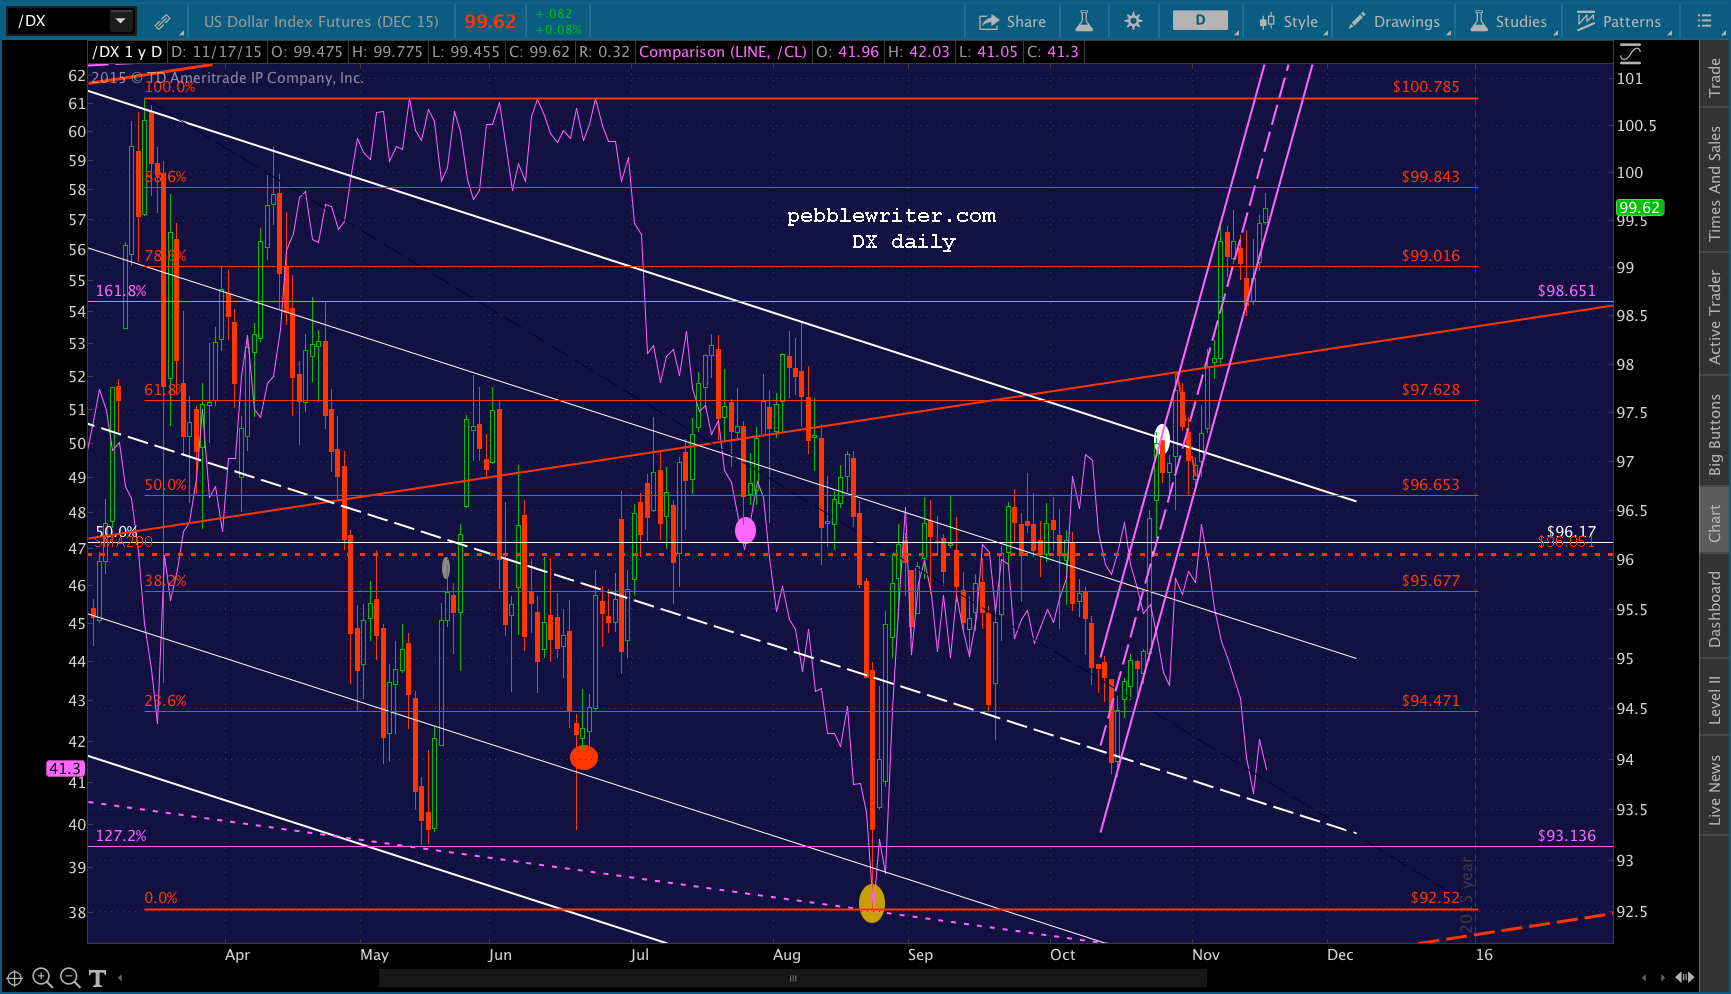 UPDATE: 9:35 AM
 Tight stops, however, as CL has backtested channel support.
 A quick peak at the USDJPY 5-min chart shows a bunch of short-term support at 123.18. If this breaks down, which I believe it will, it’ll help SPX with some downside. Look for USDJPY to backtest the purple .618 at 123.07.
 UPDATE: 10:27 AM
Quick update on our primary charts:

 Watch your stops, as a quick pop by USDJPY through that .886 at 123.44 would quickly send SPX up to the .618 at 2061.44.
UPDATE: 10:29 AM
 I’ll probably try another short at the .618 at 2061.14 — assuming USDJPY reverses at its .886. If it doesn’t, then our original target of 2064.38 is next up.
Note that ES already reached its daily SMA200 at 6:05 ET.
UPDATE: 10:44
SPX just tagged its .618 Fib. I’m tempted to take a short position here, but USDJPY is still hovering above its .886. So, we’ll watch it very carefully for signs of a reversal as SPX approaches 2064.38.
 Note that TNX has completed backtesting its broken white channel and should be expected to reverse here.
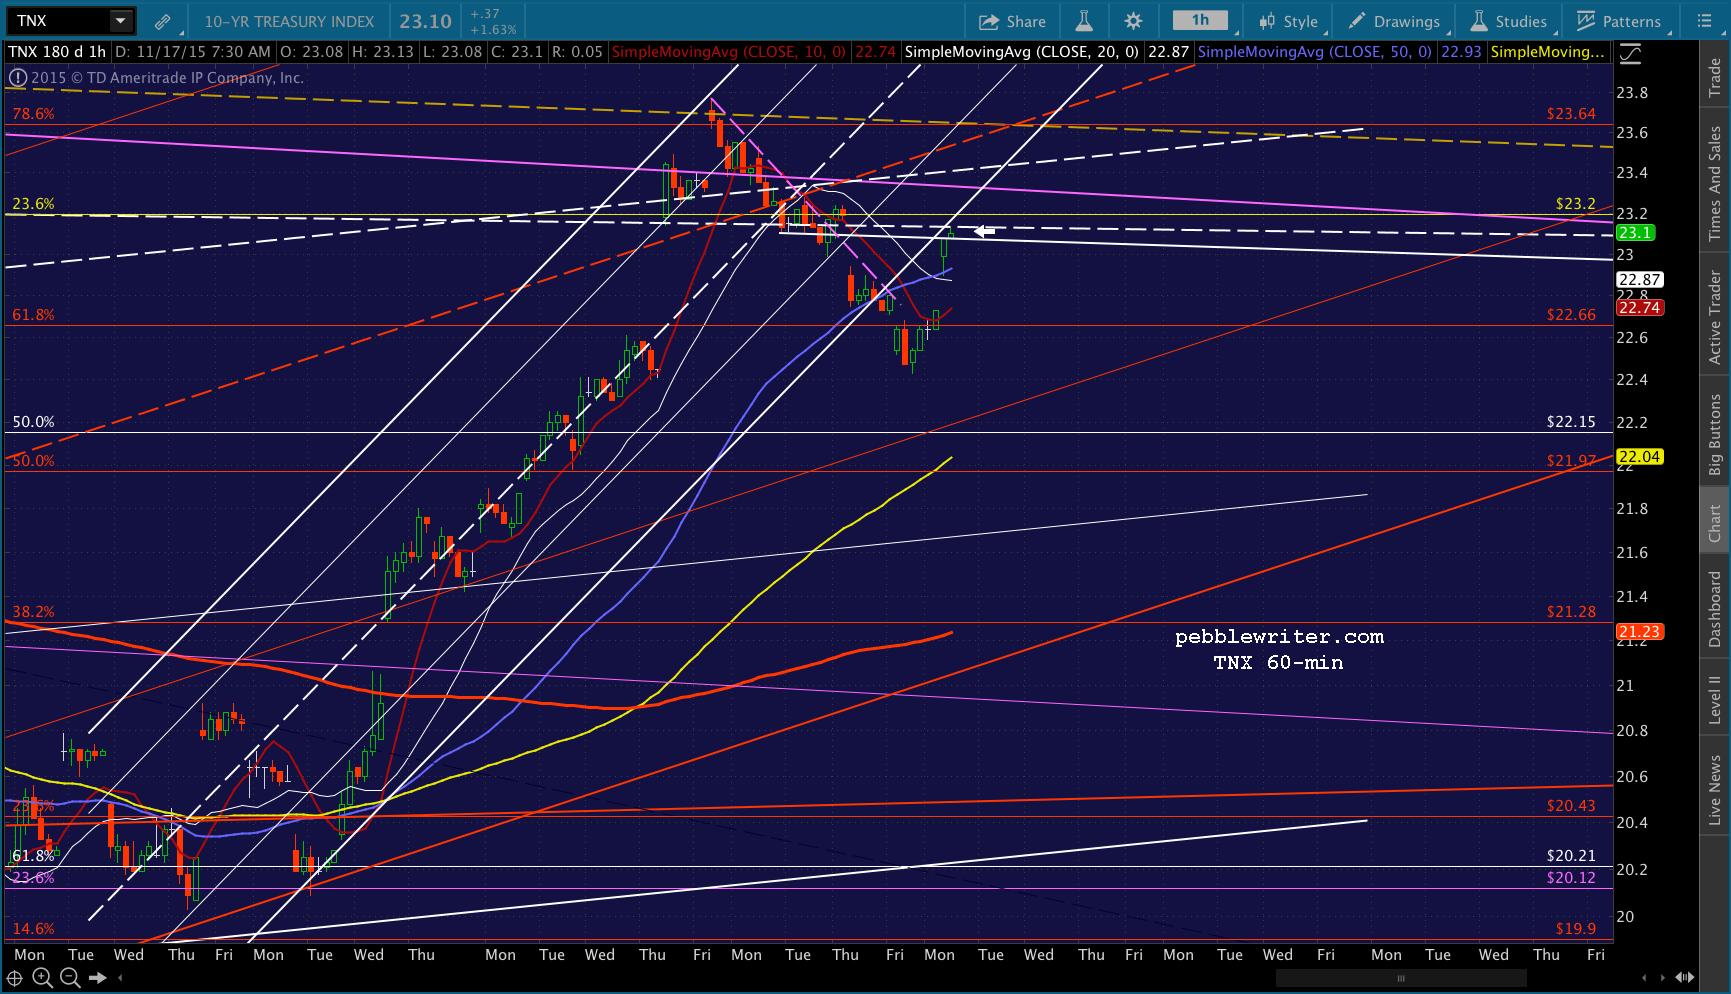 UPDATE: 11:04 AM
 Tight stops are advised.
UPDATE: 11:15 AM
Back to long as USDJPY just popped back above the red TL. I think they’ll try another push for the actual SMA200 and possibly the megaphone pattern top at 2066.20ish. Note that this could easily be a head fake — especially as the euro close is just around the corner.
 Of course, at some point, SPX will break out of the megaphone — maybe even here. But, it would make sense to get a reversal at the intersection of the megaphone and SMA200 — if only to trap a few more bears. And, that TNX chart has me thinking it could be a fairly substantial drop.
UPDATE: 11:34 AM
 The other key charts, in no particular order…


 USDJPY might edge higher just a little longer, as DX is drawing very close to the .886 target discussed earlier this morning.
 UPDATE: 12:29 PM
Don’t be surprised if we see some nice bounces on the way down. Bulls would very much like to treat these Fib levels such as the .618 here as backtests, so we could see substantial buying come in at each potential level of support — postponing a more serious drop until after the close. You know the drill… UPDATE: 1:32 PM
USDJPY just reached TL support, so there’s a good chance SPX will get a bounce here. I may be early, but I’ll try a long position here with tightish stops. Could be good for 2059-2060.
 UPDATE: 2:00 PM
 More importantly, USDJPY has reached that horizontal resistance.
 UPDATE: 2:14 PM
USDJPY pushed through the resistance and is testing the .886. I’ll cut loose the short position on any sustained push through it. Note that the 5-min SMA100 is approaching the .500 Fib at 2053.16. Looks like our next downside target if this turns around.
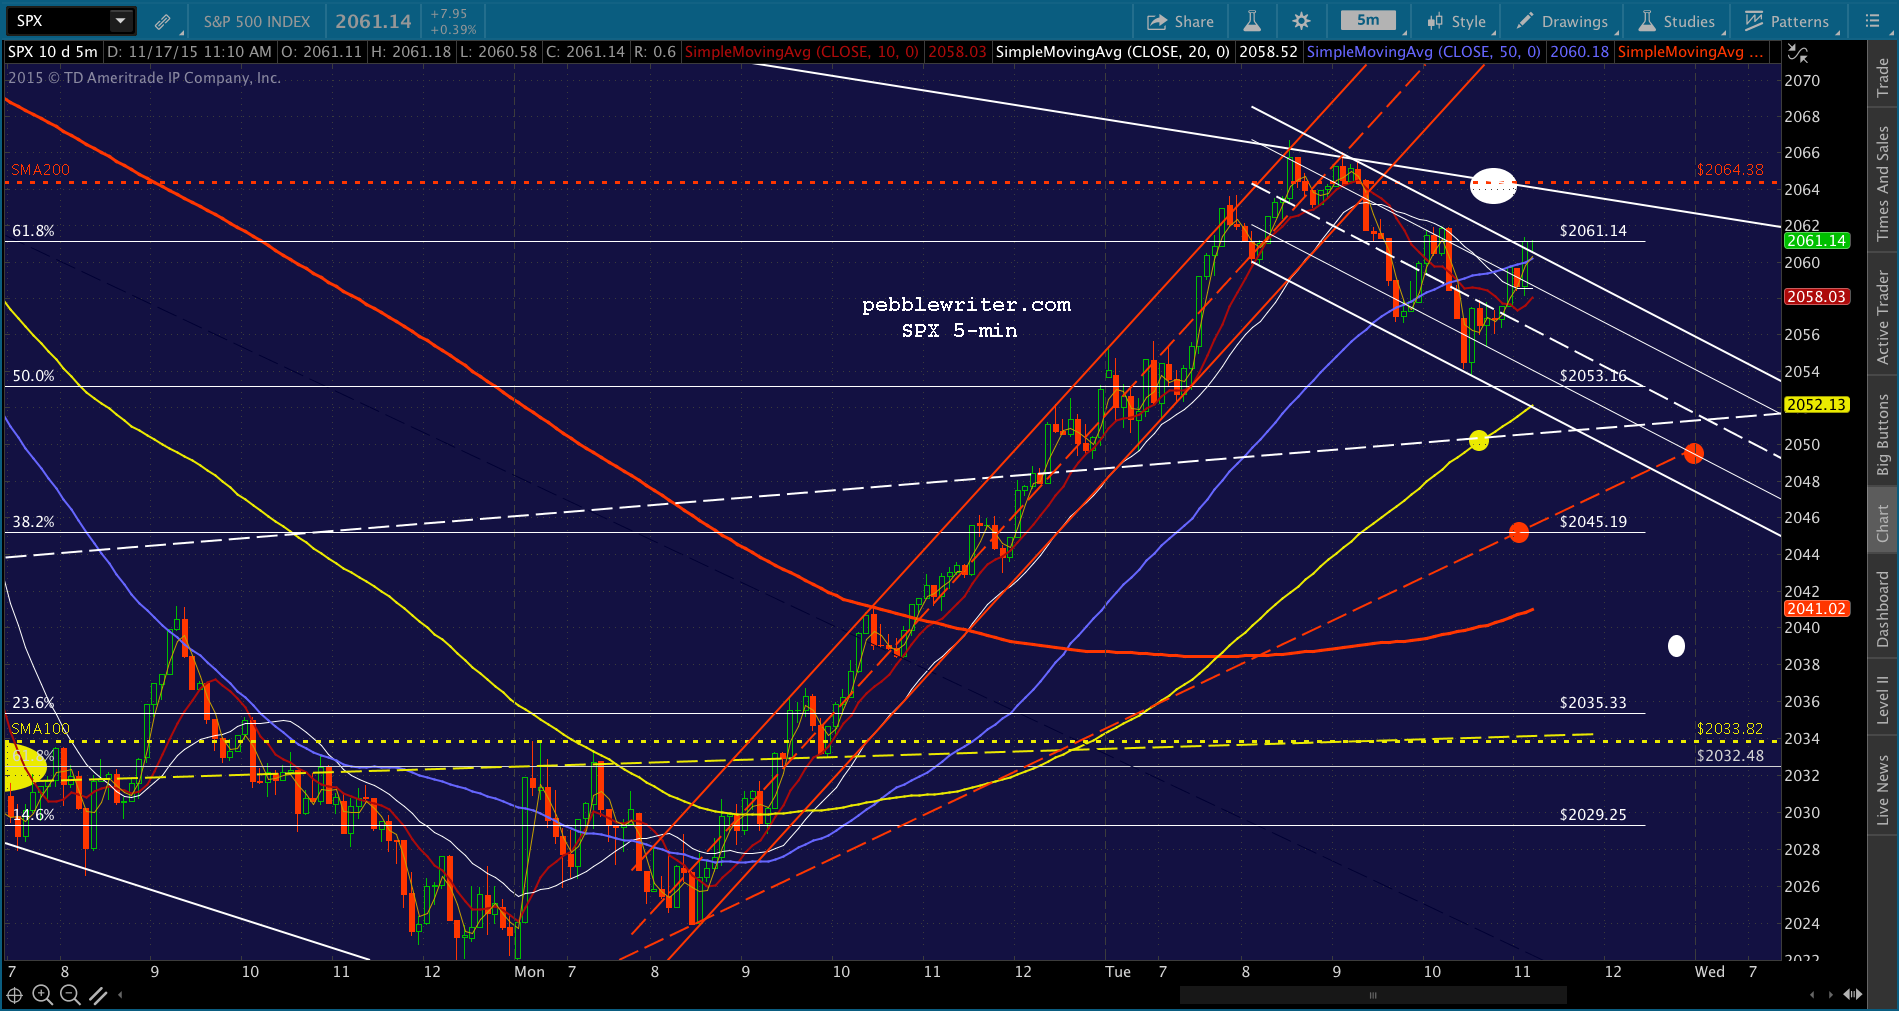 UPDATE: 2:33 PM
Just backtested the white channel midline. We should see a bounce here, especially with USDJPY tagging its SMA200 again. Switching back a long position, with very tight stops.
 Why tight stops? There’s no good red Fib retracement that lines up with it. And, USDJPY prefers TLs. Be ready to pull the plug if it drops through. However, there’s potential support at the dashed red TL, currently at 2046.88.
This is the white midline, BTW. I believe it’s fairly precise.
 UPDATE: 2:43 PM
Not holding. Back to short here with the red TL as our target. I’ve turned it into a channel (purple) just to see if it’s plausible. Not too shabby… Currently at 2046.87.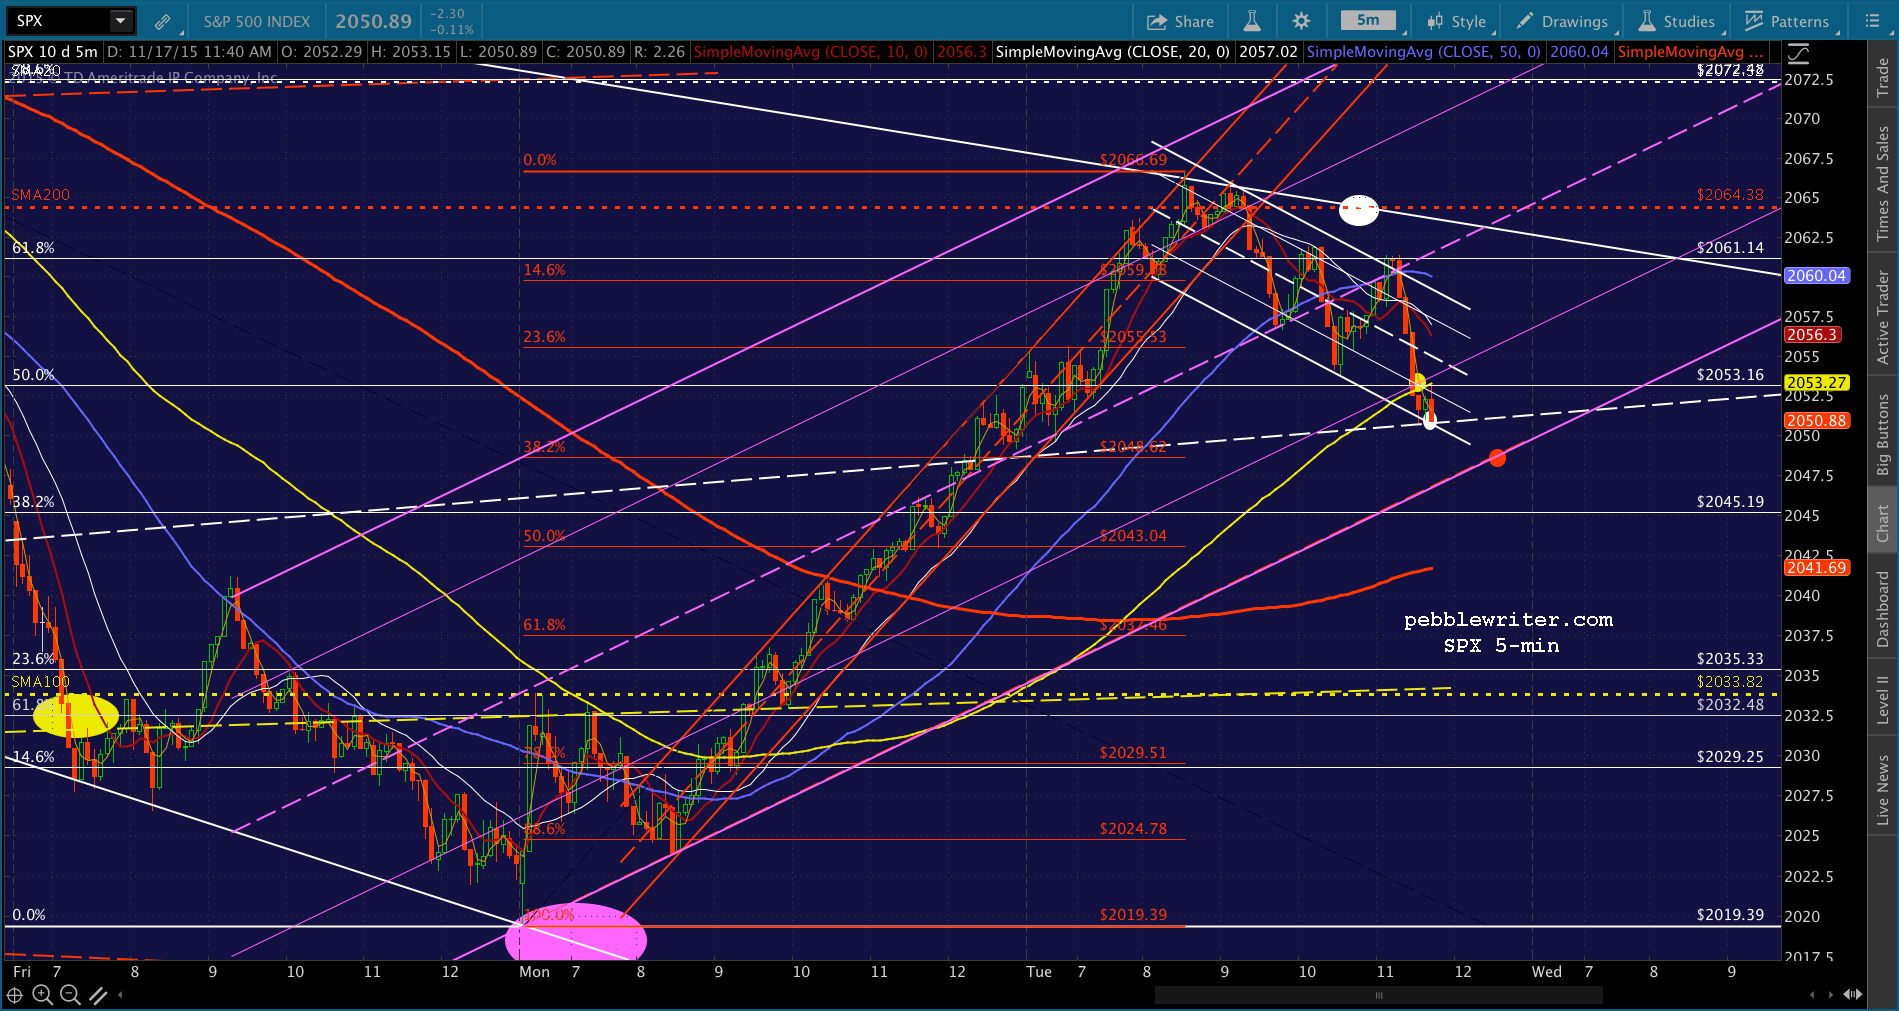 UPDATE: 2:48 PM
That’s probably close enough. If it’s going to bounce, this would be a good spot to go long. It’ll be important for USDJPY to break back above the white TL — not go down to test the purple TL again.
 UPDATE: 2:50 PM
Adjusted the channel and it seems to work pretty well.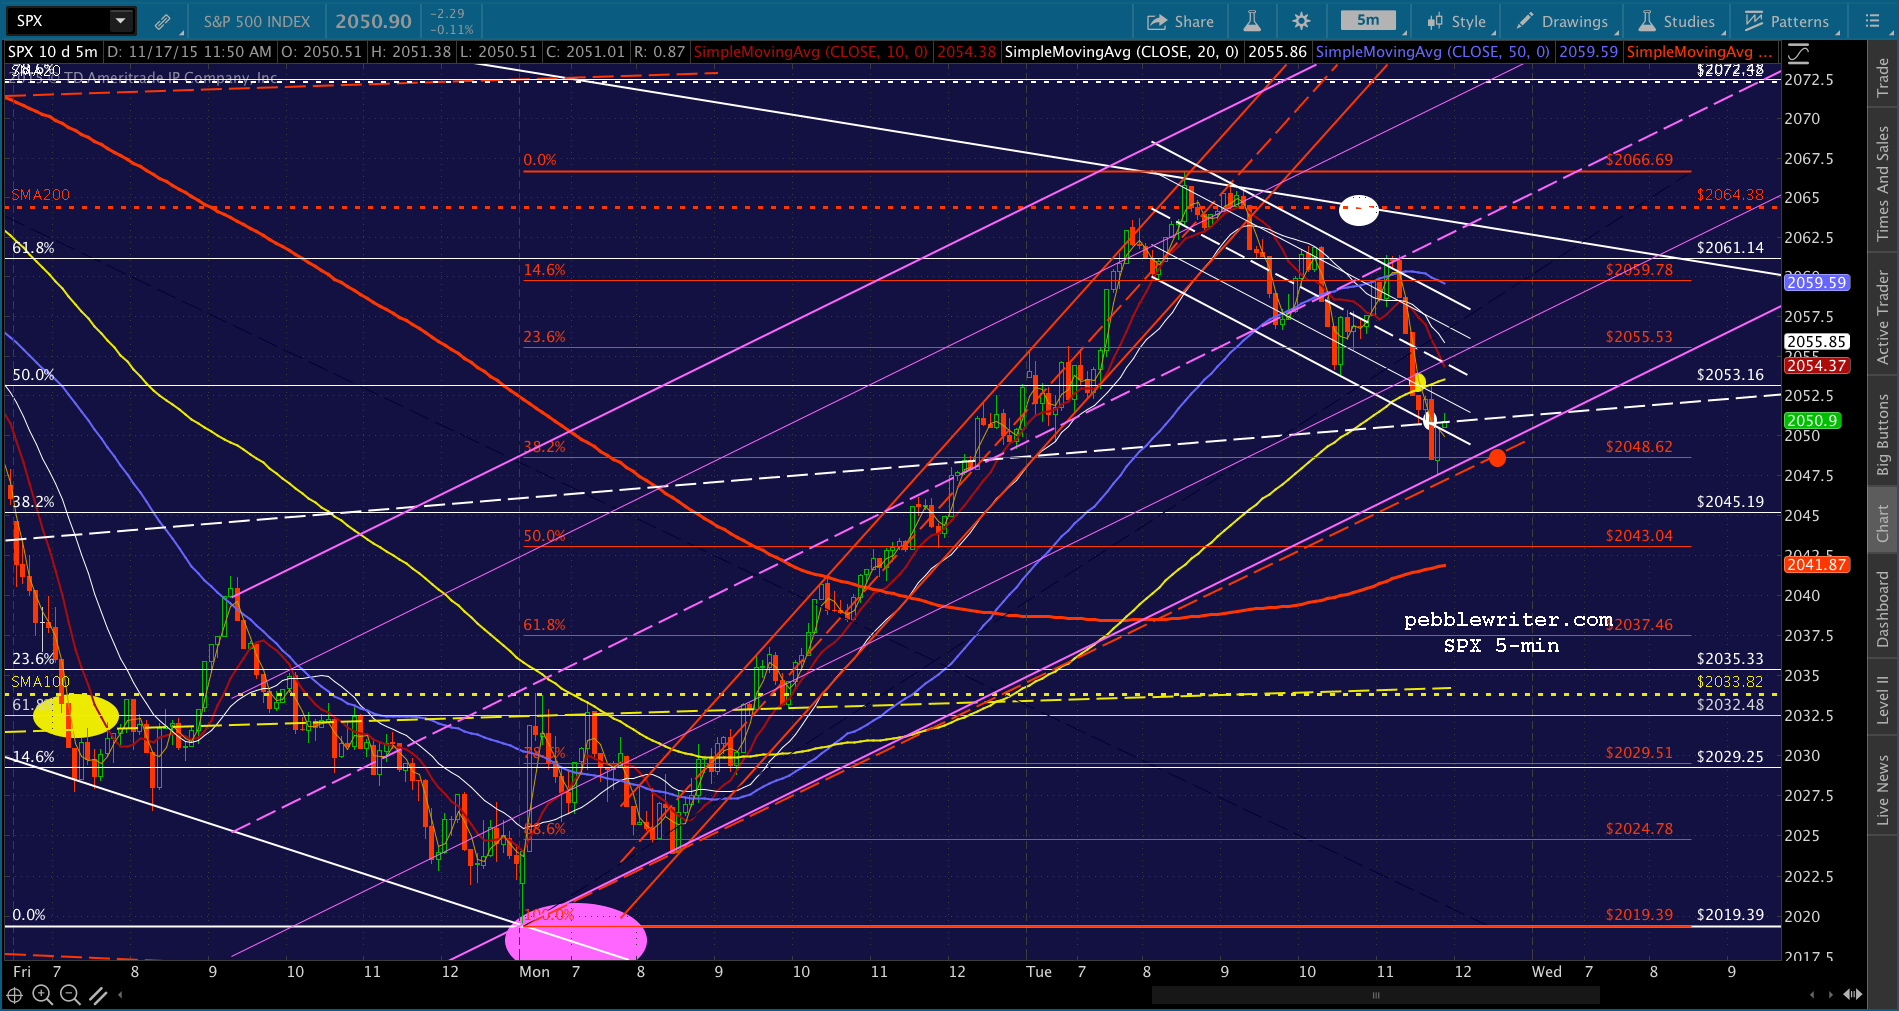 Tight stops on this one, as the SMA200 at 2041.86 is the next support. It should reach the .500 Fib at 2043.04 right around the close — making it good possibility.
The upside targets start with the 5-min SMA100 at 2054, then various channel lines. The .236 purple channel line at the red .236 Fib at 2055.53 looks interesting.
UPDATE: 3:09 PM
Think I’ll pull the plug on the long position and revert to short for 2043.04. Of course, if that doesn’t hold then we’re back to the daily SMA100 at 2033.82.
UPDATE: 3:31 PM
This could break either way. Here’s the bearish case, with a dip to 2043 at the close and 2033 a possibility either then or in the morning. UPDATE: 3:42 PM
Giving up on the short here.  Going to cash for the remainder of the day unless we get a sudden turnaround. And, USDJPY isn’t permitting it at this time.
 UPDATE: 3:47 PM
Spoke too soon. Back to short as USDJPY is plunging. Tight stops, as this is getting pretty wild. UPDATE: 3:59 PM
USDJPY is all over the map. Closed out the short here at the close.