Tag: trend lines

  • Hey Fed: You Break It, You Fix It

    In his January press conference, Fed Chief Jay Powell accepted some responsibility for the sharp rise in housing prices during the pandemic.

    “We’re also well aware that when we cut rates at the beginning of the pandemic, for example, the … housing industry was helped more than any other industry.”

    This statement implies that, were it not for the pandemic, the current inflation picture wouldn’t be burdened by sticky, elevated housing prices. But, that’s just not true. The problem developed long before anyone heard of COVID-19. During both the 2000-2003 recession and (especially) the 2007-2009 recession, the Fed slashed interest rates in order to save the housing market from steep price slumps. The Fed’s belief that it could eliminate the natural cycles which have always existed in our economy ultimately led to even worse fluctuations. The current housing crisis was brought on by fifteen years of historically low interest rates – not just the pandemic rescue.

    Now, the Fed says they don’t have the tools to fix the problem they created. That much is probably true. Runaway prices usually require a recession to bring them back to trend. But, the least the Fed could do is own up to the problem that they themselves created.

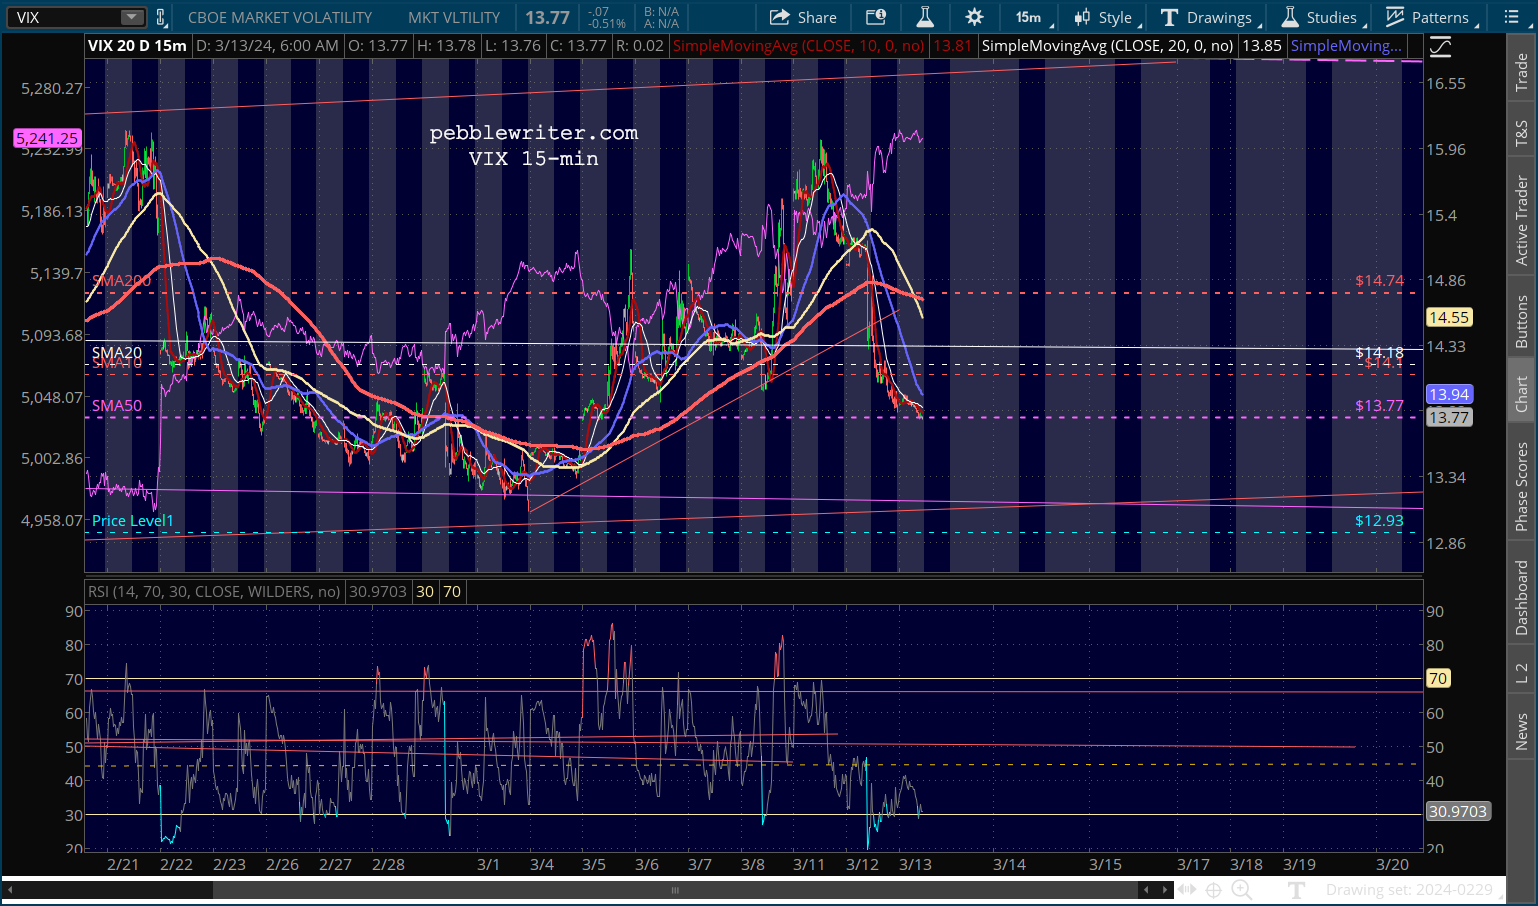
    Futures are off moderately, testing the 10-DMA as we approach the open. But, of course, VIX hasn’t been hammered back below its 200-DMA yet.

    continued for members(more…)

  • Charts I’m Watching: Mar 15, 2024

    Futures are flat this OPEX morning as algos weigh the impact of higher than expected inflation, driven largely by rising oil and gas prices.continued for members(more…)

  • On the Brink, Again

    The last time VIX cratered to below its 50-day moving average in two days, ES popped over 3%. Then, as now, SPX had committed the egregious sin of dipping below its 10-day moving average as it approached important Fibonacci resistance. The difference, now, is that SPX is on the brink of a breakout above that resistance.

    continued for members(more…)

  • Is the Meltup Over?

    We’ve waited a very long time for SPX’s 50-DMA to reach a great spot for a small pullback. It’s finally here.

    Will the market cooperate?

    NOTE: I will be out of the office between March 4-6, returning on March 7.

    continued for members(more…)

  • Charts I’m Watching: Feb 26, 2024

    Futures are flat ahead of the open as traders place their bets on Thursday’s PCE print.

    continued for members(more…)

  • Back on Track

    Stocks rode NVDA’s coattails back into their rising channels yesterday, right back to the top of already overstretched chart patterns.

    continued for members(more…)

  • All Good Things…

    All good things must come to an end, or so the saying goes. For NVDA, it’s clear that the stock’s rally since the end of 2023 was following a very steep and narrow acceleration channel. These sorts of patterns feed upon themselves. As long as no one upsets the apple cart, there are outsized profits to be had. But, when things break, they tend to break in a big way.

    Futures are slipping ahead of the opening, with numerous downside targets coming into view. Of course, the downside case would be damaged considerably if NVDA were to come out with stellar earnings and outlook that boosted ES back into the rising yellow channel. FOMC minutes are also due out.

    continued for members(more…)

  • Retail Sales Warn of Economic Woes

    Retail sales plunged 0.8% in January, far below estimates of -0.2% and last month’s +0.4%. The miss can’t be attributed solely to seasonality, as the Jan 2023 print was a massive +3.7% gain. The annual gain from Jan 2024 was a meager 0.6%.

    It has been a tough week for economic data. Inflation higher than expected and retail sales much lower than expected – sounds like a recipe for stagflation. With the UK officially sliding into recession, can the US be far behind?

    Futures have given up some of their slight overnight gains.

    continued for members(more…)

  • Oh So Close…

    The S&P 500 came within 11 cents of 5,000 yesterday, marking a remarkable 43% run since the October 2022 lows and 22% return since the October 2023 lows.

    The month of February has a mixed track record over the past 10 years, with gains and losses evenly split. Stocks frequently pause at big, round numbers – which conflicts somewhat with the fact that stocks usually melt up into CPI prints.

    continued for members(more…)

  • Charts I’m Watching: Feb 6, 2024

    Futures are slightly higher on the heels of VIX’s 7% collapse from yesterday’s highs (on a day when stocks were broadly lower.)

    continued for members(more…)