Lots of updates posted here tonight: SPX, DJI, VIX, COMP, NYA, NDX, DX and EURUSD. Summary charts here, or check the index tabs under the MARKET tab in the MENU. I’ll have the rest of the indices and the metals posted later today.
Each of these will typically be updated at least weekly, while I usually rely on SPX, VIX and DX to tell the day-to-day and intra-day story.
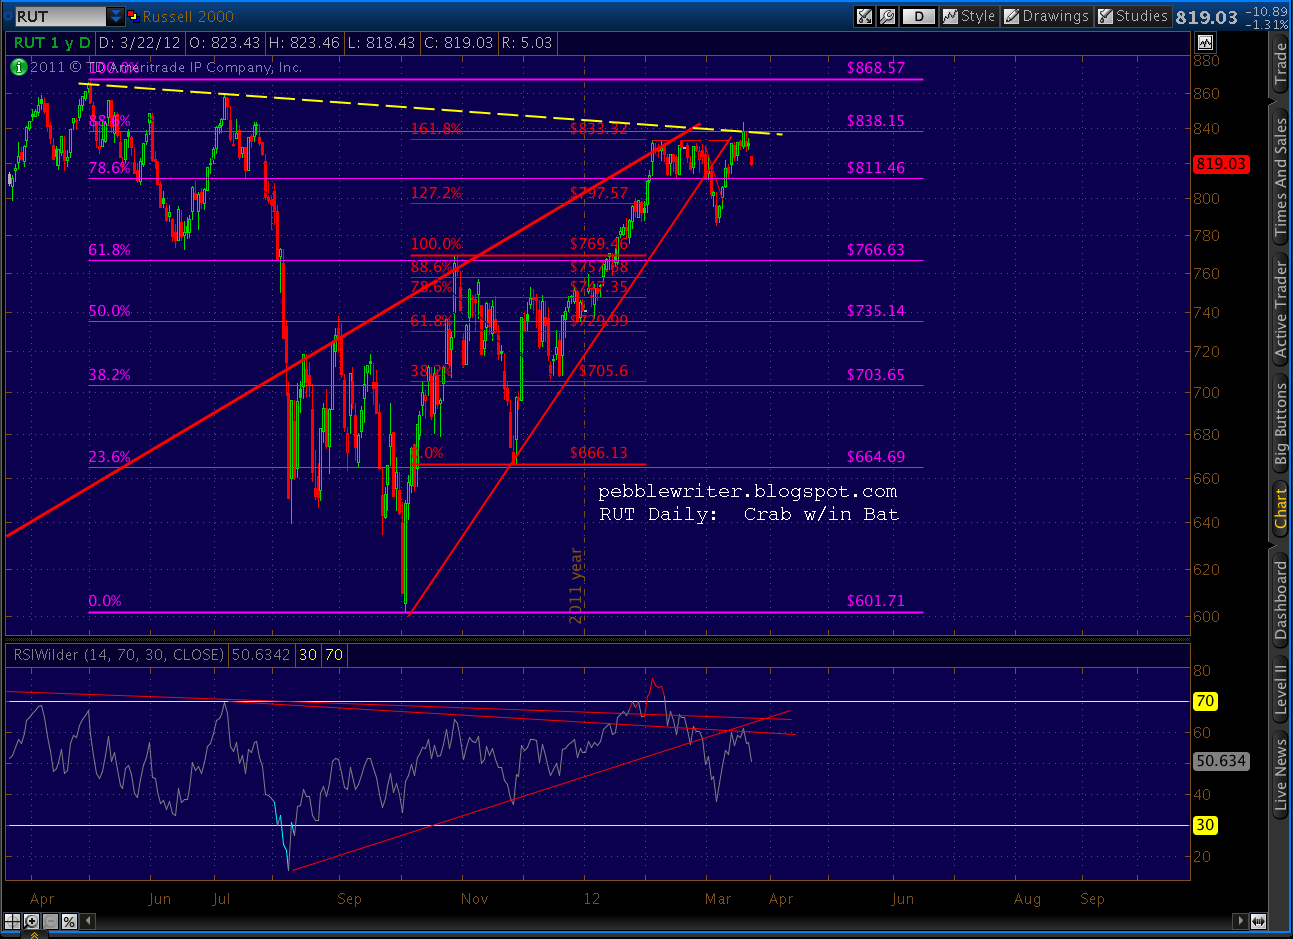
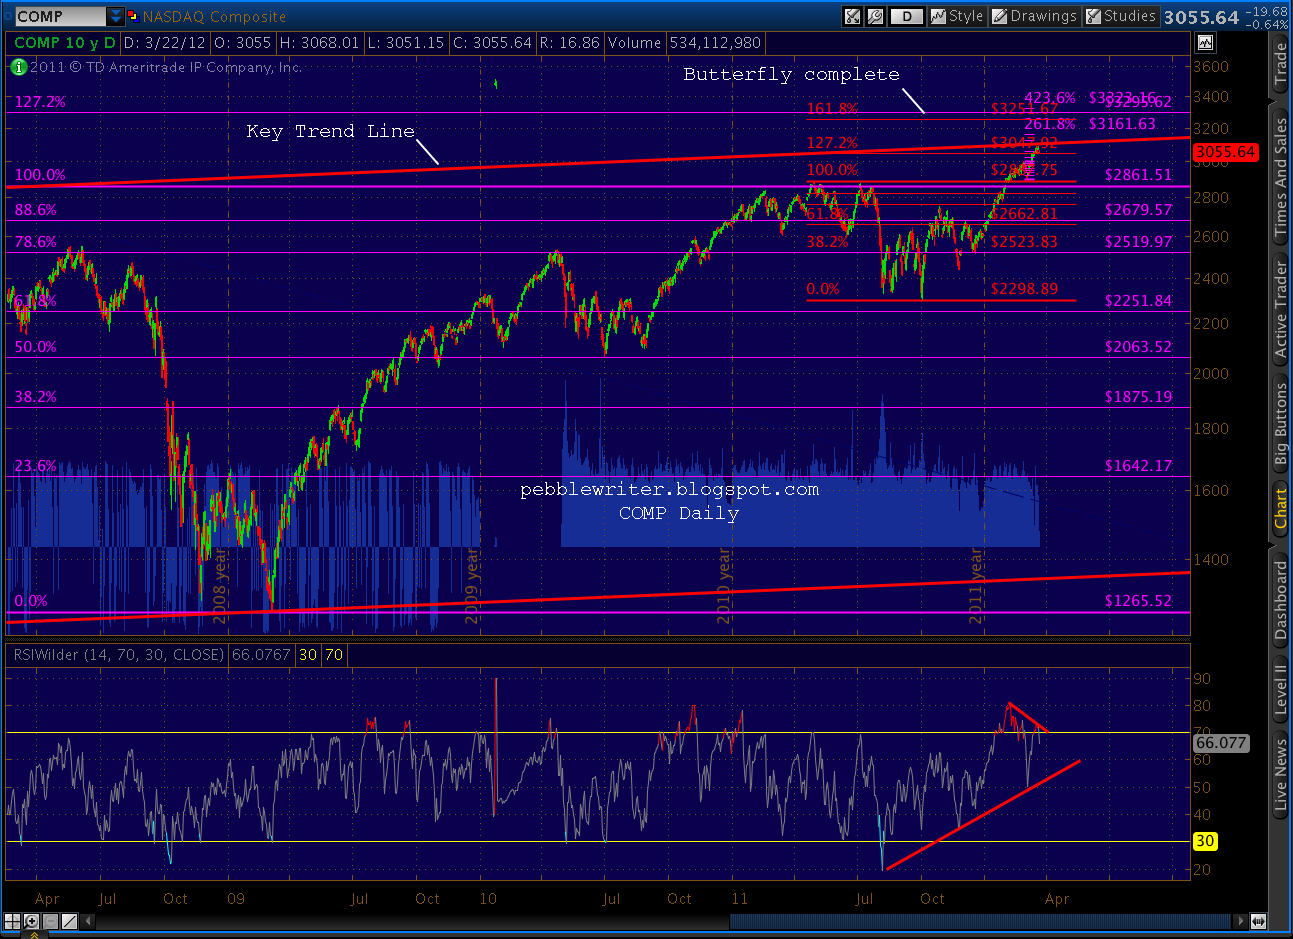
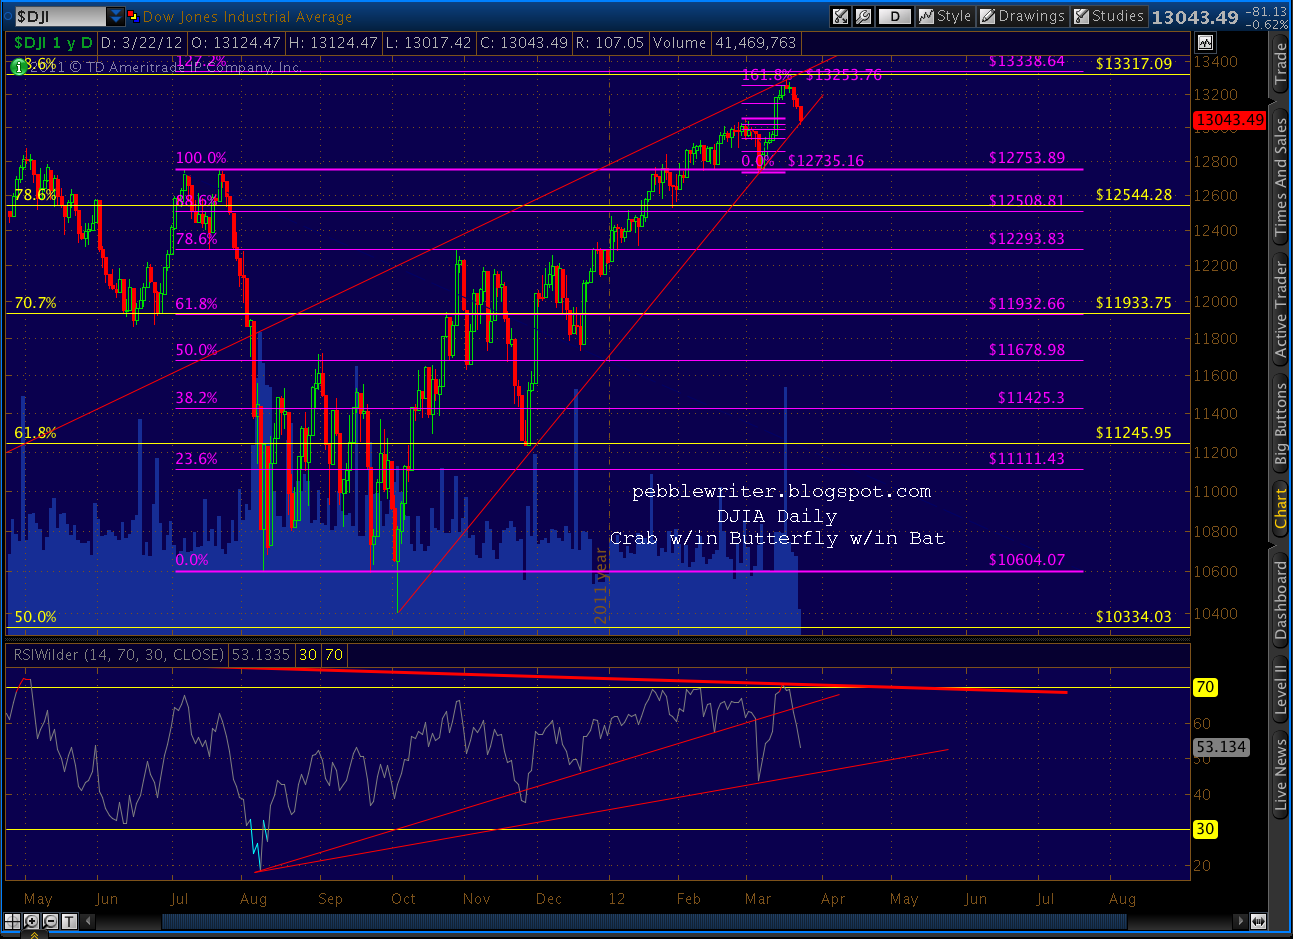
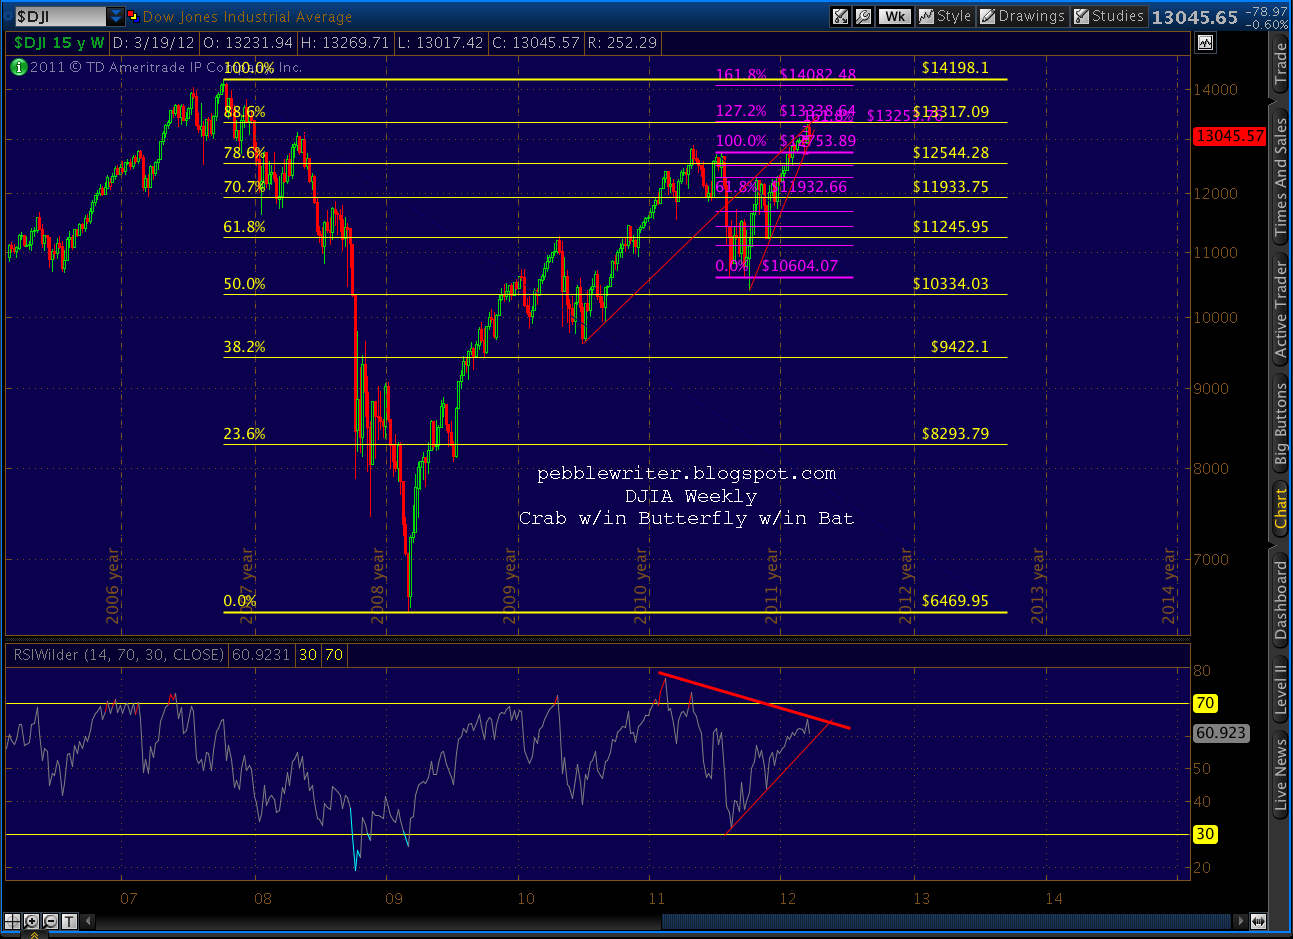
In general, I’m seeing an almost identical pattern setting up in each of these RSI charts — and it’s bearish. Unless this is a masterful fakeout, the next move should be down — possibly the result of PMI manufacturing or construction spending data due out at 10:00AM EST.
Good luck to all.


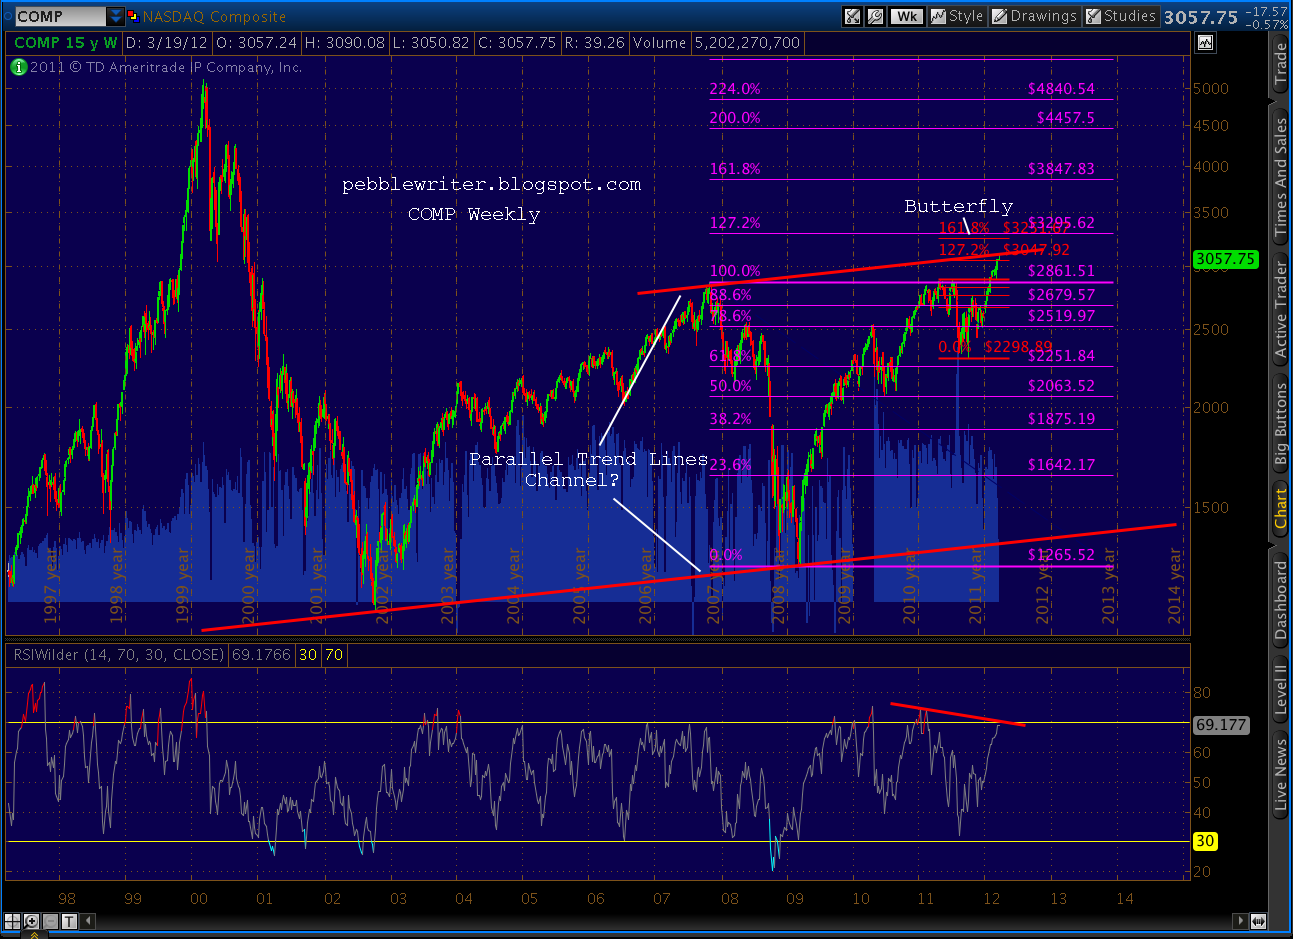
 Whether it has the wherewithal to rise up out of the large red channel remains to be seen. In the meantime, we’ll focus on the short to medium-term picture.