Posts

  • Minute Men

    Investors are on edge, waiting for insight from the Fed’s July meeting regarding the upcoming taper.

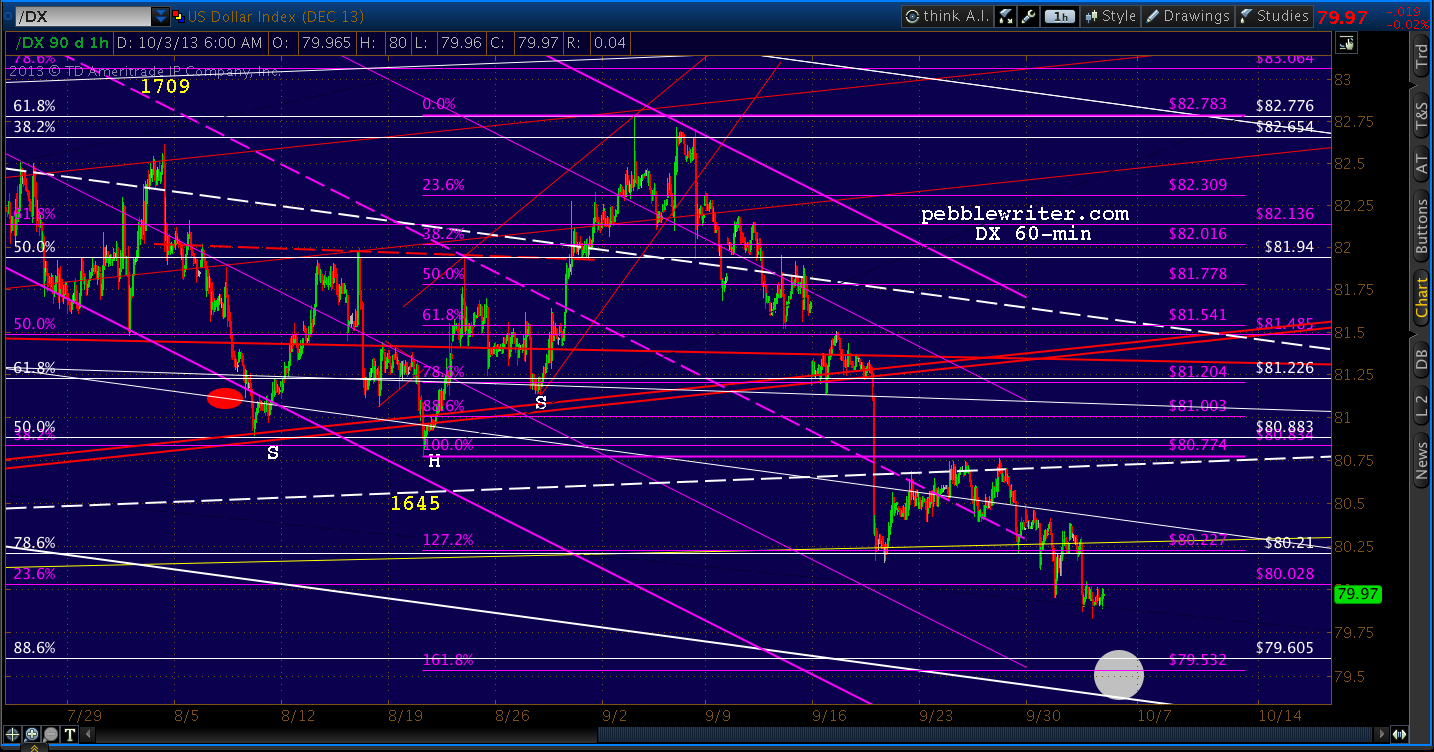
    The dollar has seemingly bottomed…

    A close-up:

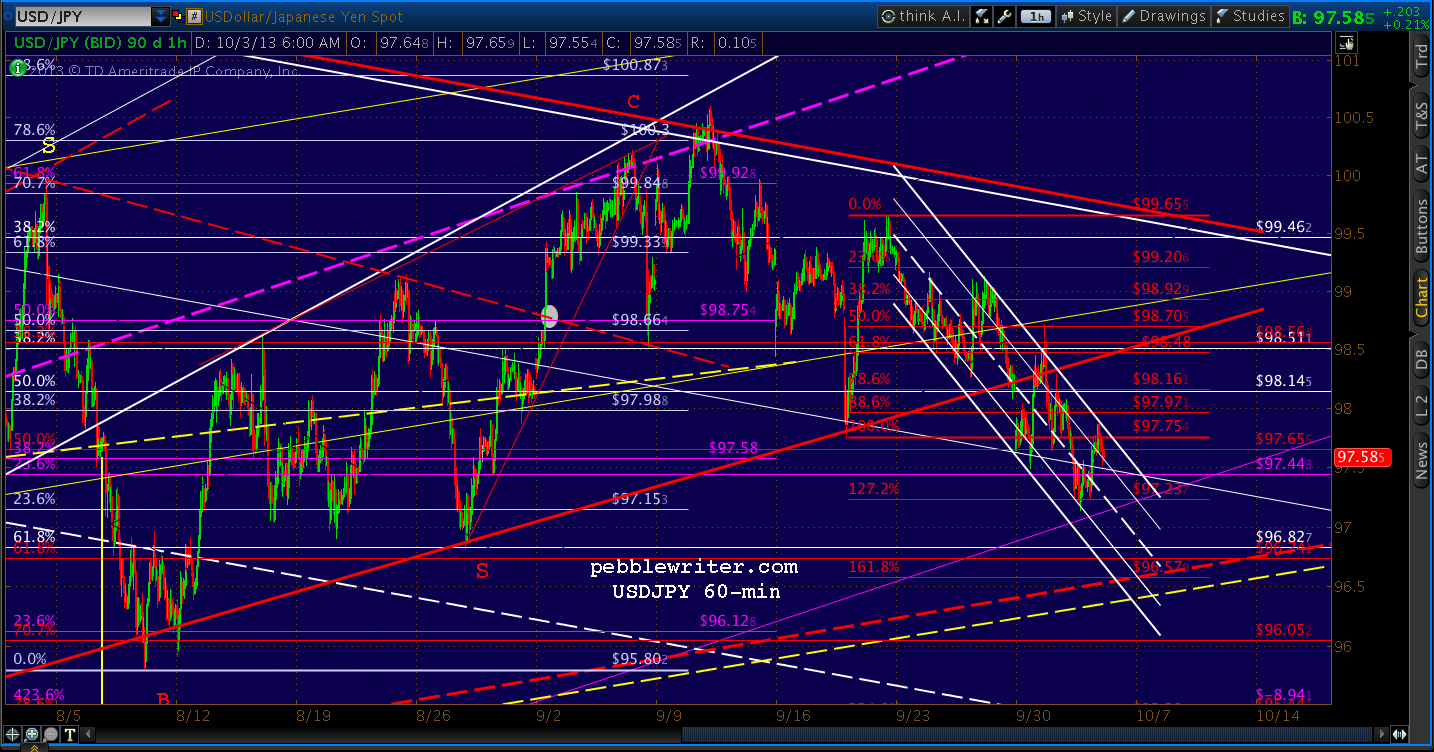
    And, the USDJPY has broken out of its falling purple channel and should retest the white channel this morning.

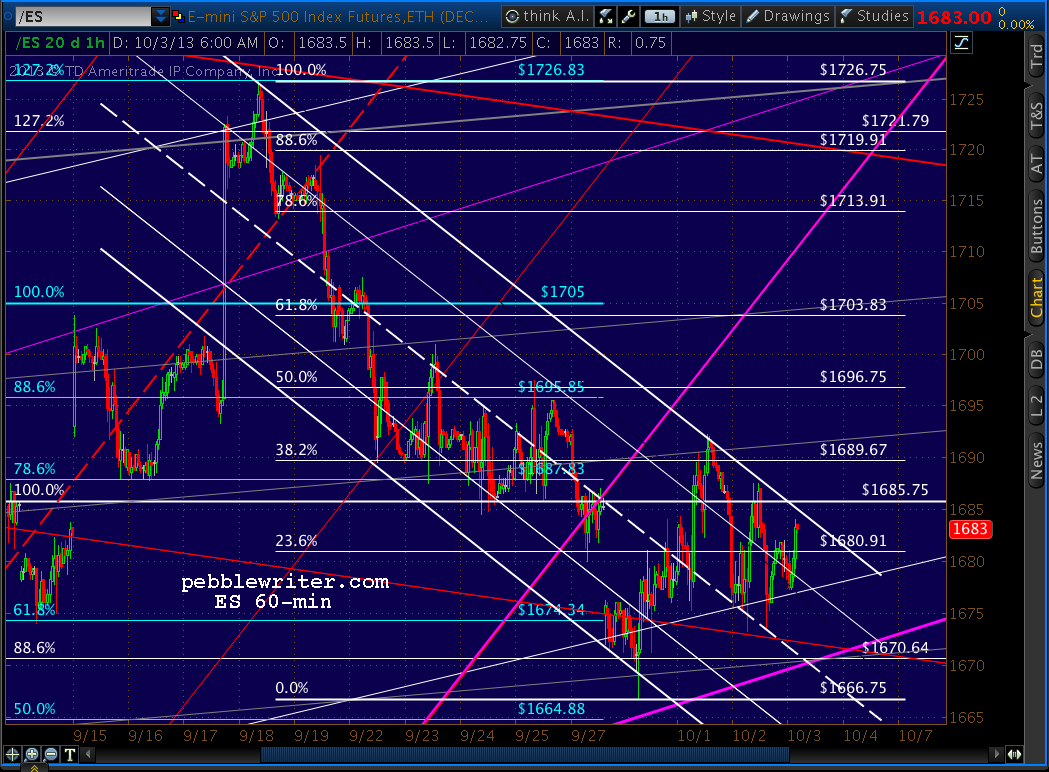
    I’m looking for yesterday’s target to be hit prior to a reversal.  Shorting on the opening and looking for 1648-1650ish.

    UPDATE:  9:33 AM

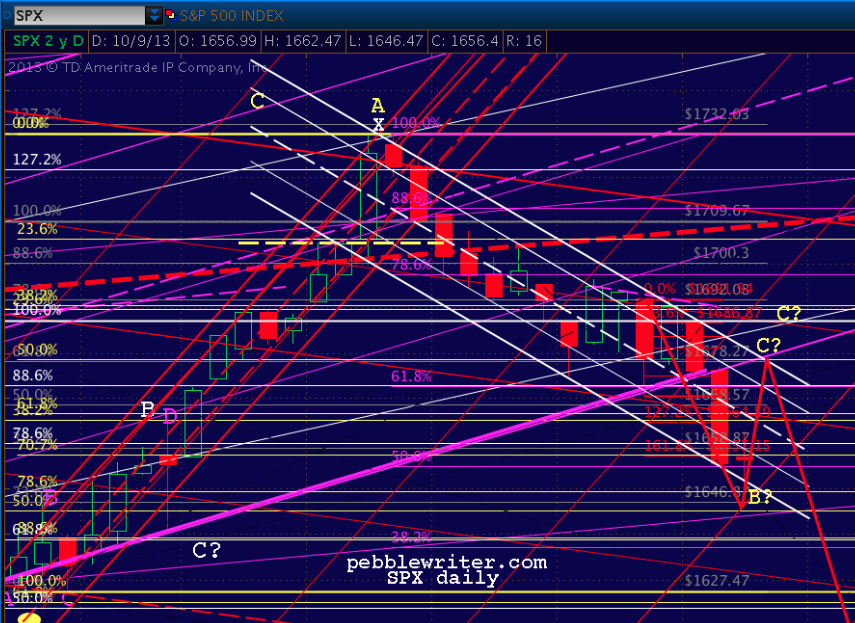
    That should do it for the downside — a little past the .886 and tagging the grey midline.  Going long here at 1647, stops at 1646.

    As we discussed yesterday afternoon, a strong reversal here could set up a nice IH&S Pattern (red) targeting 1670-1672.

    But, it will all come down to the July Fed minutes, due out at 1:00 PM.

    Treasuries are doing their part, backing off the 3.00% mark — albeit due to OMO.

    Is it engineered?  Of course.

    Will it work?  Probably.

    Will it blow up some day?  Undoubtedly.

    But, for now, the markets are willing to ignore who’s doing the buying as long as someone is buying.  We’ve seen this over and over again with the countless interventions.

    Call it PPT, call it TPTB, it doesn’t much matter.  The banks have hundreds of trillions in interest rate swaps that could sink them in a heartbeat if: (1) interest rates were to soar, and (2) they were ever required to mark their contracts to market.

    The Fed, with the budget to monetize virtually all Tsy issues (and enough of the open market sales), knows this and is buying time — hoping the worst offenders can get their houses in order before things get out of hand.

    As long as they have the ability to keep things from getting out of hand, they will.  And, as long as the MSM plays along, they probably can.  Markets are like elections.  The hard core bulls and bears are unlikely to ever change.  It’s the undecided folks in the middle who decide the winners and losers.

    When an avalanche of sell orders floods the market, we get crashes — uncontrolled events like May 2008 and August 2011.  We’ll know one’s happening when volume spikes, channels fail, patterns bust and prior lows don’t hold.

    Most of the time, however, we get mild corrections that satisfy the bears and don’t freak out the bulls.  To a chartist, they appear as channels being fleshed out. That’s what we’re facing now, though careless wording in the Fed minutes could easily change things.

    continued for members(more…)

  • Charts I’m Watching: Aug 20, 2013

    Overnight…

    The USDJPY continues to slide…

    While the EURUSD shoots up past 1.34 again.

    The harmonic picture for EURUSD just got very complicated.  Another test of the yellow channel bottom to match the last downside move?

    The dollar, of course, is taking it on the chin — dipping below the low of Aug 8, but reaching its own supportive channel bottom.

    The eminis tagged the purple 1.618 and got a bounce, and are currently up only .25.

    There’s much focus on the 10-yr note, which is threatening to breach the 3% mark.

    The harmonic picture indicates it will, with the pink .618 and white 1.618 together, just above at 30.13 and 30.17.

    But, as the chart shows, there is resistance from the top of the purple channel, the top of the yellow channel, and the yellow .382 Fib line — not to mention plenty of intervention from TPTB working to keep it below 3%.

    UPDATE:  10:30 AM

    SPX moving through the white channel line; going long here at 1651 for protective purposes. Stops at 1650.

    This is likely a fleshing out of the red channel, which has become quite lopsided with the price movement since last Thursday.  If SPX can break 1654.79, the next resistance is the white .786 at 1660.86.

    Note that TNX has dropped down to backtest its broken .236 channel line.

    UPDATE:  10:55 AM

    One wildcard is USDJPY, which — though it made a new low this morning — is approaching the red .618 Fib level.

    We might normally expect a significant bounce at the .618, but I believe the pattern is probably correctly labeled below.  Point B is already in at < .618, signalling at least a Bat Pattern down to 96.12.

    Note the pair is still trading well below the latest H&S neckline.

    continued for members(more…)

  • Update on AAPL: Aug 19, 2013

    This morning, AAPL reached the first target set for it in our Jul 31 forecast.

    This move tags the red 1.618, the purple 1.272 and the yellow .382.  The white .618 at 514.56 is just .82 above today’s high.

    Thanks to Carl Icahn’s buying (and discovery of Twitter)  AAPL got here without the use of the IH&S we were tracking.  The right shoulder never really materialized; so, the IH&S is iffy at best.

    As we noted back in July, this move could very well constitute the entirety of APPL’s rally.  It has reached the top of the purple channel.  And, topping out at the .618 of the white pattern would repeat AAPL’s habit of running out of steam at .618 Fib levels all the way down from 705.

    Last, take note of the rising grey channel line that runs through the purple and yellow circles.  This is the bottom of the channel that has guided prices ever since 1995.  It broke down in Feb, was backtested once already, and might be setting up for another backtest.

    Its breakdown definitely opens the door to those lower H&S and Fib targets we’ve been discussed over the past 6-7 months.  But, we’re likely to at least digest some of these gains and, potentially, the neckline down around 455ish.

    If AAPL can’t break out of the falling purple channel, the white .786 at 307 (and largest H&S target) looks like a very real possibility for December/January.

    If, as I suspect, it’s able to push through, then look for it to tag our 560ish target in September and our 570 target before the end of the year — ideally October.

    I like AAPL products.  I use AAPL products.   At last count, I own 3 notebooks, a desktop, an iMac, three iPhones and an iPod Touch.  But, there’s no question the product pipeline is as stale as could be.  Check out the MacRumors.com buying guide — chock full of admonishments of Don’t Buy!

    And, the glitches with existing products has reached the ridiculous stage.  The latest, greatest product — the new MacBook Air — apparently can’t hold a WiFi signal and the screen occasionally goes black. I’d love to buy a new one, but wouldn’t think about it until these vital issues are worked out (the company hasn’t even acknowledged them.)

    And, customer service ain’t what it used to be.  I’m still miffed at Apple’s insistence that I first spend $30 to buy a copy of Snow Leopard (the interim step) in order to upgrade an old MacBook from Leopard to Lion.

    In short, this is a once great company that’s stumbling quite a bit.  I don’t know whether or not it will recover.  But, they need new, innovative, bug-free product and they need it fast!

  • Charts I’m Watching: Aug 19, 2013

    The USDJPY tested the top of the small falling white channel and the .786 of the larger falling white channel.

    DX is still lurking below the purple midline. It got close, but never did tag the white .886 …yet.

    And, the eminis have done surprisingly little overnight other than completing the 1.618 tag as expected — very close to channel support.

    UPDATE:  9:35 AM

    We’re getting a little follow through from Friday’s selling, tagging the purple .382 and white channel .618 line at the bottom of the falling red channel.  We should see enough support here for a meaningful bounce (i.e. a bottom, not the bottom) and remain long from late Friday.

    UPDATE:  11:35 AM

    SPX retraced .886 of its drop from 1659.88, then reversed to retrace about .707 of that move.  Odds are we’ll see a full .786 or .886 retrace on the red grid as well, down to 1653.25 or 1652.49.

    Obviously, a drop through 1651.63 would seriously damage the odds of a bounce as big as I’ve anticipated.

    BTW, I’ve just updated the AAPL charts for those interested.  The stock has reached the target we set for it back on Jul 31. See HERE.

    continued for members(more…)

  • Charts I’m Watching: Aug 16, 2013

    Holding short this morning.  The currencies are poised for a reversal, and the overnight ramp job isn’t sticking.

    The USDJPY, in particular, appears to be in real trouble.

    UPDATE:  9:32 AM

    We’re closing in on our original target of 1653-1655.   It’s two days later than we originally expected (the red circle) but it represents the purple 1.618, white .886 and the latest H&S target — significant enough that we should get a meaningful bounce.

    continued for members(more…)

  • At Last…

    Finally!  After many fits and starts, we’re finally getting some follow through on the downturn we’ve been expecting.  There shouldn’t be any question about the H&S Patterns, now.  Our forecast from Aug 12 [see: Major Channels]:

    Look for the smallest Crab Pattern to complete at 1673 for starters.  The initial bounce could come at the white .618 at 1671.23 — roughly the location of the grey midline.  But, there’s likely more in store.  The purple 1.618/pink .886 at 1655 is our first real target.

    Keep an eye on DX, which backtested the .382 and channel midline as expected and has shot back up in anticipation of a decent sell off.  Initial target: the red .886 at 82.414.

    The USDJPY looks positively cooked after one last attempt at breaking out of the falling white channel.

    Even though things are unfolding according to plan, there are a couple of tripwires we should watch out for.  And, I’m not just talking about Cramer’s cheerleading or the inevitable Fed leak to Hilsenblabber.

    continued for members(more…)

  • Charts I’m Watching: Aug 14, 2013

    The dollar is digesting its gains of the past three sessions and could backtest the midline of the potential channel at 81.55ish.  Note the small scale .618 tag, clearing the way for the next interim target at 82.243 (red .786 and white .618) or 82.414  (red .886 and the purple .382.)

    The USDJPY has completed the backtest of the white channel and the purple channel midline as expected and should head back down now.  Next target 95.44 or 94.66 — and, soon.  The last such drop — from Aug 2 — accompanied a 27-pt drop for SPX.

    updated 9:40AM

    The eminis are trying to turn positive by the opening on very little positive news, but are running into resistance from two different channel lines.  We could see a breakout, but for now the trend remains down.  I’ll remain short.

    continued for members(more…)

  • Charts I’m Watching: Aug 13, 2013

    The dollar’s falling wedge is breaking out as expected.

    The USDJPY is backtesting the broken white channel.

    The EURUSD continues to fade after completing a very deep retracement.

    The eminis shot up 7 points overnight, but have given most of it back.

    The retail sales number was disappointing, but not so much that the Fed should abandon plans to taper.  In sum, I see no reason not to continue to hold short.

    SPX will likely take a run at the .886 at 1693.92 on the opening, but should fall back just as quickly.  I don’t believe it’s worth chasing unless it breaks above 1700.

    UPDATE:  9:45 AM

    So far, so good.

    UPDATE: 10:25 AM

    Interesting development on XLF…  A few days ago, we discussed the test of a key channel and another larger channel’s midline as well as the approach of some key Fib levels.

    XLF reached two key harmonic levels in the past month, and nearly completed the 1.618 Fib (21.06) of a large Crab Pattern set up by its 2011 decline.

    XLF didn’t quite reach 21.06 (yet), but it did fall beneath the channel midline (purple) and, this morning, it lost channel support (red) and horizontal support (the 20.35 high from May 22.)

    If it doesn’t find some help in the 199.97-20.15 range, it could easily drop to the bottom of the purple channel — a correction of nearly 8%.

    continued for members(more…)

  • Major Channels: Aug 12, 2013

    It’s sometimes difficult to keep track of the various channel lines appearing on charts — especially in close-up views.  To help with the big picture, here are a few of the key channel systems I’m tracking.

    Given their size and scope, there’s plenty of room for error when it comes to whether or not prices have crossed a particular line on any given day.  But, smaller channels that can be more precisely drawn almost always tend toward the same slope over time — often nesting, for example, between the 0-.236 or .236-.500 lines.

    I’ll update this page from time to time, but the whole point is that these channels don’t change a lot.  The market moves in accordance with them rather than the other way around.  I’ve layered them to better illustrate which has come into play at various key moments.  And, each chart is presented in log scale.

    Last, there are usually many ways to draw a channel.  The only way to know for sure whether or not a a particular placement is precisely correct is to look at it in hindsight.  But, like other chart patterns, they give us important clues as to what to expect.

    Channels indicate the prevailing direction and the magnitude of “normal” deviations.  And, they point towards something; i.e., they provide a sense of future prices in specific time frames.

    Importantly, they tell us when something has changed.  If prices shoot above or dip below a well-established channel line, it usually signals a change in direction.  Combined with other chart patterns and harmonics, they are an excellent tool with which prices can be forecast.

    Enjoy.

    *  *  *  *  *

    The purple channel system depicts potential resistance at the .382 line which, given its influence, could just as easily be drawn as a midline.  Either way, it’s obviously important.

    The yellow channel, on the other hand, depicts ongoing support.  The entire recovery since 2009 has been contained within a channel (the yellow 0.00 -.146 lines) featuring the same slope as the 1993-2000 bull market (.886 – 1.000.)   Note that any time a yellow support line has been crossed, the market suffered — sometimes dramatically.

    The white channel is easier to see in isolation.  The move since mid-2009 has been largely contained within the .146-.236 lines.  Like the yellow channel, this system depicts support and drops through key lines have often led to large losses.

    Putting all the systems together, the chart starts to look a little crowded.  But, it’s pretty clear that they’ve defined most of the major rallies and corrections.

    Major channels’ intersections frequently signal key turning points.  Prices have to “choose” one course or the other, which means a continuation of the current price trend or a change in direction.  SPX faces such a situation at the present time.

    So, what does it all tell us regarding the rest of the year?

    continued for members(more…)

  • Charts I’m Watching: Aug 12, 2013

    The eminis are flirting with danger this morning, having ducked below a key channel midline (dashed, purple) but bouncing off a smaller channel bottom and another channel midline (dashed, white) near a .786 (1674.15) for a Gartley Pattern completion.

    The dollar is threatening to break out of the falling wedge….

    And, the SPX is set to tag the neckline of the yellow H&S Pattern again.  Holding above 1686 will be key.

    I’ll play the downside on the opening with an eye towards the red .886 at 1679.86 — our target from last week.

    UPDATE:  9:35 AM

    We got a bounce at the pale blue channel midline, but I suspect it’s just to back test the neckline and that 1680 is still on the table.

    The danger for bears is a dip to tag the .886 and complete the H&S Patterns, then a rebound back above the neckline to invalidate the patterns.

    continued for members(more…)