Posts

  • Charts I’m Watching: May 7, 2014

    Bulls are going for an IH&S on the post-Yellen melt-up.

    2014-05-07-ES 5 min 0932Can it get there?  Perhaps.  But, NKD and USDJPY argue against it.  The Nikkei’s rising white channel broke down yesterday. And, this morning’s rally should be seen as a backtest.

    2014-05-07-NKD 60 1052Likewise, the USDJPY got a bounce off a .886, but merely backtested the broken grey channel.  The flag pattern/SMA200 target remains.

    2014-05-07-USDJPY 60 1052With the yen continuing to strengthen, Japanese econ data continuing to weaken, and the BOJ sitting on their hands for now, it’s hard to envision a change in direction until the SMA200 is reached.

    The tricky aspect of it, though, is that much of the damage is being done at night, when ES can be and is propped up.  For instance, a 2,500 contract order sat on the books at 1861 all night — preventing the .618 tag at 1860.  So, it’s hard to say whether ES/SPX can remain untouched by all the bedlam surrounding it.

    GLTA.

  • Charts I’m Watching: May 6, 2014

    It’s all about USDJPY, today.  The flag pattern completed as expected and the pair has broken down from the white rising channel, plunging to 101.53 so far.

    2014-05-06-USDJPY 15 min 0600The pattern targets 101.02, though there is potential Fib support at multiple levels including 101.51, 101.46 and 101.31.

    Most of the action occurred overnight, so the impact on ES has been muted.  But, there should be more downside after the latest backtest completes.  The .786 at 1864.99 would make for a good target once the .500 at 1871 falls.

    2014-05-06-ES v USDJPY 60 min 0600

  • Charts I’m Watching: May 5, 2014

    USDJPY’s white channel broke down yesterday as expected, and the grey channel bottom and yellow midlines are currently providing support.

    2014-05-05-USDJPY 60 0620 2014-05-05-USDJPY 4hr 0620The strong reversal off the SMA100 on Friday was a pretty good confirmation of a negative picture going forward. I suspect the next moving average test will be the 200-day just below 101.

    ES retraced to the white .500 in the bullish pattern, but could easily slip to the purple .618 (1860.04) or .786 (1853) if things get going to the downside.  Note that the .786 is aligned with the red channel bottom.

    2014-05-05-ES 60 0620UPDATE:  11:20 AM

    Follow the leader again this morning, with USDJPY’s bounce leading stocks higher by about 3-5 minutes.  As usual, stocks were only to glad to catch up to and surpass the pair’s move.

    2014-05-05-USDJPY 5-min 0821Only problem for stocks is that USDJPY, while taking out last night’s highs, has also completed a bearish flag pattern that targets the SMA100 at around 100.95.

    And, it’s just a pimple on the but of the large flag pattern (below, in white) that targets 100.20 or lower.

    2014-05-05-USDJPY 4hr 0821Whether it’ll be allowed to play out is another matter.  Remember, tomorrow is Tuesday.  In fact, Thursday is the only day this week without scheduled POMO.  In other words, there’s a decent chance that this bearish pattern will play out in the after hours when the banksters can more easily keep the futures afloat.

    Stay tuned.

  • Charts I’m Watching: May 2, 2014

    Some big tickets were dropped at the jobs report announcement this morning, spiking USDJPY to test the SMA100 at the top of the white channel — where it promptly reversed and tagged the bottom of the channel.

    2014-05-02-USDJPY 30 0819It seems to me that the odds are about equal of a spike to 103.8 or a plunge to 99.84 in the coming week — with the outcome largely dependent on how bad things get in Ukraine [LIVE FEED FROM ODESSA] this weekend.  The upside case would take the pair back to the LT red trend line, the .886 of the recent drop, and the top of the falling yellow channel.  Whereas the downside case is to the bottom of the channel and a number of important Fib levels.

    2014-05-02-USDJPY daily CU 0830The large red rising channel has always had two different possibly placements.  The steeper of the two would characterize everything since Apr 10 as a backtest, with the upside case at 103.8 potentially completing the backtest.  I’d keep an eye on the moving averages, about which the pair is currently bouncing.

    2014-05-02-USDJPY daily 0830The 10-year note briefly dipped below the Feb 4 lows, only to be kicked back above.

    2014-05-02-TNX 60 0846Like the Nikkei and the USDJPY, TPTB have put a very effective floor on any breakdowns — thus preventing stocks from plunging.  Like USDJPY and the Nikkei, the swings have had lopsided effects.

    Plunges in TNX have brought minimal corrections to stocks, while spikes back to former highs have produced new highs in stocks.  And, lately, the spikes have formed a series of lower highs to go with the lower lows — even as stocks make new highs.  This divergence is becoming hard to ignore.

  • Charts I’m Watching: May 1, 2014

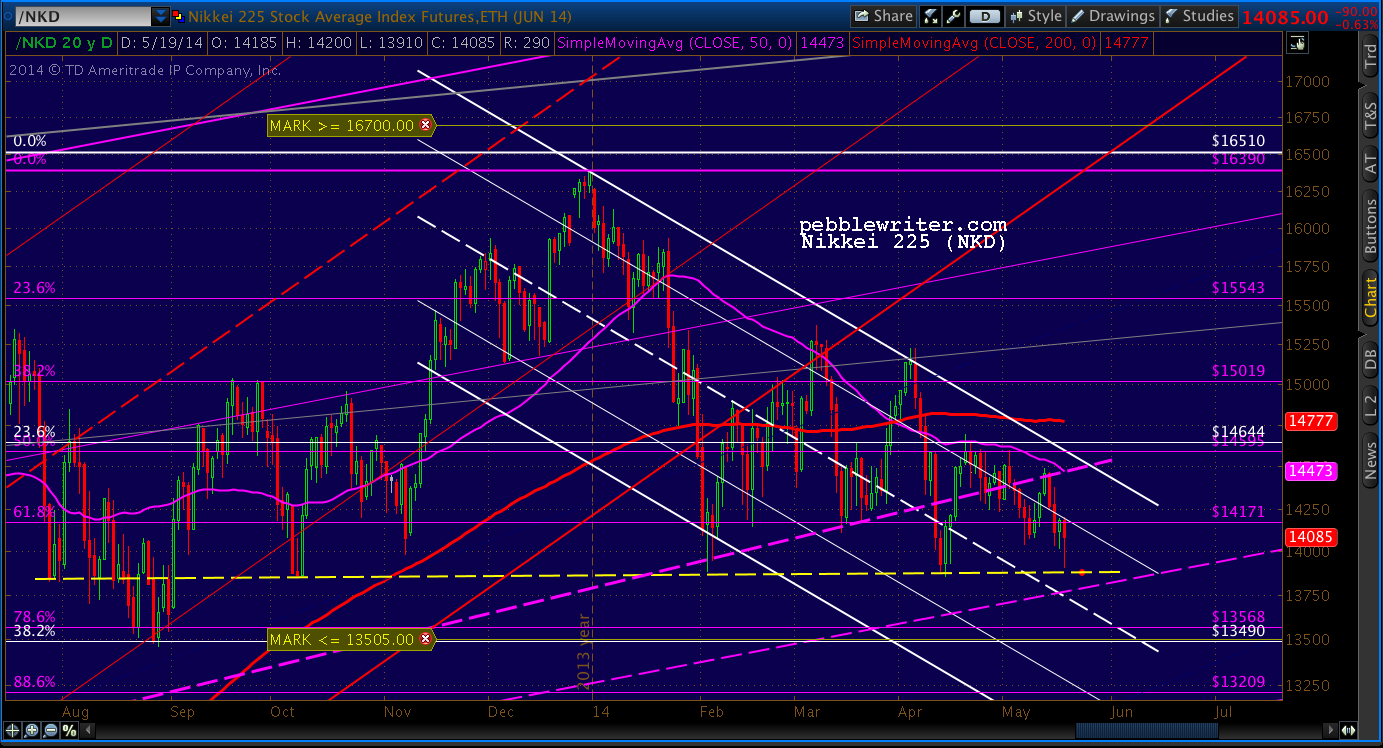
    Quick look at the Nikkei…the channels and moving averages continue to argue for a downturn and follow through on the H&S patterns.  But, note that the BOJ has continually defended the neckline.

    2014-05-01-NKD daily 0620It has run sideways for so long that the SMA10 is testing the SMA20.  But, again, the harmonics suggest at least a modest downturn — if only to test the neckline again.  Watch out if NKD fails at the moving averages — the expected outcome IMHO.

    2014-05-01-NKD daily CU 0620USDJPY shows a likely backtest of the rising white channel within the confines of the falling purple channel — a bearish setup for stocks.  Note that it’s also trying to push above the SMA20, having plunged below the 10, 20 and 50 yesterday.

    After the BOJ balked at amping up QQE in the face of obviously weaker economic signals, we can hardly expect market forces to push the pair higher.  Given the growing inflation problems for consumers, I imagine the BOJ will be content to let the yen remain in a trading range if not actually appreciate a little.

    2014-05-01-USDJPY 15 min 0634And, ES is stalling after completing a Bat Pattern within the larger Bat Pattern.  Two .886 retraces in a row could be trouble — but only if the white midline and white channel bottom are broken.  Note the sloppy IH&S Pattern in red.  It’s a mess, but in this “market” where only bullish patterns play out, who would be surprised?

    2014-05-01-ES 30 0625UPDATE:  11:30 AM

    SPX is about to tag its .886, completing the Bat Pattern off its highs.

    2014-05-01-SPX 5 min 0832USDJPY didn’t make new highs, but pushed slightly above its SMA20 to complete a .886 retrace of this morning’s drop.

    2014-05-01-USDJPY 5 min 0832

  • Heads Bulls Win, Tails Bears Lose

    Yet another display of the brokenness of the “market.”  After the 0.1% GDP Q1 GDP print, the S&P 500 futures plunged all of 4.75 points for an entire minute.

    2014-04-28-ES  1 min 0600This, on the back of the ludicrousness of ignoring the plunge in the USDJPY and Nikkei overnight after the BOJ declined to increase Japan’s QQE.

    2014-04-28-ES v JPY  15 min 0600The yen carry trade is alive and well.  The correlation between ES/SPX and USDJPY is clear.  When the yen plunges (USDJPY soars), stocks soar too because the cost of repaying the 0% yen borrowing just went down.

    Conversely, when the yen rises, as it has since year-end, stocks take it on the chin — unless it’s in the after-hours when reality is suspended.  That’s why the technical patterns playing out in USDJPY and the Nikkei are increasingly completing in the after-hours, when the bots protect US stock futures from any declines.

    What’s the point of all this?  How else could ES maintain a ridiculous rising channel such as the one below through the end of the month — thus printing a positive April after a positive first quarter?  BTW, on March 31 SPX closed at 1872.34.

    2014-04-28-ES v JPY  60 min 0600With US stock prices joined at the hip to a currency (the yen) which is openly being managed by the BOJ, there is no market anymore — just the reaction of traders to the intra-day whims of central bankers.

    Here’s the rub: the BOJ has discovered that QQE isn’t working.  Sure, it juiced their stock market, just like the Fed has juiced ours.  And, it’s arguably produced some inflation — though the latest 1.5% print was largely the result of the new higher sales tax.

    But, exports still suck — even with the cheaper yen.  And, the spiking price of imported food and fuel is killing Mrs Watanabe’s budget, already stretched by the increased sales tax and no real wage growth for years.

    The BOJ might like to discontinue injecting $680 billion per annum into the money supply (well, their banks’ trading portfolios), but who else is going to buy the $400 billion in new debt Japan plans to issue in 2014 to cover their gaping budget deficit?

    These are questions the Fed would do well to consider.

    UPDATE:  2:50 PM

    Post Fed announcement…same insanity.  Quick dip on ES to just below the morning lows to stop out the bulls, then — unless I miss my guess — a rally to SPX 1884.89+ to stop out the bears.    Don’t count on it going all the way to SPX 1887.83, as that would complete a Bat Pattern (the Apr 4 to Apr 11 drop) during market hours — very bad for the market, as the reversal would suggest the Apr 4 high was the end of the rally.

    The e-minis have already retraced .886 of their Apr 4 highs, so not a lot of help there.

    GLTA.

  • If It’s Tuesday…

    It’s Tuesday and it’s the end of the month — with averages needing a bit of a boost to report monthly gains.  Oh, and the Fed is kicking in a couple billion just because.

    The Nikkei futures look to be aiming for the white .618 (14,525) at the SMA20 (14,531) — also the top of the falling channels.

    2014-04-28-NKD 15 min 0613After yesterday’s reality check, USDJPY has been guided back above the red channel bottom and is backtesting the white channel midline and red IH&S neckline.  103 looks like a safe bet.  Note that the 10, 20 and 50 day SMAs are all down around the red channel bottom (102.4 – 102.46), so a backtest would be completely within reason.

    2014-04-28-USDJPY 15 min 0613SPX is still positioned to complete an IH&S, though as we noted yesterday there is stillthe gap down at 1844 to close.  And, just a reminder, the original conventional H&S is still in play — at least until the head is topped at 1897.

    2014-04-28-SPX 60 min 0620The only issue is SPX has heavy resistance at 1880.98… meaning it might have to wait until the after-hours to get over the hump.

    GLTA.

  • Charts I’m Watching: Apr 28, 2014

    SPX is working on the possible IH&S we talked about last week.  The purple channel is not set in stone; so, equities will have some decisions to make very soon.

    2014-04-28-SPX 60 0730Likewise, though the right shoulder is low enough to be roughly symmetrical to the left (relative to the neckline), there’s a gap left open down around the white .618 (1844 on Apr 15) that suggests a more complex right shoulder could play out.

    The Nikkei continues to drive the USDJPY, which continues to drive SPX/ES.  And, unfortunately, NKD is a mess since it last bounced off the neckline of a large H&S Pattern.  It will likely continue to consolidate in a narrowing triangle — which probaby means more chop.

    2014-04-28-NKD 4hr 0834

  • Big Picture: Apr 25, 2014

    Lots of charts to post this morning — commentary later as there’s time.  The news came out yesterday that Japan has exceeded its inflation targets. No more deflation, no more need to inflate the economy through QQE.

    Though corporations have benefited from a lower yen (though you couldn’t tell from their stock market lately), the people are feeling the pinch from more expensive imports — particularly food and oil.

    The BOJ sounds like they probably will give QQE a rest, meaning the yen will rise and the carry trade will unwind — very bad for risk assets everywhere.  Note, this doesn’t mean they will give up manipulating the currency and equity markets through strategic purchases as they have been.  But, the effect shouldn’t be as great — and, investor expectations of a 105 USDJPY anytime soon should finally be laid to rest.

    The USDJPY fell to our latest target, as did the Nikkei.  ES is off a bit, but right to channel support.  If the channels and yesterdays’ lows hold, we should see the beginnings of a nice rebound.  If they break — and, especially if the USDJPY plunges below the yellow channel midline — we should see a quick drop to 1850ish.

    First, USDJPY is backtesting the falling yellow channel midline.  Bulls need a push back above the rising red channel bottom and falling grey channel top.  By letting the pair drop in the after-hours, they avoided the whoosh that might have accompanied a plunge with heavy equities volume.

    2014-04-25-USDJPY daily CU 0615

    2014-04-25-USDJPY daily 0615

    2014-04-25-USDJPY 60 0615

    2014-04-25-ES 15 0615

    2014-04-25-ES daily CU

    2014-04-25-ES chnls only CU

    2014-04-25-ES chnls only medThe channels from the 2009 lows… Note that neither the purple nor the red are currently in align.

    2014-04-25-ES chnls only bigFibonacci levels only…

    2014-04-25-ES fibs onlyUPDATE:  10:30 AM

    I’m watching the dashed purple TLs on both SPX and ES — very close to the small 1.272’s and perfectly in sync with a similar setup on USDJPY.

    2014-04-25-SPX 15 0727 2014-04-25-ES 15 0727 2014-04-25-USDJPy 15 0724The big difference is that ES and SPX have retraced just a small fraction of its rise from Apr 15, while USDJPY has retraced .618.

    A stop at the red 1.272 isn’t justified, as the correct target Fib should be the 1.618.  But, that hasn’t stopped the bulls before.

    As we noted several times lately, this decline feels very tightly controlled — letting the air out, buying heavily with any sense that things are starting to get out of control. And they likely will if USDJPY goes tapioca during market hours.

    If these purple TLs and 1.272s break, watch the red 1.618’s and then the idealized IHS right shoulders marked above.

    SPX presents an interesting choice of right shoulder targets depending on which of the falling red or purple channel is correct.  If red, this is a backtest.  If purple, the midline is down at 1833, also the bottom of the rising red channel.

    2014-04-25-SPX 60 0753GLTA.

  • Charts I’m Watching: Apr 24, 2014

    The red channel broke down intra-day, but is back in business.

    2014-04-24-ES 60 0610The close-up shows the 4:01 rally that screwed cash market traders who shorted the red channel breakdown.  The overnight ramp job on up to the .886 was the salt in the wound.  Just to be clear, this is not a market.

    2014-04-24-ES 15 0610After tagging the red channel bottom for the second time in a week, USDJPY has put in a strong A-B-C move to a TL (red, dashed) off the Apr 21 and Apr 22 highs.

    2014-04-24-USDJPY 15 0610Note that each day’s push beyond the falling grey channel boundary has failed. This one represents the first higher high in the past week, so it’s a more strenuous effort to break the trend.

    Whether or not it can is not terribly relevant, as SPX/ES don’t require new highs on USDJPY (thin purple line below) to play the carry trade game.  Rehashing the same old highs seems to work just fine.

    2014-04-24-ES v JPY 60 0629UPDATE:  10:29 AM

    USDJPY saw an impressive reaction off that TL — took it all the way back to the red channel bottom and back inside the grey channel top.

    2014-04-24-USDJPY 5 0728There’s another TL here that might offer support at a .500 Fib level, but 101.96 would be stronger support at the .618 and yellow channel midline.

    2014-04-24-USDJPY daily 0735The bulls need a push back above the red channel bottom muy pronto, but a bounce at 101.96 would make for a stronger move.