Stocks rightly sold off yesterday, almost reaching the SMA50 before USDJPY/NKD ramping and VIX shorting arrested the decline and shoe-horned stocks to a little over 61.8% of the decline from the 1991 highs.
 On this morning’s GDP news, USDJPY reached just shy of the .886 of its decline from the 110.07 highs, reversing strongly but leaving room for one last gasp higher without threatening the politically-mandated ceiling.
The big picture:
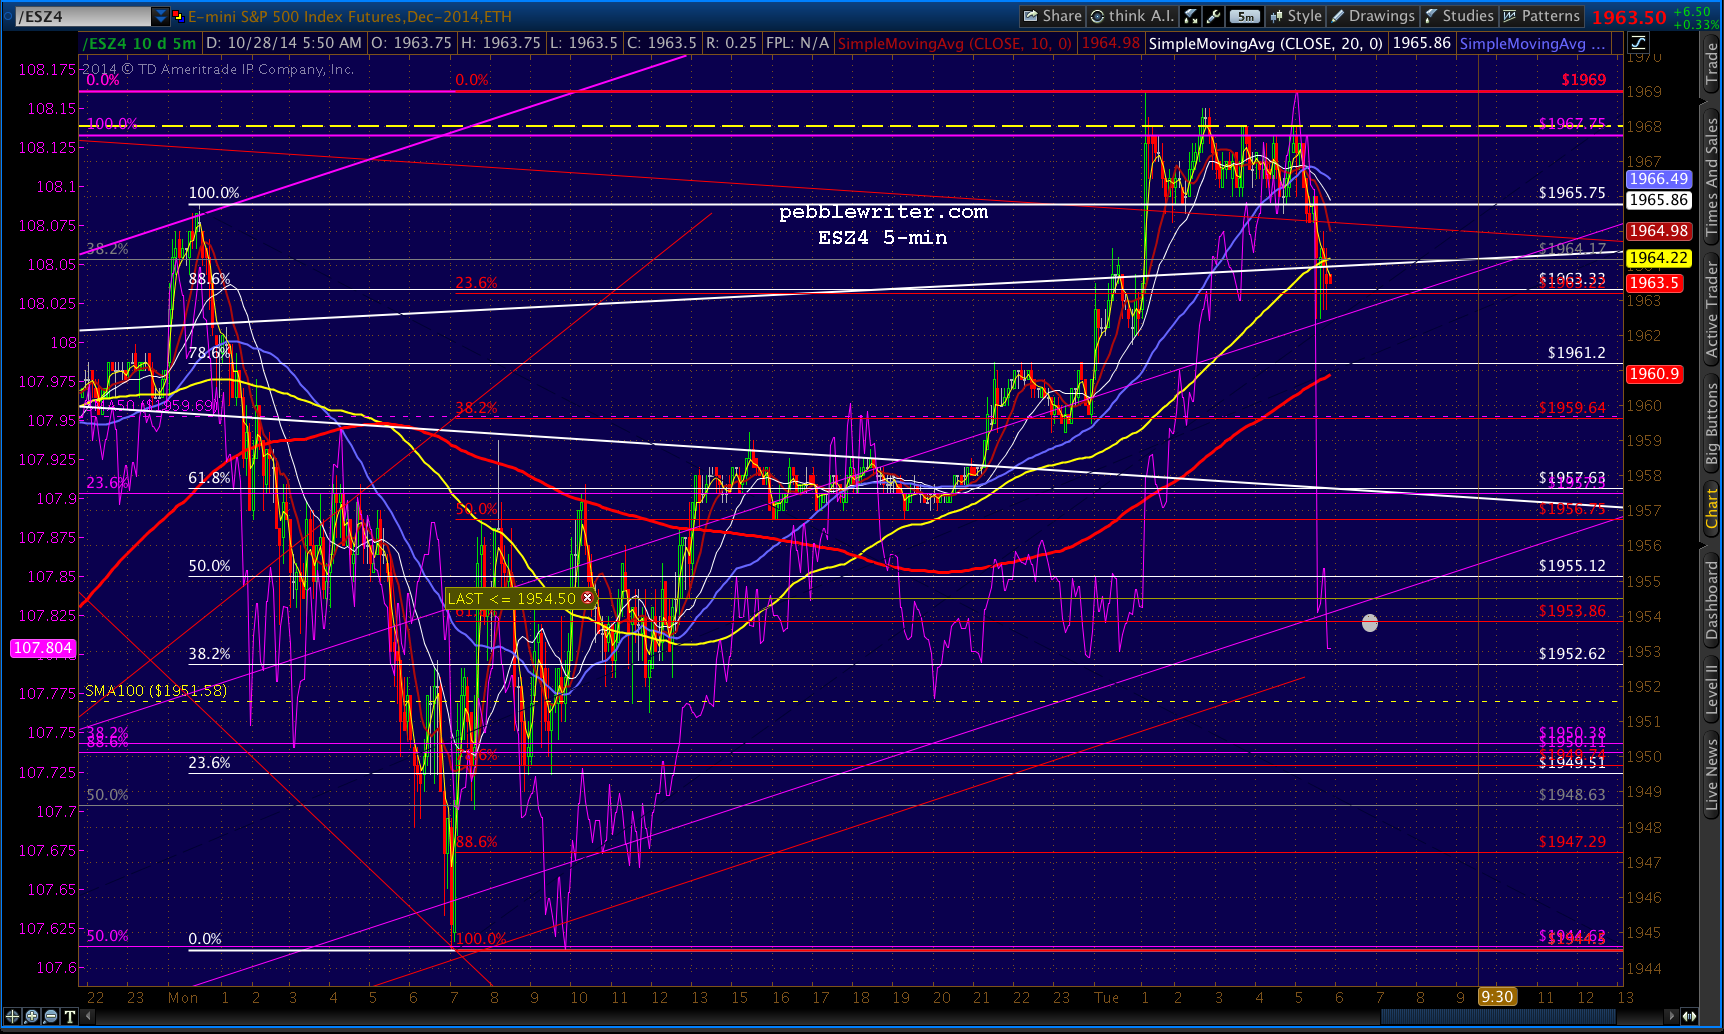
 Note that the decline from this morning’s highs has been halted at a channel midline, which could serve as a floor for any further declines. I’d keep a close eye on USDJPY and its first derivative: NKD.
 Why didn’t the market correct more? Yesterday’s ramp job did its job very well. The point was to demonstrate that the end of QE needn’t crash the market. Nothing to see here, just move along.
As can be seen from the 10-yr notes, prices even broke down through key support.
 It’s now in the process of backtesting that support (126’255) in a rising wedge — a reversal pattern. If it’s unable to break through, there is potential downside to the bottom of the white channel below — a .786 or .886 retracement of the rise from 123.

But, note that the decline has reached the .618 level — meaning that the current bounce could have more legs than just a backtest of support.
 I used to regard the 10-yr as one of the most unadulterated indicators of market direction. Now, of course, it is every bit as manipulated by central banks as any other “market.” As such, it’s not an honest indicator. In fact, there are not more “honest” indicators. But, it does provide some hints as to what TPTB are planning.
The fact that it was pounded into submission at the height of the equity meltdown shows that they are very serious about avoiding the appearance of a panic. But, in reality, lower rates really, really help governments like the US which have way too much debt on the books.
Witness what’s happening in Japan and Germany, where rates have recently gone negative. In Japan, in particular, negative rates are necessary in order to buy a little more time until Abenomics’ failure becomes clear to everyone.
The bottom line: QE got us from 666 to 2019. Without it, prices should drop like a rock. But, as long as USDJPY and VIX can be manipulated, bears will have a hard time getting any traction.
As we saw earlier in the year, USDJPY can stay in a trading range for a long, long time. They can lower it during the after-hours, when e-mini volume is light enough to keep under control with a few nudges from time to time.
As I’m writing this, SPX just reached our top Fib target, 88.6% of the drop from 2019 to 1820. It should reverse (but, probably won’t go below 1991.4 until late tonight when most investors are sleeping.) The white .786 at 1976 would be a modest downside target in an unrigged market, though I favor the SMA100 at 1963.48. The SMA10 should reach it tomorrow.
It’ll probably rally a little more into the end of the month tomorrow — whipsawing and headfaking every few minutes to shake the confidence of anyone crazy enough to short it at these levels.
 Re USDJPY, as discussed early this morning, the channel midline was the obstacle for bears.
 It just backtested the top of the falling yellow channel from 1996 that we’ve referred to before. Sure, it could pop through. At 109.45, it came up just shy of the .886 retrace of the drop from 110 to 105.19 that accompanied the equity sell-off. “Just shy,” as in “there’s always an excuse for one more rally.”
But, at these levels, opposition to the ever-cheapening yen is reaching a fever pitch (by Japanese standards) and Abe has just plain run out of room to do much more. Any further food or fuel inflation, and he’ll be given a siphon and bundled off to Fukushima to deal with the other radioactive mess Japan faces.
 I don’t know if the market can survive without QE, or the yen carry trade, or any other of the tricks that have levitated it this high. I do know that TPTB have reached the point of not caring about the scrutiny they’re under.
Only a year ago, there was at least the pretense of trying to help the average Joe. It took some work (mostly a lot of definition changing) but unemployment finally reached the Fed’s target. Yay.
Now, they’re trying to sell us on the idea that that same 55-year old who was lucky enough to find a part-time job greeting WalMart customers…what he really needs is more inflation! If he just shell out a little more for his generic raisin bran and to gas up his ’77 Caprice, everything will be just peachy.
As to the markets, when they’re not outright buying up stocks or leveraging them lower through derivatives, central bankers cum game show hosts go on TV to talk the “market” higher. No hiding it anymore. No shame.
A friend of mine, one of the smartest guys I know, insists they can keep this up indefinitely. Maybe he’s right. But, what a sorry state of affairs. Imagine what they could have done with the $4 trillion other than prop up the banks that got us into this mess in the first place.
The average age of the 607,380 bridges across the county is 42 years. One in nine is structurally deficient. We could spend $10 million on each one, and still have $3.5 trillion left over to build 10,000 hospitals, 100,000 schools, and 100,000 day cares — still leaving $2 trillion to put into serious alternative energy research so we can stop sending soldiers off to the Middle East to kill and be killed for oil.
Just think of the jobs that would come from all that infrastructure construction and operation. I dare say, they would be better jobs than WalMart offers.
This is turning into a rant, now. So, I’ll stop here. But, the next time so bobble-headed TV personality insists that Greenspan/Bernake/Yellen/Draghi/Kuroda/Abe have “saved the world,” I hope you’ll think about those numbers and the good that might have been done had someone stood up to the bankers and insisted they clean up their own mess.
Tomorrow’s a new day, and I expect the Fed will be gearing up to short some more VIX right about now. Sigh.

.



 NKD initially declined below the important .886 Fib level (in yellow, below.) Stocks did not react well. So, they took it back above the line, suggesting that the correction was done.
 In short, 17,068 is the Japanese line in the sand.