There’s something deeply satisfying about being short when the buy and hold crowd is freaking out over the massive (their word, not mine) 5% Brexit drop in the S&P 500. And, that’s what pebblewriter.com is all about — catching most of the moves most of the time, regardless of which way it’s going.
Ordinarily I wait until the actual end of the month to start any kind of membership sale. But, we’ve had a pretty good month so far [CLICK HERE]; and, I have the feeling there are a lot of folks out there who are truly confused about what’s going on.
Be confused no more. Sign up for an Annual Membership at over half-off the first year or, even better, a Charter Annual Membership where your rate is guaranteed to never increase for the life of the site. Don’t delay, as this promotion ends on July 2.
Were you frustrated a few times last month? If you’re anything like me, you found the degree of market manipulation downright stunning. But, we were presented with some great opportunities — from the 5% Brexit correction to Wednesday’s CL short, and several USDJPY shorts.
I’ll have last month’s results up this morning, but in the meantime, take a look at USDJPY. As expected, the rising purple channel broke down last night.
Our bonus chart from 7:30pm last night…
…and, the same chart this morning. We’ve talked many times about how USDJPY has been reduced to a tool for manipulating stocks (just yesterday, in fact.) Consider NKD, which has been building a sharply rising channel all week since Brexit. USDJPY needed to reset last night, ideally to flesh out the less steep white channel I expected to take form.
Note the tags on NKD’s channel bottom, labeled 1-3. And, note the placement of the same labels in USDJPY. Which was the tail and which was the dog?
There are a number of charts which indicate SPX should take a breather, now that the month/quarter are over. But, will it? It’s been a hell of a ride since popping back up above the DO NOT CROSS channel top on Tuesday, its first of three gaps higher this week.
I’ll be watching to see when USDJPY drops the rest of the way to 102.3 — a pretty sure thing.
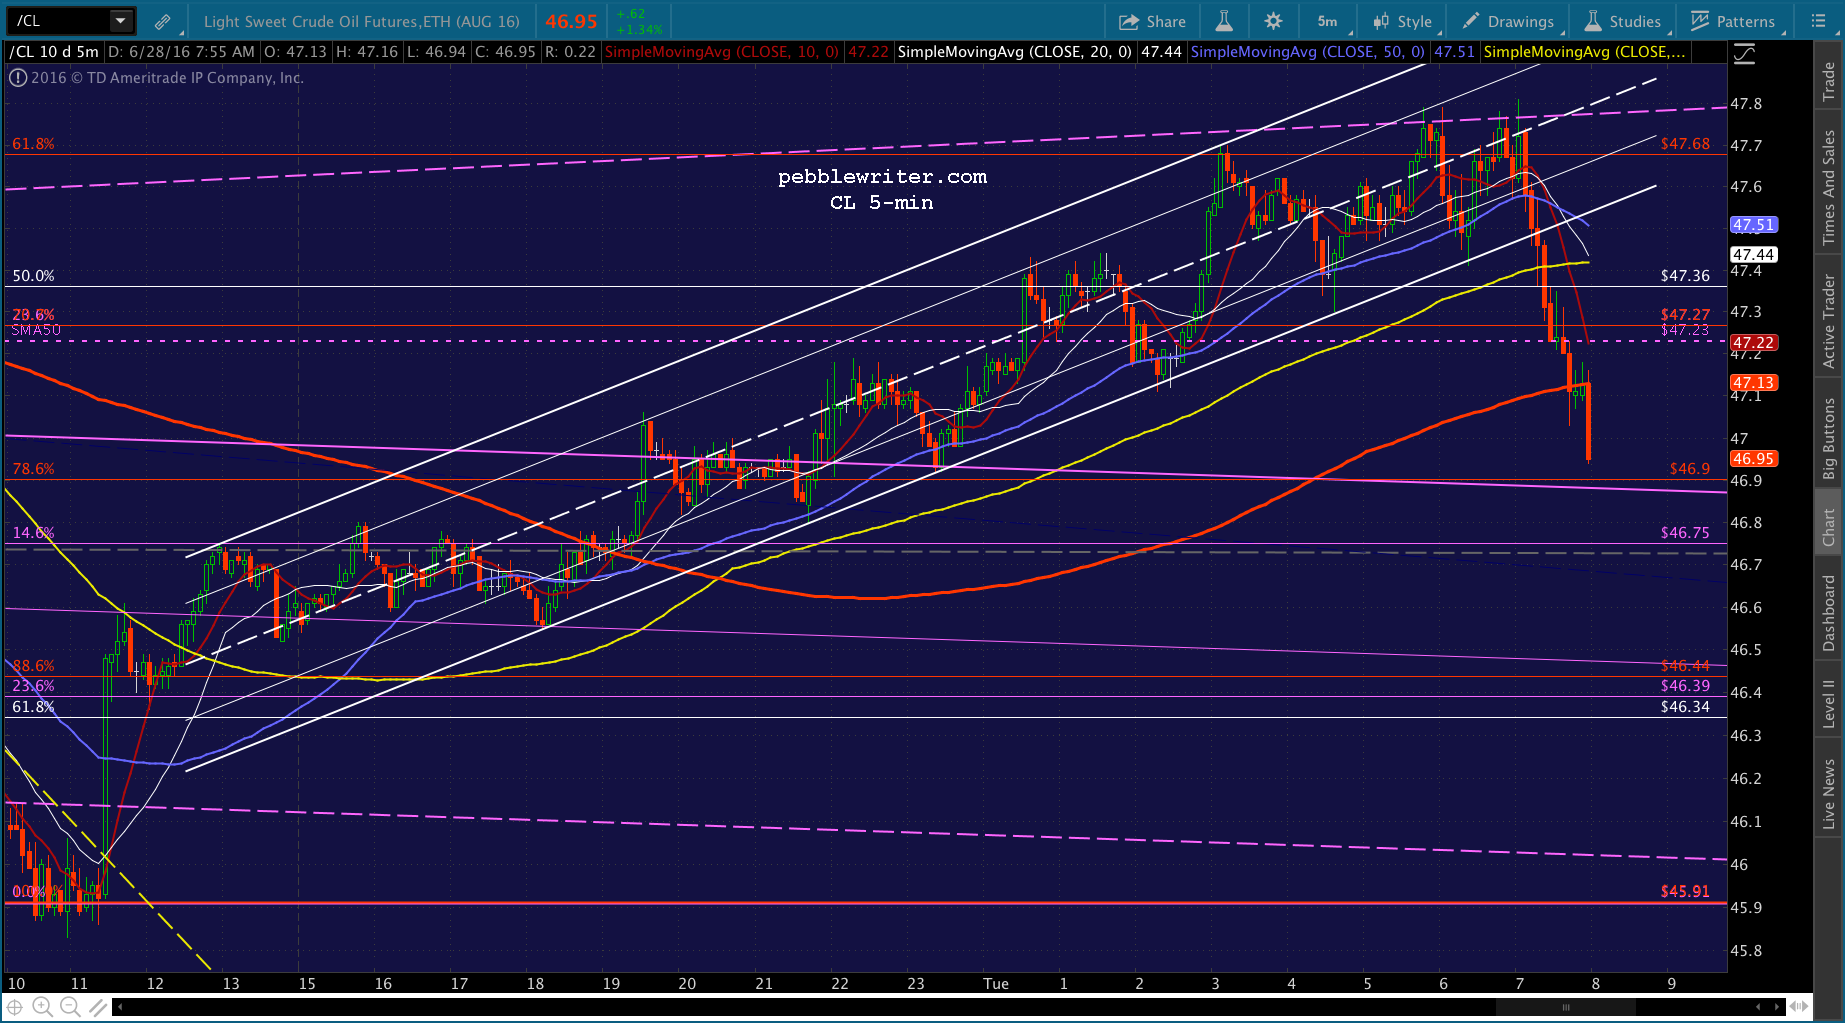
CL, which is now off 4.2% since our top call on Wednesday, suggests we’d be safe shorting here — particularly if it doesn’t pop back above the purple channel midline. With the holiday weekend just ahead, it’d be pretty easy to undo whatever damage TPTB allow today.
With SPX having recovered almost two-thirds and FTSE all of its Brexit losses (from their inflated pre-Brexit ramp job heights) by the end of the 2nd quarter, The Powers That Be can pat each other on the back. The crisis has been averted, the “markets” are safe, and life is worth living again. Mission accomplished.
After the quarter officially ends, maybe USDJPY will go back to wallowing around on its way lower. After tagging our downside target last night (a few hours late) it has managed to maintain the positive channel, and should manage to do so for a few more hours.CL, which had gained a stunning 9.1% in order to rescue stocks, is down 2.8% since yesterday’s top call. Congrats to all who were foolhardy enough to heed the call.SPX hit its .618 Fib yesterday, a sharp 4.3% spike off Monday’s lows but landing at a spot that should produce a reversal.
This has been a very difficult month, with chart and Fib patterns trashed at every opportunity by the folks who are really running the show: your friends and mine, the central bankers.
The “market” is good at melting up. The mainstream media will roll out all sorts of fundamental reasons for the rise: Brexit fear easing, oil market tightening, etc. But, it still boils down to ramp jobs in CL and USDJPY – both of which are up strongly since Monday’s lows, and both of which are being driven higher by central bankers who are desperate to erase the damage from the Brexit. continued for members... (more…)
There was some indecision about how low was low enough. But, in the end, TPTB didn’t let us down. From yesterday morning’s Stopping the Bleeding:
When ES, which has already reached its SMA200, starts popping strongly, we should have our indication. At that point, CL and USDJPY should be strong candidates for long positions… I see this morning as another Feb 11 — where CL and USDJPY will be instrumental in forcing a turnaround once the SMA200 and/or yellow channel top are reached.
USDJPY started ramping first thing yesterday morning, and didn’t stop until after the “markets” closed, when it reset so it could do it all over again. Net gains so far: 112 pips, about 1%.And, CL popped at precisely 2:25 PM, and has since settled into the kind of channel that algos love. Unfortunately, it has led CL straight to a channel midline that could prove problematic. Net gains so far: 4.3%.
continued for members...
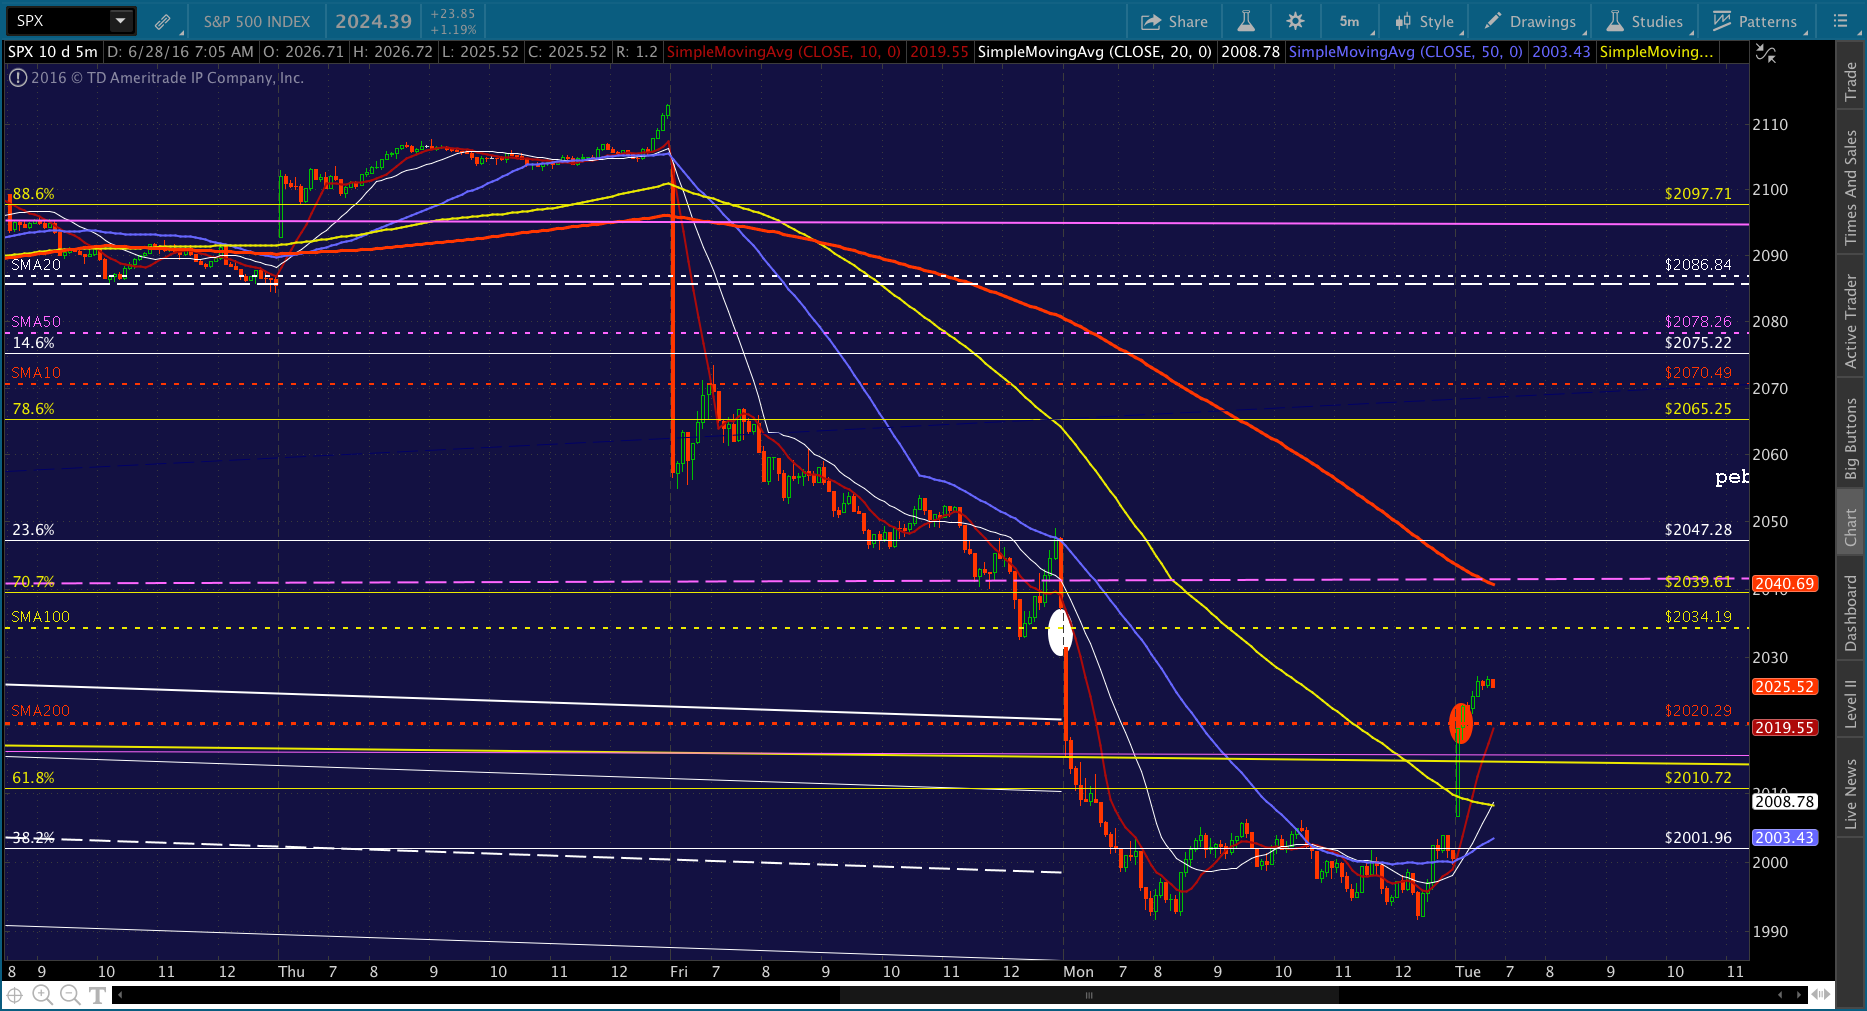
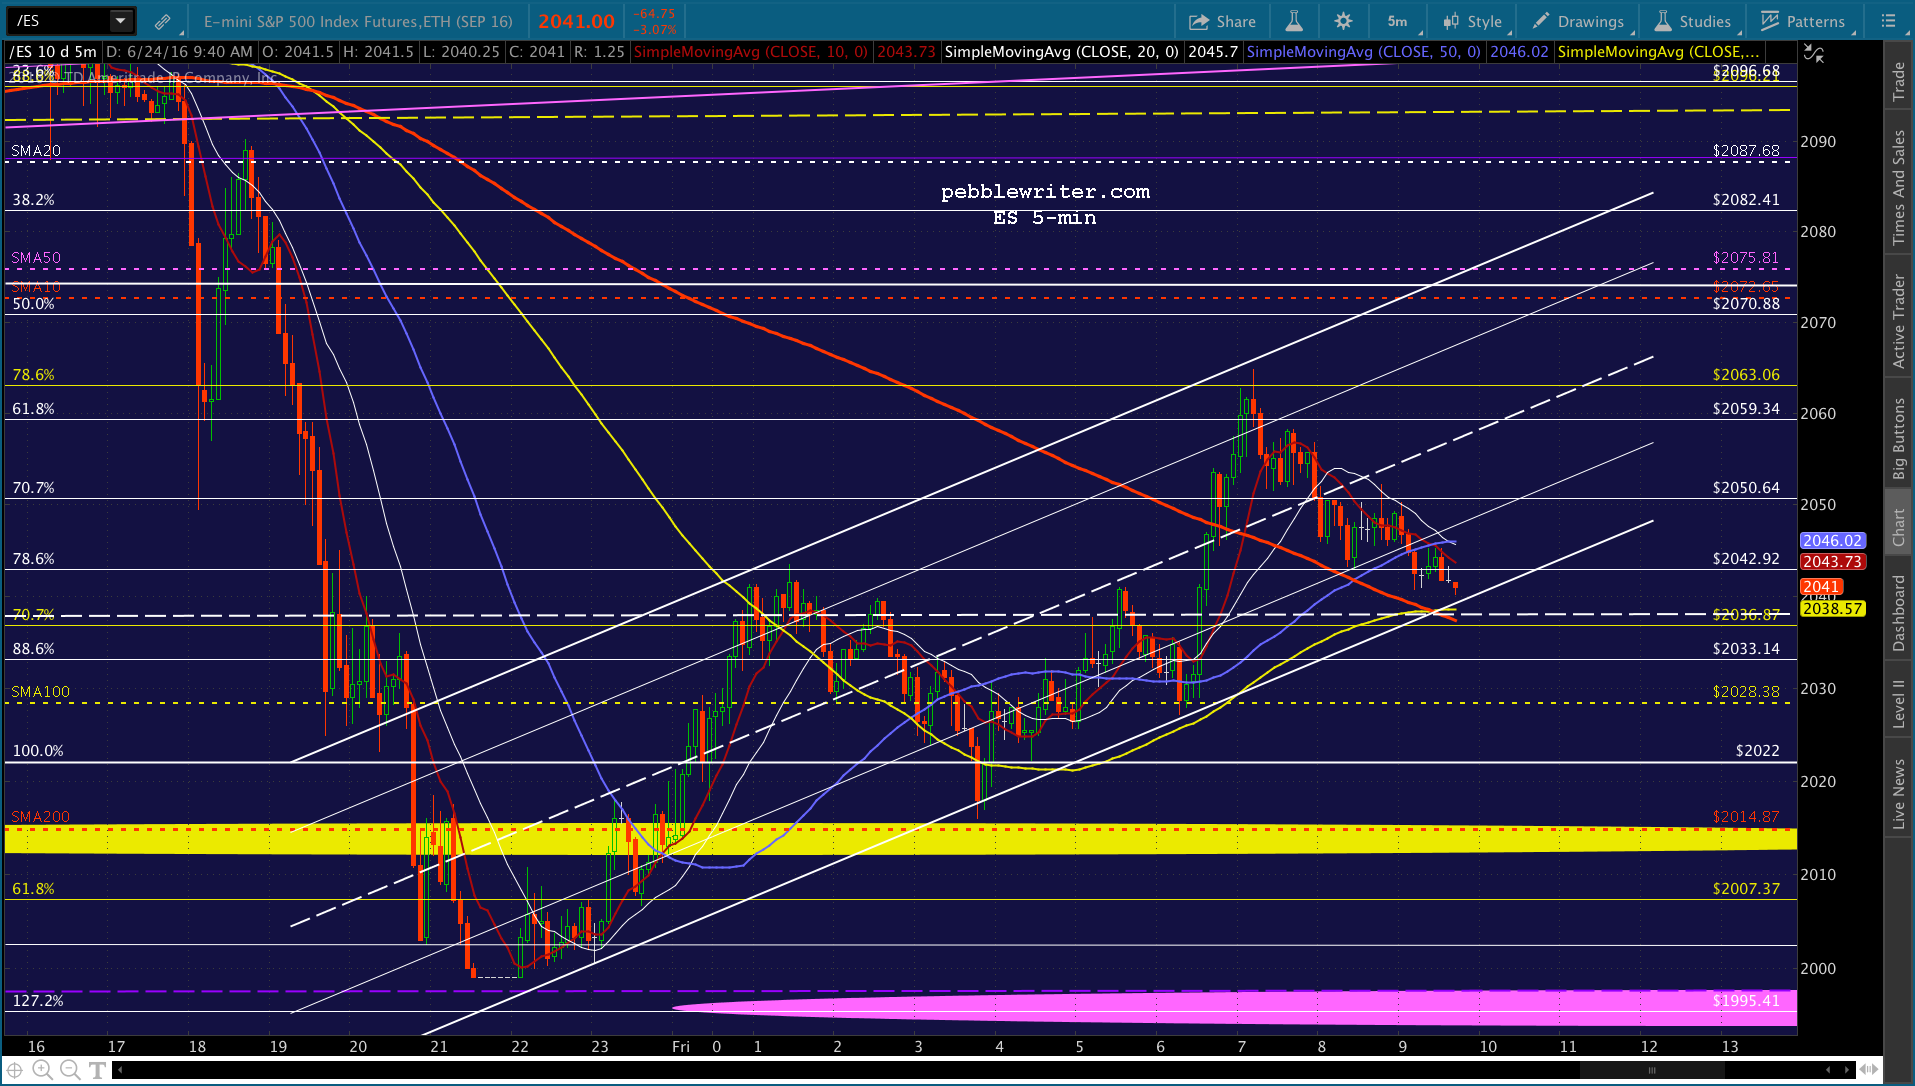
Meanwhile, EURGBP reached our second target and is digesting its gains.ES is currently up about 24 points, which coincidentally is enough to get SPX back to its SMA200 at 2020.29.After that, we’ll have to see whether USDJPY and CL can break out.UPDATE: 9:39 AM
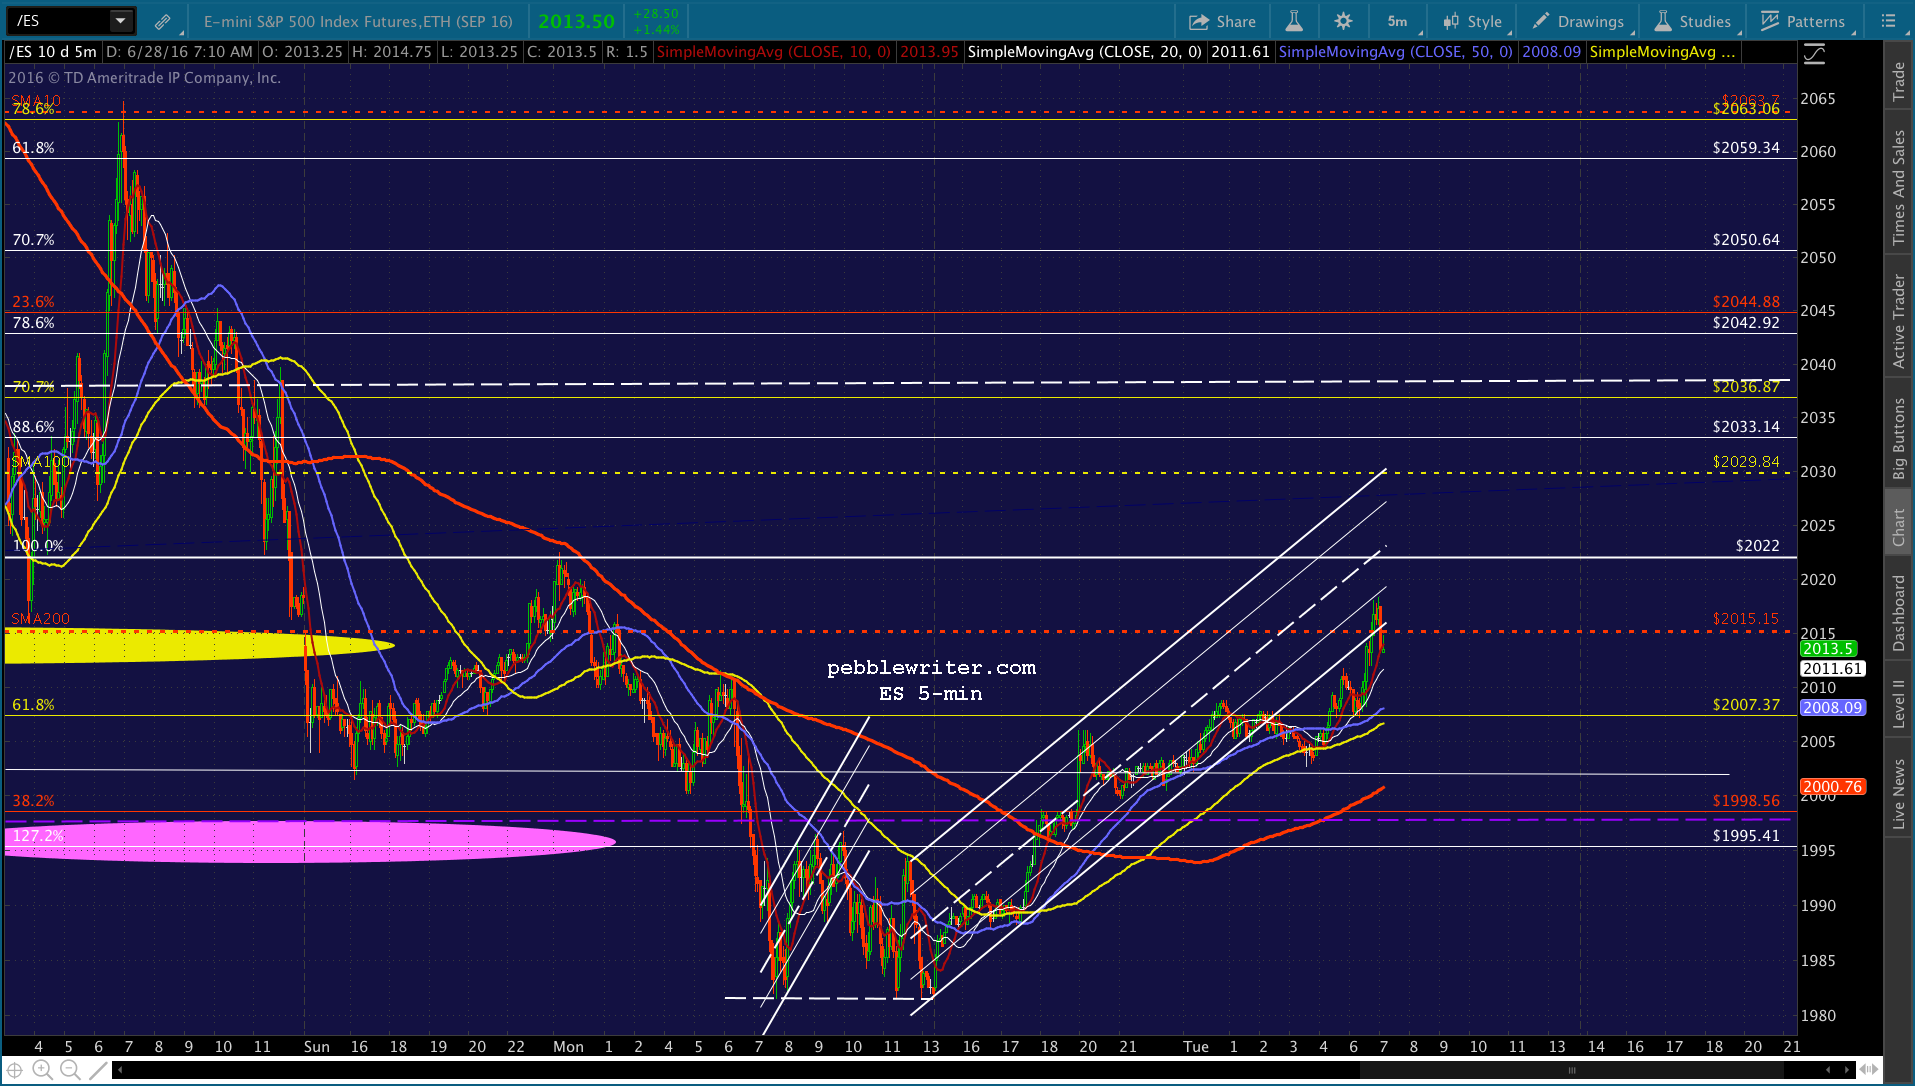
SPX just reached the SMA200. I believe CL and USDJPY will probably kick it up over the threshhold, so would hold long until we see some weakness settle in. Note that ES’ SMA200 is just ahead at 2015.15.UPDATE: 9:49 AM
Seems to be petering out here, as ES’ just tagged its SMA200, which technically is on a backtest. Back to cash. If this is like most other algo-fueled rallies, SPX will sit here until the SMA5 10 arrives, then start inching higher again.UPDATE: 10:06 AM
SPX should dip to tag the SMA5 10 as it pushes through the SMA200. Nimble traders could try picking up a few points, but it hardly ever reaches the target as it’s so widely anticipated.
In fact, it”s so widely anticipated that it’s morphed slightly over the past month or so. We sometimes get a dip, indicating the backtest is imminent, but which doesn’t quite make it to the backtest target before being swept up by the SMA5 10. It is carried to a slightly higher high to shake out those playing the dip.
After they’re stopped out, then it dips to the backtest target to screw over those who played the breakout, arriving there at about the time as the SMA5 20. If that all sounds kinda confusing, just know that it isn’t usually worth playing.
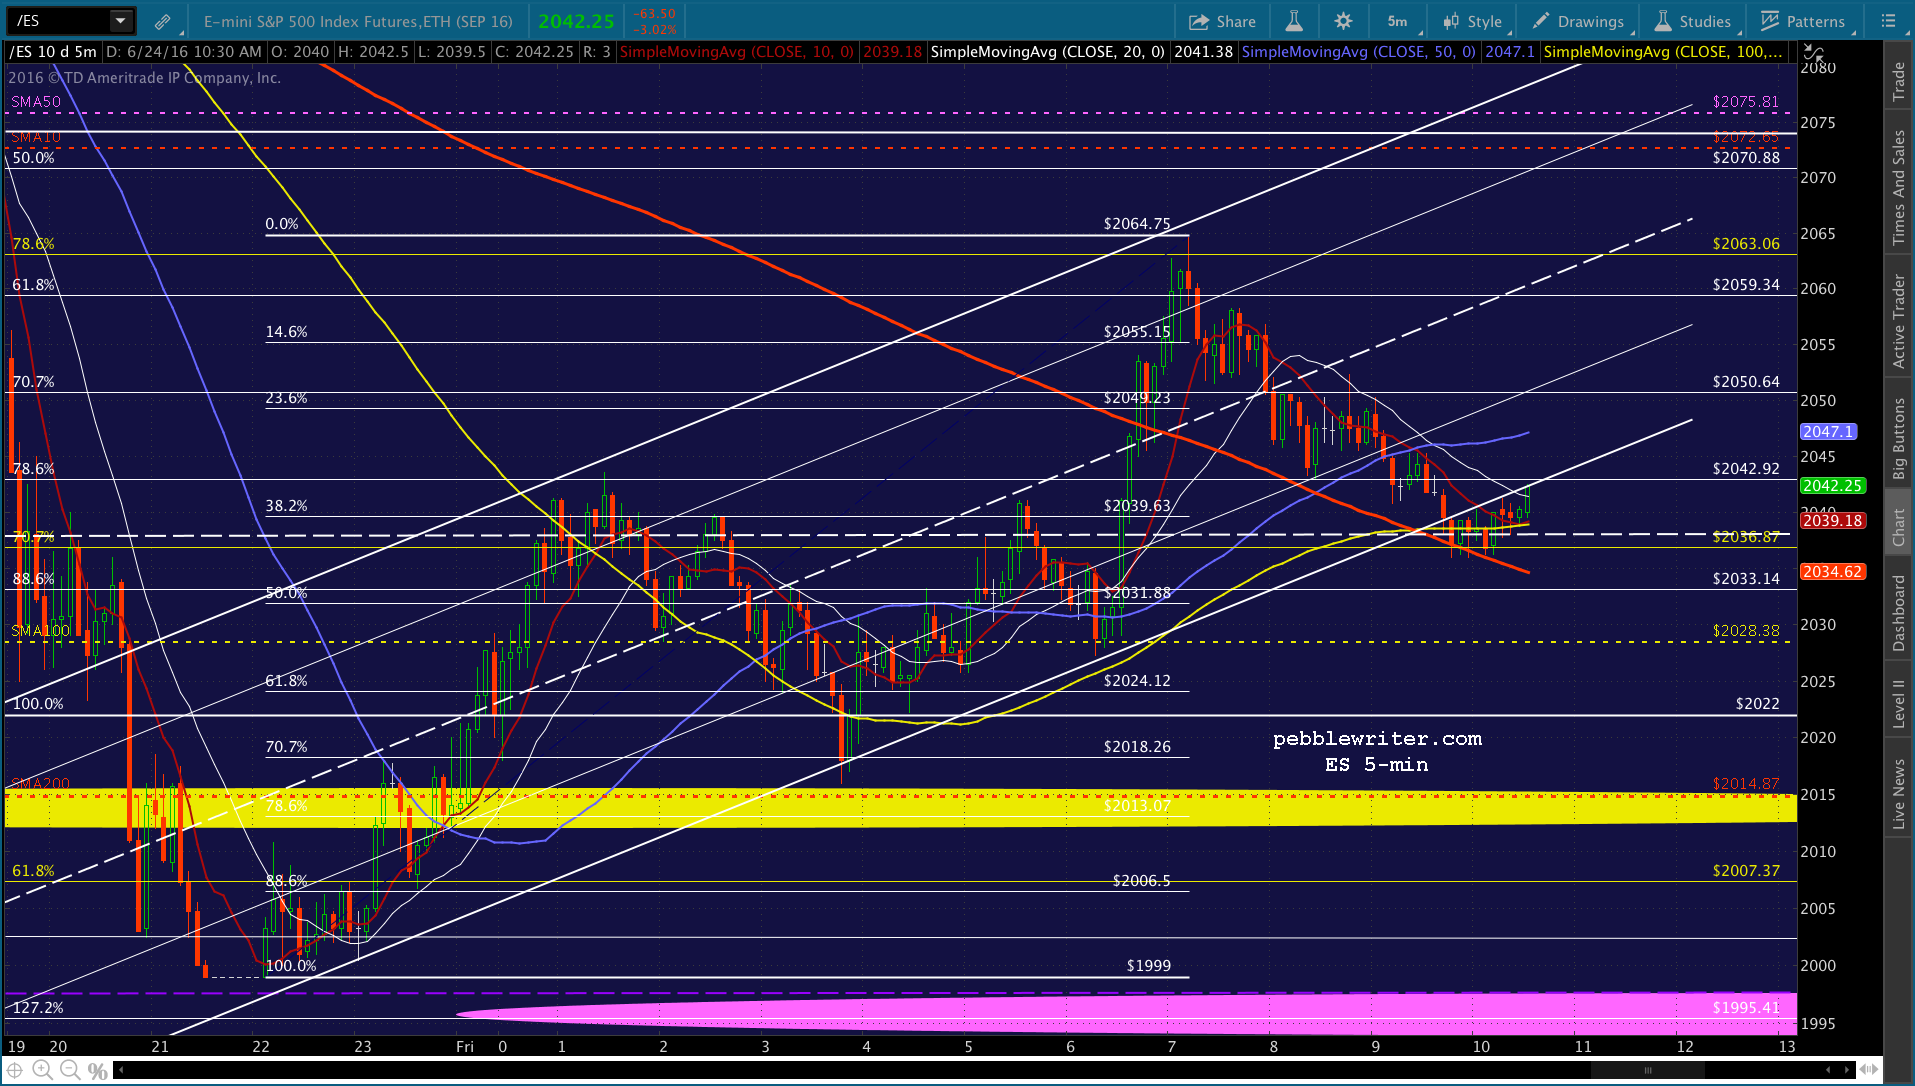
This one’s a little tricky, as it involves letting ES drop back below its SMA200 and then getting it back on top.UPDATE: 10:43 AM
This might be as good as we get. I’d take the profits and revert to cash until we get a sense of whether it’ll rebound or not. If it dips below the SMA5 20, I’d want to stay short. Here’s one potential problem TPTB are facing…
…and, here’s the other one.And, here’s the upshot for ES — a flatter rising channel that shows 10-12 points of downside to the bottom and the SMA5 200 at 2001.UPDATE: 11:00 AM
I could be crazy, but I think we might get some more downside here. SPX is clinging to the SMA200 on USDJPY’s continuing spike, but CL is dropping like a rock. I’d short here on any drop through 2020.29.UPDATE: 11:04 AM
Shorting here for that red channel midline at 1981. Tight stops, of course. I’d put the odds of it working out at 40:60. It would have to get down through the short-term moving averages and the gap close at 2003.85.UPDATE: 12:36 PM
CL has pushed beyond the SMA50, seemingly willing to go wherever it takes to keep SPX propped up above its SMA200. I’d revert to cash here, and only go short if it drops back below 2020.29 — which it probably will do after tagging the SMA5 200 at around 2026-2027. It seems to me that EURGBP is going higher after backtesting this little flag pattern. And, USDJPY is running out of steam.
UPDATE: 3:15 PM
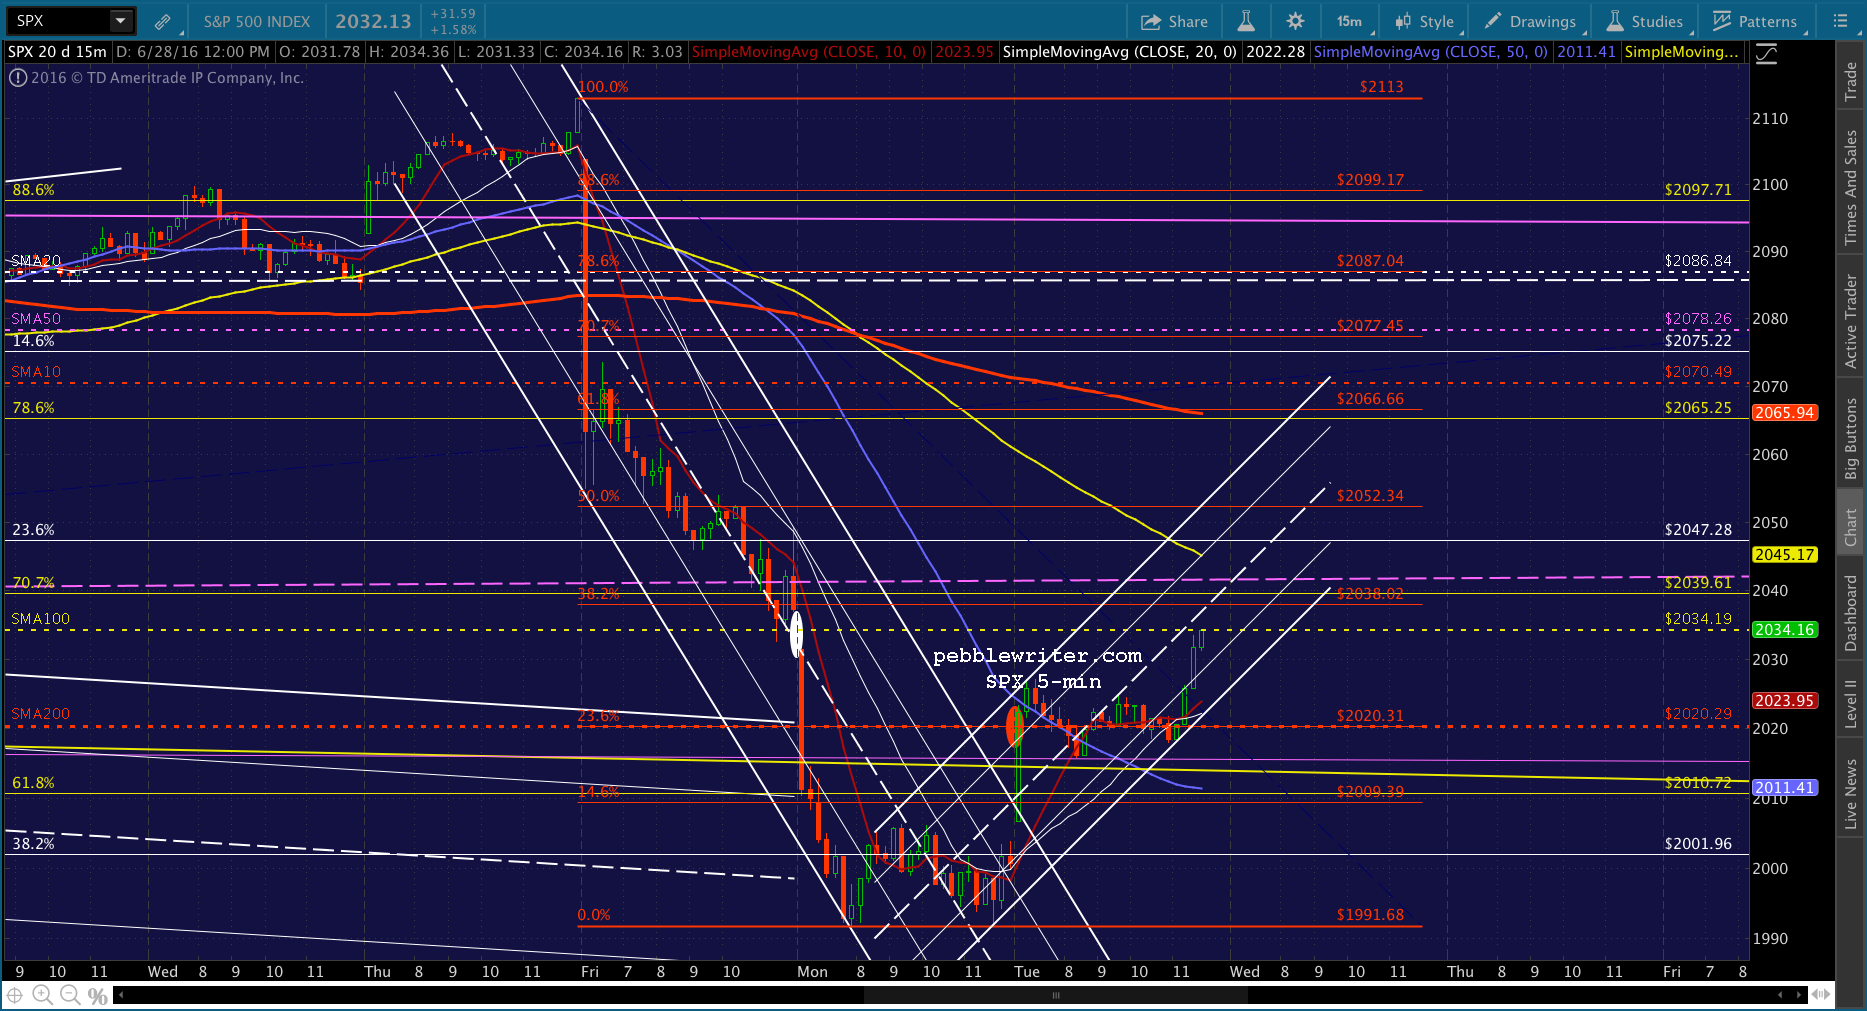
SPX pushed back up through the SMA200 and is closing in on the SMA100. I’d love to short here, as the rebound is really overdone. But, they’ve run USDJPY and CL up to current levels without reservation. I can easily see them resetting overnight and doing the whole thing again tomorrow. Short here only if you can watch or hedge the position carefully overnight.Note that CL has completed a backtest of the rising purple channel midline.If they’re ever going to flesh out this channel, it has to reverse here.UPDATE: 3:41 PM
Apparently, it’s really important to TPTB that they breech the SMA100 as well. SPX just pushed back up through the SMA5 10 and is closing in on the MA on strength from USDJPY and CL and VIX monkey hammering. Back to cash.They’re painting this as an amazingly positive close, but I just can’t bring myself to go long into the close. Maybe if it weren’t such a sham… But, honestly, consider the event risk.
UPDATE: 3:51 PM
I’d take one more stab at shorting here and see if SPX can get some profit taking going in the next 9 minutes. Again, I’d not hold short unless you can handle the risk of another gap higher in the morning or otherwise hedge or watch your position carefully. Likewise, I’d not hold long. There’s a lot of uncertainty out there still, and there’s no way of knowing whether this V-shaped bounce has run its course. I see EURGBP heading up to .84111 very soon, possibly this evening.
* * * * *
A quick heads up: I have an appointment out of the office this afternoon at 1:20pm. It should only take about 1 1/2 hours but I’ll be out of touch during that time. Also, I’ll be switching servers for the site this afternoon, sometime after the close. The site will probably be down for 30-60 minutes at some point.
There’s something deeply satisfying about being short on a day when the buy and hold crowd is freaking out over the massive (their word, not mine) 5% drop in the S&P 500. And, that’s what pebblewriter.com is all about — catching most of the moves most of the time, regardless of which way it’s going.
It might be the end of the world as we know it; but, doesn’t it feel fine to greet each new trading day prepared for whatever the politicians, central bankers, algos or talking heads can throw at us?
Ordinarily I wait until the actual end of the month to start any kind of membership sale. But, we’ve had a pretty good month so far [CLICK HERE]; and, I have the feeling there are a lot of folks out there who are truly confused about what’s going on.
Be confused no more. Sign up for an Annual Membership at over half-off the first year or, even better, a Charter Annual Membership where your rate is guaranteed to never increase for the life of the site.
Today, we should see the rest of the move we anticipated last week — followed by an attempt to reverse course or, at least, stop the bleeding.
Note that EURGBP, having nailed our initial target on Friday, is almost to our secondary target. Our forecast from last Wednesday [see: The Eve of Destruction]:And, the action since:Likewise, SPX nailed our initial downside target on Friday, and should reach the next this morning.
BBC, Sky and ITV have all called it. The Brexit prevailed, and markets are none too happy.
Nikkei futures tumbled over 10%……while S&P 500 futures fell about 5.5%, easily reaching our first downside target and very likely to nail our second.Even oil futures were off an impressive 7.4% before going into damage control mode.EURGBP, the most telling of the currency pairs and the one we’ve focused on the last several days, is approaching our initial upside target and will likely tag the next.
Remember May 19, when SPX bounced sharply, going up to bust out of the falling white channel to new highs? I suspected it would, but was disappointed that it couldn’t manage a little lower in order to tag the yellow .618 at 2010 — also the level of the SMA200 at the time.CL, which had just reached the .618 retracement of its drop from 62.58 in May 2015 to 26.05 in Feb 2016, was almost solely responsible. It shot back up above the .618 (the yellow arrow) and spent the next month ramping SPX higher in a series of bizarre channels that defy all reason.I wondered at the time what the end game was. Now, it’s crystal clear. By breaking SPX out of the falling channel and extending the rising white channel an extra month, they were able to force it 110 points higher. If SPX were to lose 100 points from Brexit, it would be net ahead of where it was.
It’s a much better outcome for central planners than losing 100 points from 2010. If successful, they will have maintained the breakout from the falling yellow channel dating back to 2015’s highs — ideally with another (the 8th? 10th?) backtest of that channel and a bounce off the SMA200.
Sad, of course, that our “markets” are now so heavily manipulated that they require quote marks. But, it’s a smart strategy, and one that might just work.
* * * * *
There are a couple of ways to play this for those who were on the sidelines last night. First, since this is Friday, be extremely cautious of anything that requires you to hold over the weekend.
Second, it goes without saying that TPTB will pull out the usual stops to try and stem the tide. Yes, this means USDJPY and (especially) CL should see some strong rebounds as SPX approaches our downside target.
Recall our downside targets for SPX…it could come in anywhere from 2010 (the yellow .618 and yellow channel top) to 2020 (the SMA200.) So, picking an exact bounce spot will be tricky. By all means, ride the index down to the vicinity of our targets. But, it’ll get very sloppy at that point, with plenty of false starts and head fakes.A safer bet, once we reach the vicinity, is to look for CL to start ramping and jump on board. It tested its SMA50 overnight, and its purple channel midline seems to be holding.UPDATE: 11:48 AM
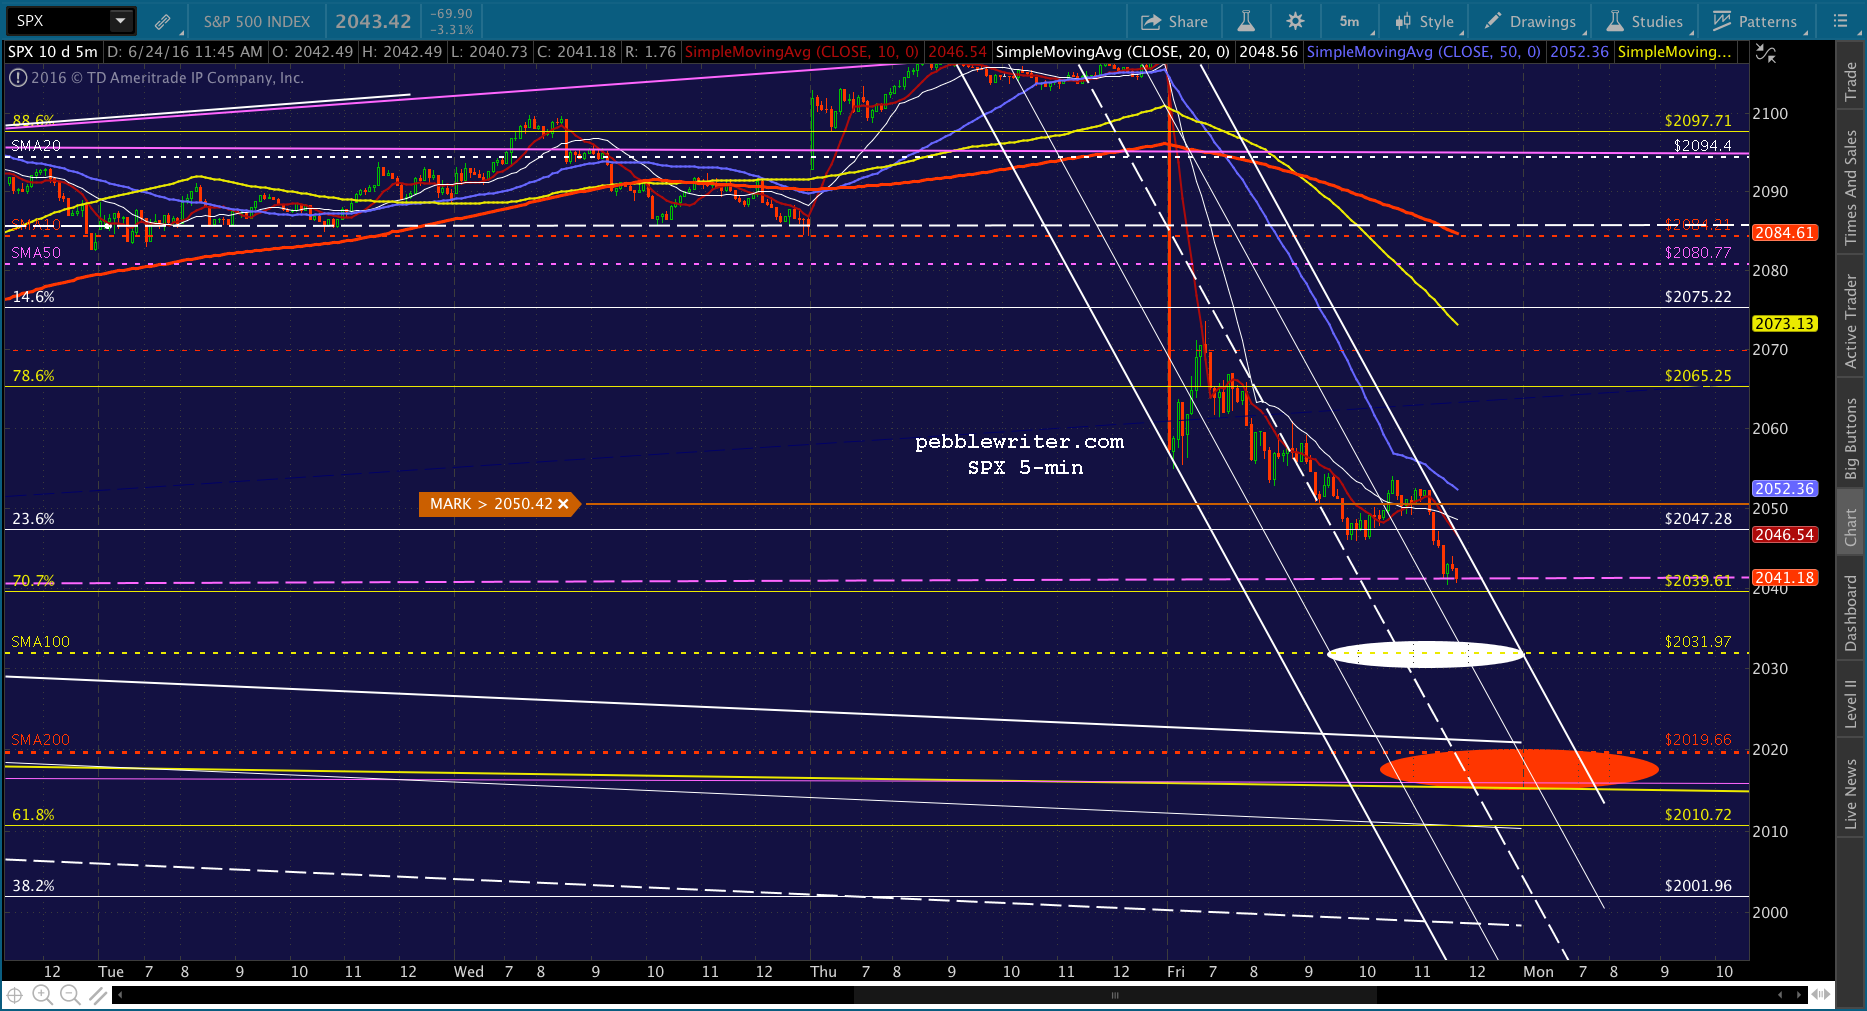
Quick update… Things are looking on track for SMA100 or SMA200 by the close, or first thing Monday morning.UPDATE: 12:42 PM
Coming up on a potential bounce point in ES. Watch your stops if you’re day trading.UPDATE: 12:50 PM
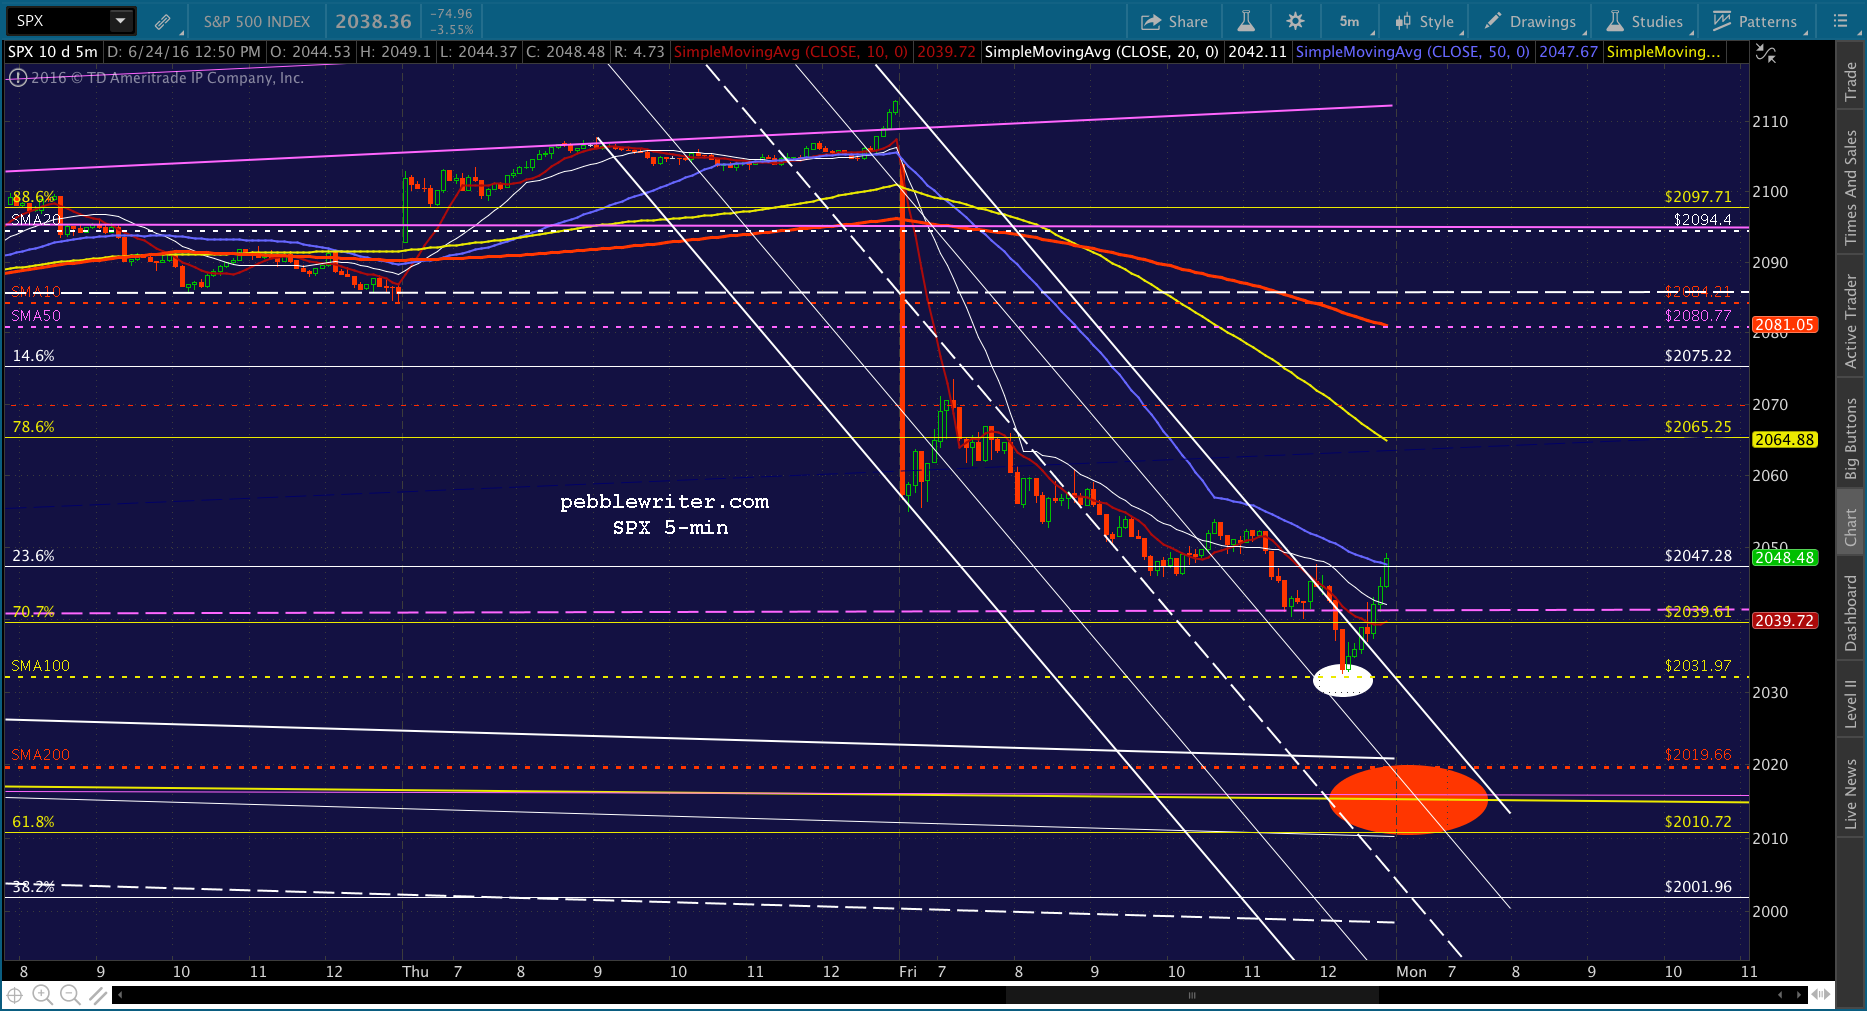
It should bounce here if it’s going to. SPX has no real support here, so it’s all on ES.UPDATE: 1:33 PM
Looks like they’re going for something a little more substantial. I think swing traders will be fine holding short, but short-timers might want to cover on any sustained push above the SMA5 20 at 2050.77.EURGBP certainly hasn’t broken down. Though CL is threatening higher.UPDATE: 1:53 PM
Looks like it’s setting up for a tag of the falling SMA5 50, probably around 2056. But, any sustained move through the SMA5 20 should be shorted. EURGBP could be heading for its SMA5 200 at .8077.
UPDATE: 2:45 PM
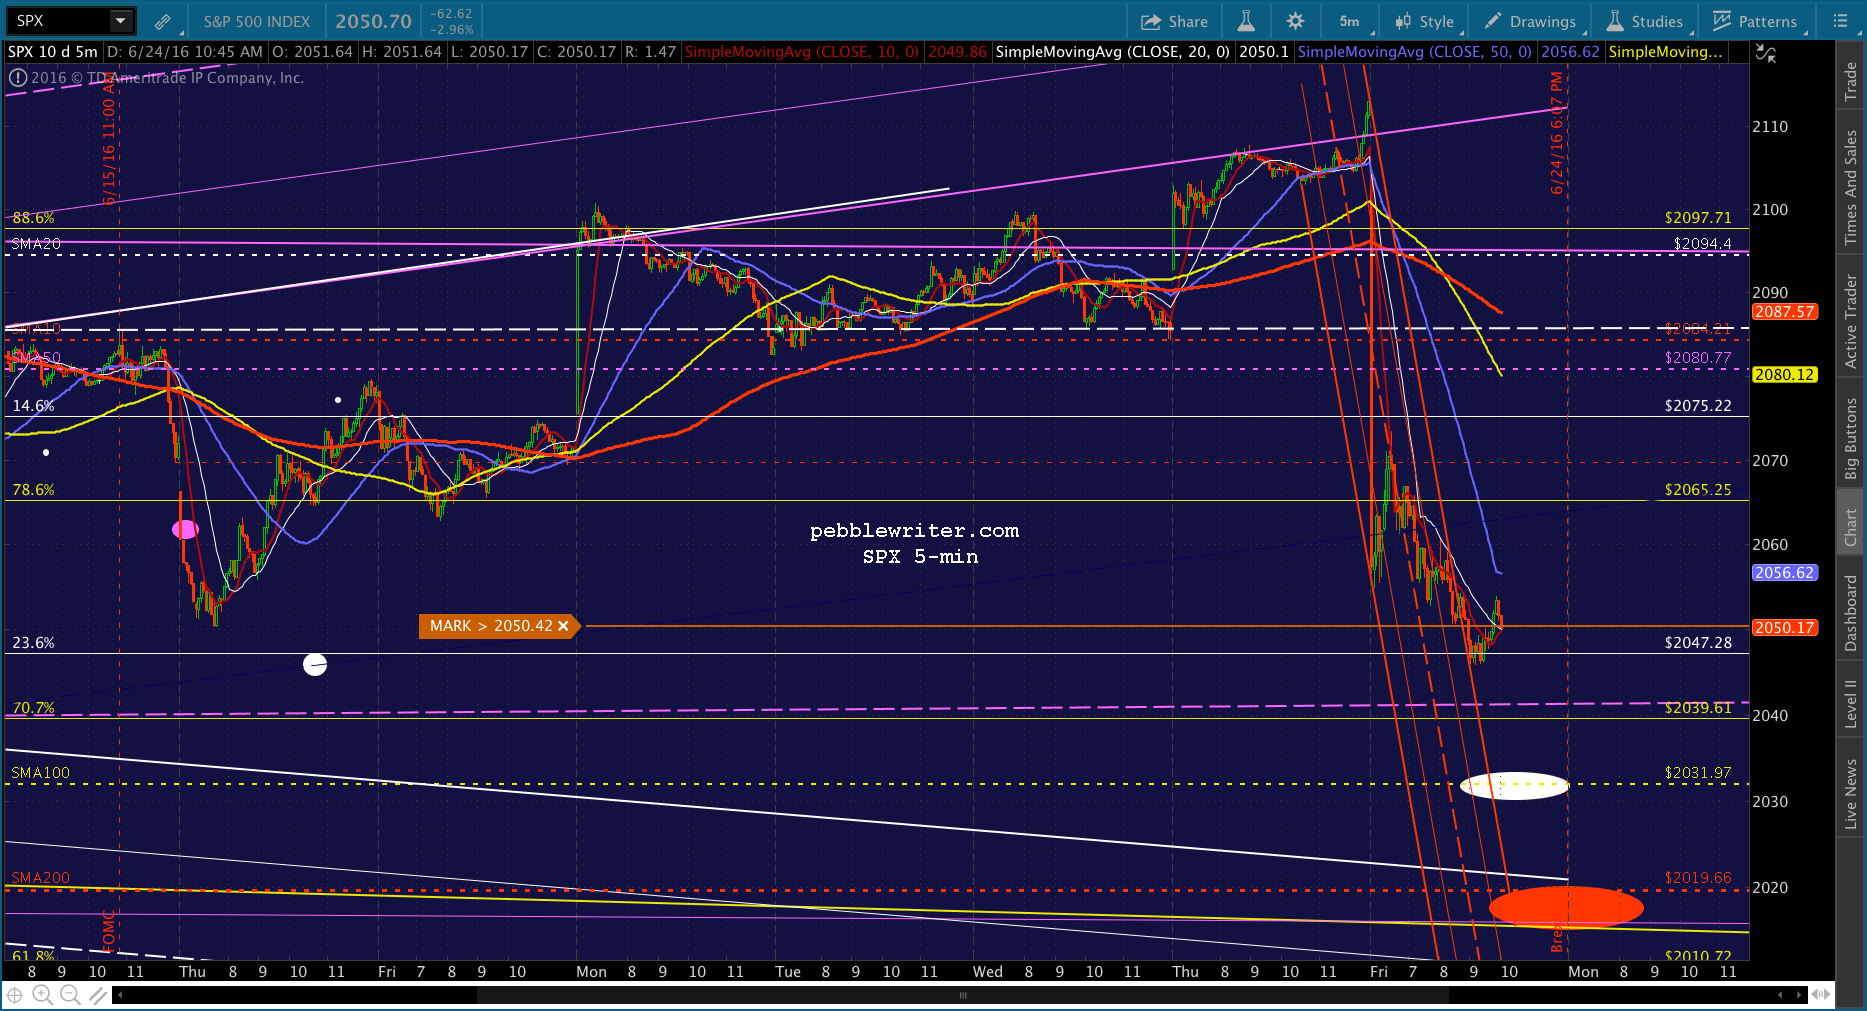
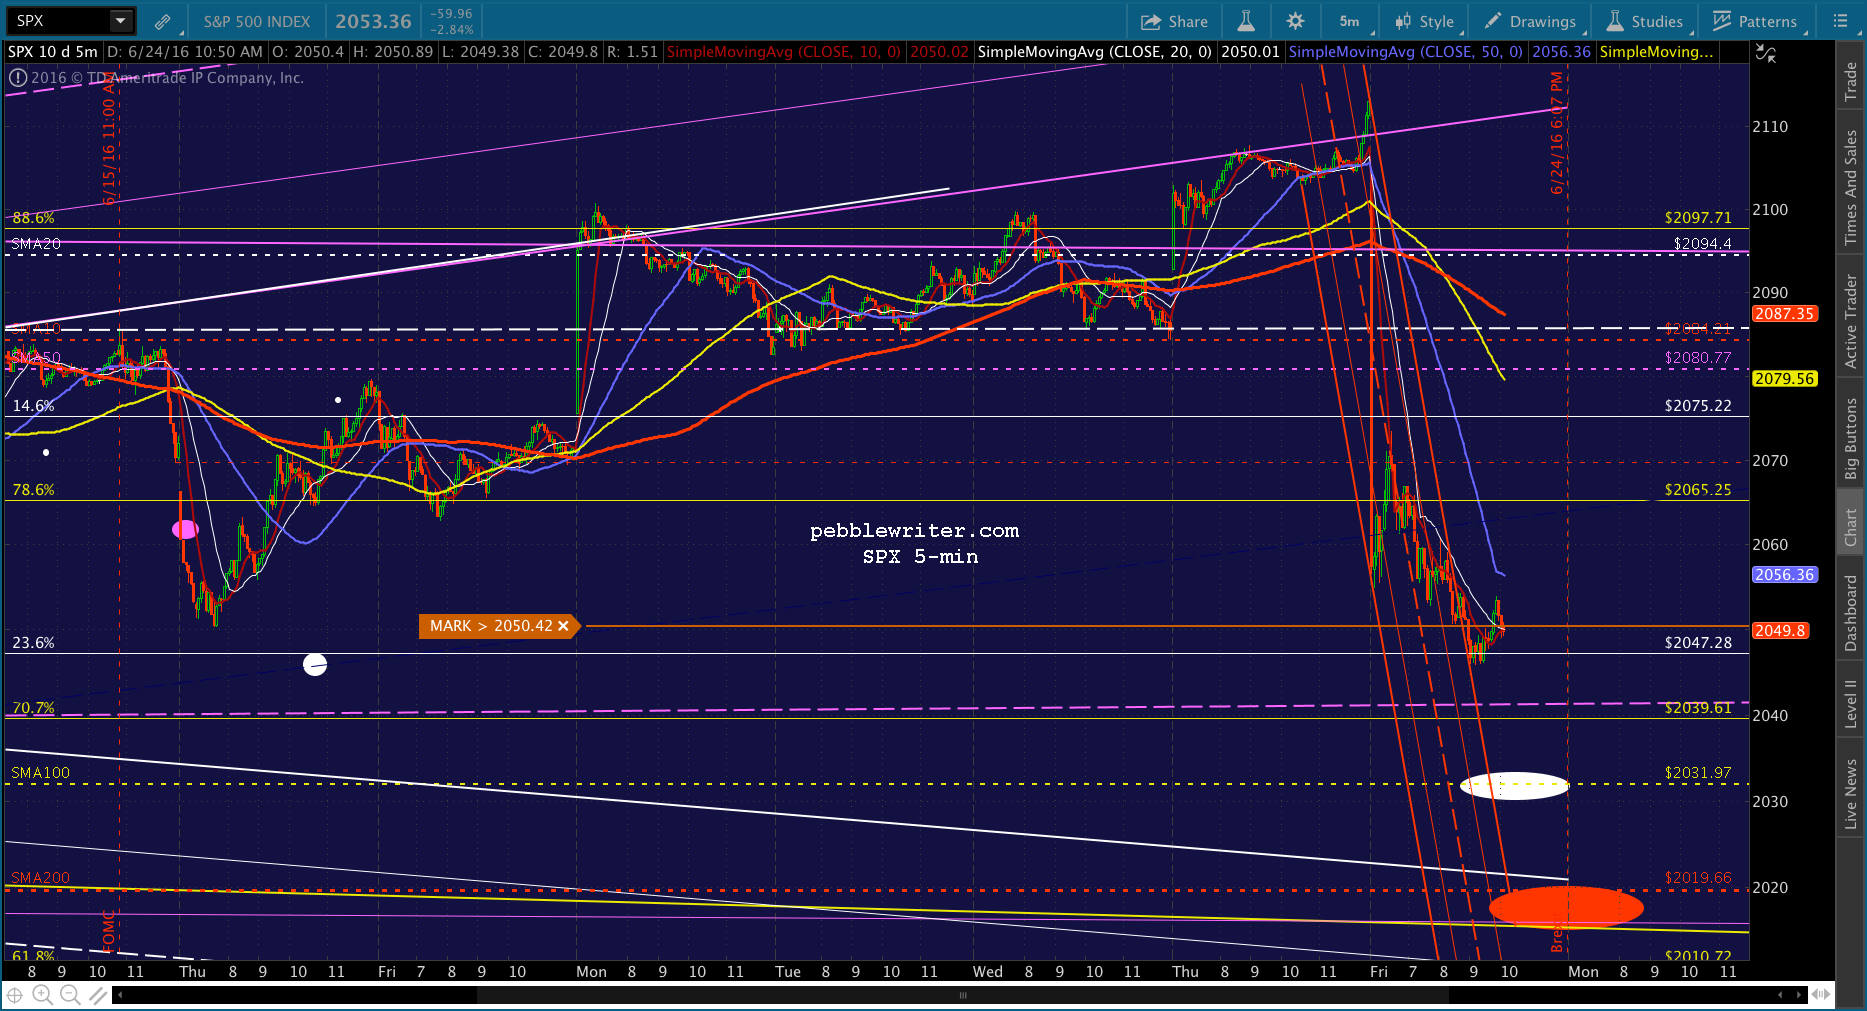
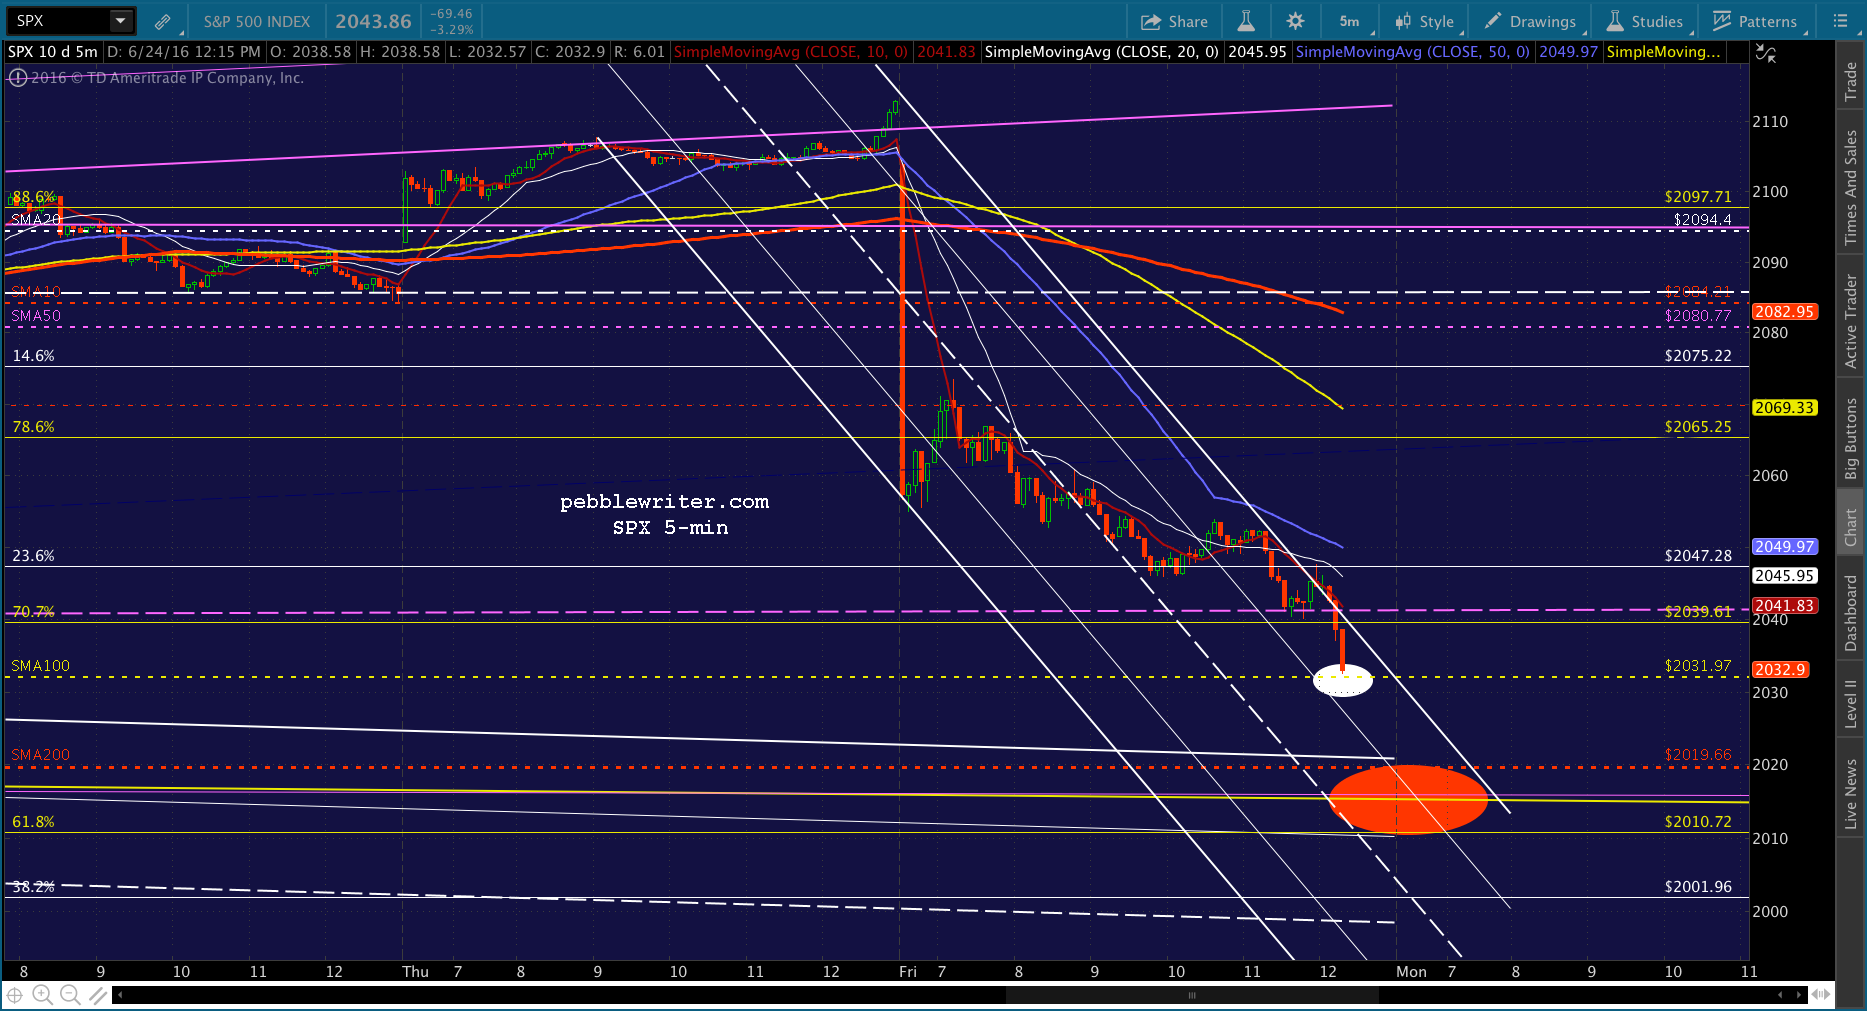
CL’s channel broke down, which allowed SPX to slip below the SMA5 20. But, things start to get interesting in here. There’s a channel midline coming into play just above the SMA100. It’s the dashed, purple line in the charts below. It’s the sort of thing that could cause a delay until Monday. On the other hand, we could still see an intraday push to the SMAs and a rebound to this level by the close.
We’ll see what happens when the SMA5 10 catches down to SPX. Traders will want to consider covering on any sustained move up through it. Swing traders will want to give it more leeway.Also, before I forget, remember that the red target at 2010-2020 is support — not only the SMA200 at 2019.66 and the .618 Fib at 2010.72, but that yellow channel top. TPTB have worked very hard to get SPX back over it. So, a close at the lows would have to at least be considered a reversible move. The usual caveats about holding over a weekend will definitely apply.
UPDATE: 3:20 PM
Tagging the SMA100 here. Could easily get a bounce, though USDJPY and CL aren’t suggesting it just yet. In fact, NKD dropped a bit below its rising white TL. Nervous types might want to take profits here and short again if it drops through. I’m 70:30 sure about lower lows — particularly as we come up on 3:34pm. But, as discussed, that could easily wait unitl Monday.UPDATE: 3:54 PM
SPX just tagged the SMA5 50 that never got tagged earlier. I think I’d take profits from this bounce and return to cash or, if you’re holding short over the weekend, go ahead and short here.
For new folks, I only advise holding short overnight or over a weekend only if you can (1) deal with a potential gap higher, (2) hedge your position, or (3) watch it very closely. Obviously, watching it while it’s closed on Saturday won’t help much, so that leaves the other two. If neither of those works for you, then you should take profits and enjoy a carefree weekend!
I feel pretty good about the downside from here, but you never know when a central banker is going to panic and do something that sends SPX higher by 20-30 points overnight.
UPDATE: EOD
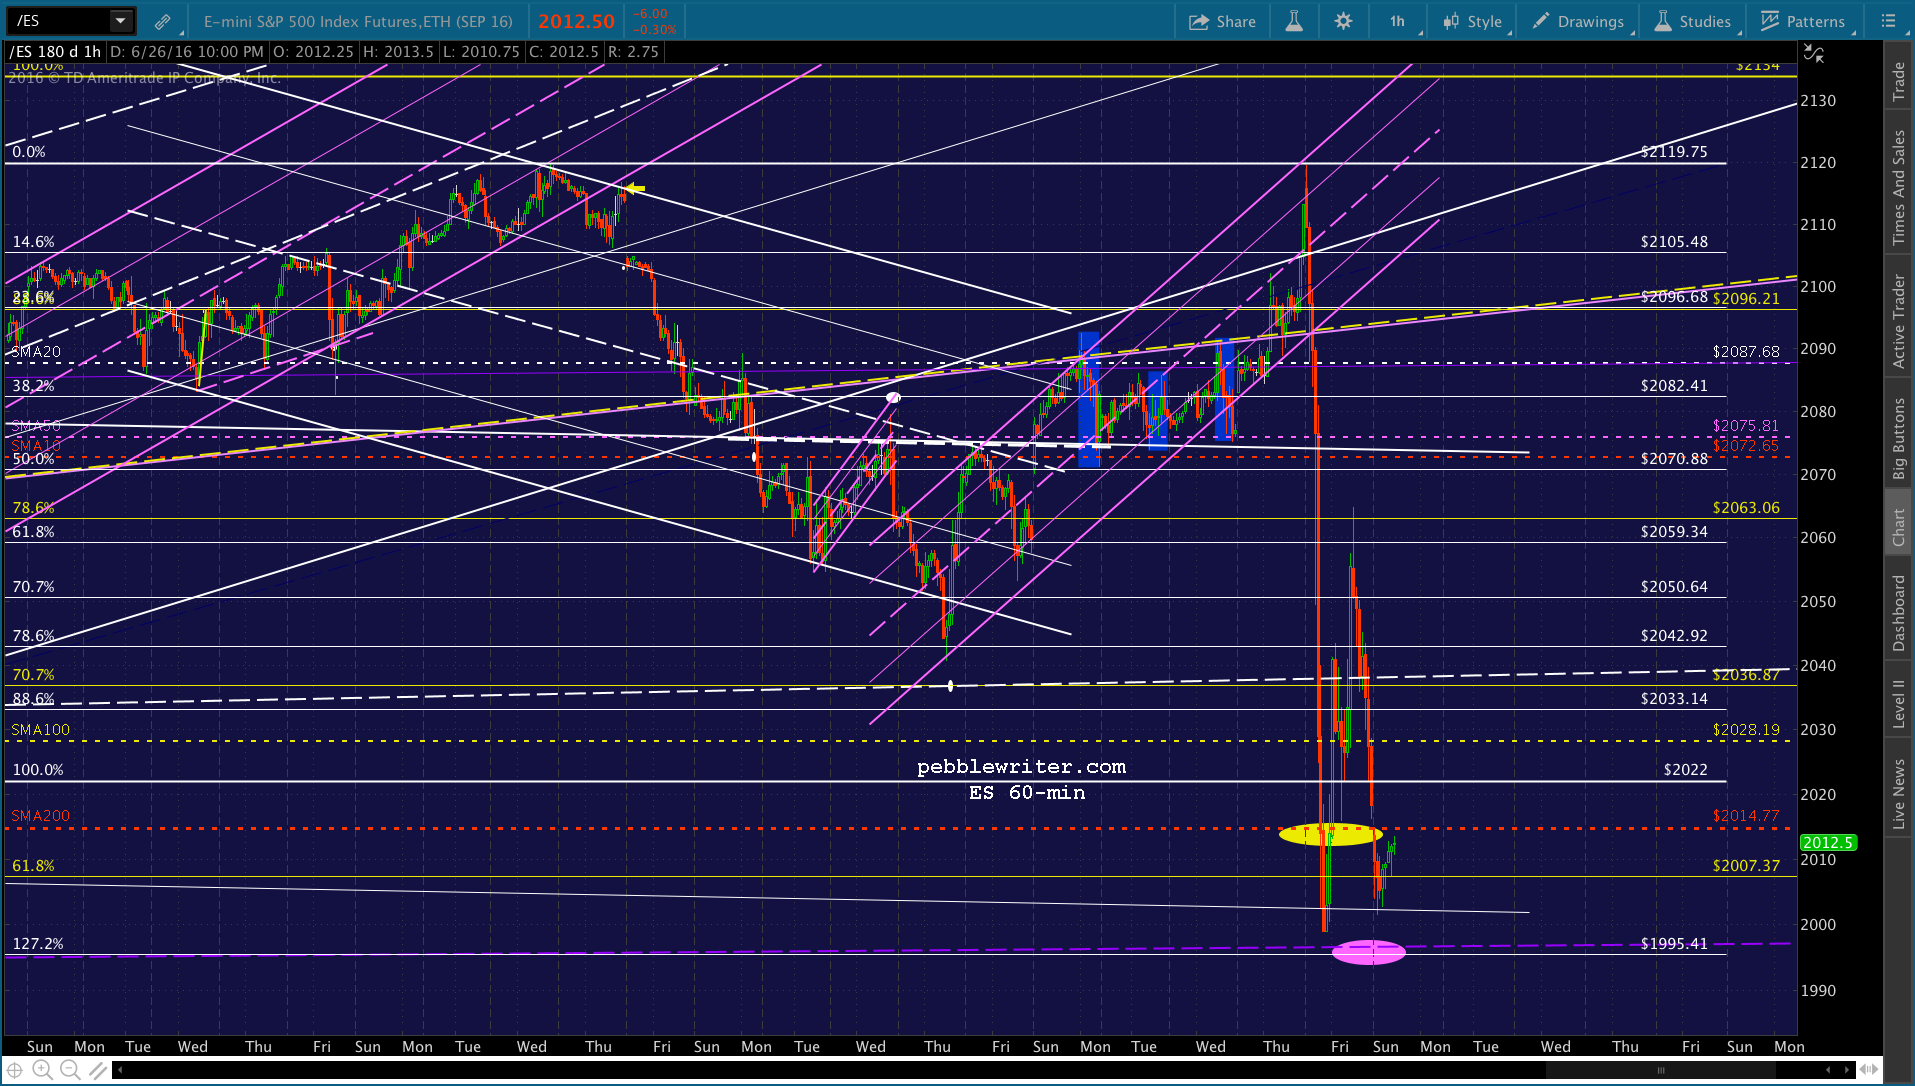
Nice weak close. I have to run a bunch of errands for the next hour or so, but will try to post more after I return.UPDATE: JUN 27 1:40 AM
Updating a few charts, here. Still looking for a tag of the SMA200 at 2020 in the morning. Odds of an overshoot are high, as the yellow channel top passes through about 2015.
I’ll be traveling on the East Coast the first two weeks of July, visiting clients as well as taking a few days to visit family. My current itinerary calls for stops in Philadelphia, New York and Hartford between July 5-8 and in Boston July 14-16.
While I’m traveling, my daily posts will consist of a morning outlook and an evening review. There should be a lot to talk about!
If you’d like to book some time to discuss markets and study charting just drop me an email [CLICK HERE] with your name, location, and 3-4 proposed dates/times.
Include in your email how many people will attend, their level of investment acumen, and any particular topics you’d like to cover. My regular hourly consult rate applies, though group rates are also available.
If your group includes non-members, they’ll have the opportunity to apply their attendance fee towards a membership which is priced at a very attractive rate.
After we’ve settled on a time/place, CLICK HERE to navigate to the Sign Me Up! page, then click on the CONSULT button. At that point, you’ll be confirmed. Appointments are first-come, first-served.
If you’d like to meet up for something more casual, just drop me a line.
Everything hinges on the outcome of the Brexit referendum, today. The results won’t be known for at least another 12 hours, but that hasn’t stopped TPTB from jamming prices higher in the low-volume vacuum of uncertainty.
Their rationale is pretty straightforward. Suppose you show up to work this morning, intent on reducing your exposure in light of the uncertainty reflected in the polls. But, the futures are up 25 points. Someone must know something!
Do you sell into that? You’d look pretty stupid if greeted with a 3-4% spike tomorrow morning.
For those who are tempted, the overnight ramp job is a pacifier — a way to calm your nerves while hanging in there, long and strong, like Soros and Buffet and all the other billionaires who surely have better information.
And, while we’re talking about it, suppose they do have better information? Suppose they’ have a man on the inside? Suppose the vote is rigged? Given the huge money at stake, it’s not so outlandish a thought.
Trade today if you must, but you might as well find the nearest roulette wheel and give it a spin. Maybe today’s ramp job is a huge head fake, and you’ll be sorry tomorrow if you go long. Or, maybe it’s the start of a 100-200 point relief rally to new all-time highs.
We’ll find out soon enough. In the meantime, to the charts.
Last night, we had stunning ramp jobs in USDJPY……CL……and, NKD. But, unless they know something that no one else does, the chart that really matters is the EURGBP. And, as of right now, it’s saying “who knows?” continued for members… (more…)
Listening to various government officials and billionaires talk about the Brexit, I’m reminded of the outstanding Barry McGuire Vietnam War classic Eve of Destruction (how many other songs can work the word “coagulating” into the lyrics?)
Would a Brexit really bring the house of cards tumbling down? And, why are TPTB so apoplectic about it? And, finally, what can we expect from key currency pairs and equity indices?
Instead of focusing on the intraday squiggles in the markets, today I’d like to take a step back and evaluate the big picture in light of what the Brexit might really mean.
First, let me assure you that I have no horse in this race. Though, given the steady stream of lies and misinformation from government sources over the years, I’m naturally hesitant to believe most of what they say.
The City of London is one of two critical financial centers of the world (the other obviously being NY) and would not disappear if the UK were to leave the EU. It would continue as before, though with less interference from Brussels.
Likewise, I believe trade would be largely unaffected. There would be winners and losers, but trade is usually a mutually beneficial exercise — or, it doesn’t happen at all. Were one party to try to press unfair advantage, the other would have plenty of ammunition with which to level things out.
Why TPTB Are Freaking Out
The biggest potential risk, I believe, is in the derivatives markets. In the wake of the Great Financial Crisis, central bankers have spun an elaborate web of interlocking relationships between currencies, interest rates, debt and risk.
Rather than reduce the $1.5 quadrillion (imagine a stack of $100 bills over 1 million miles high) in derivatives exposure that nearly destroyed the financial world, they have tried to massage it into meaninglessness by permitting participants to engage in fairy tale accounting.
Demonocracy.com has some great visuals on the amount of money involved. This one shows $1 trillion, so you’d have to multiply the number of $1 trillion towers by 1,500, but you probably get the idea.
If I write a contract limiting your interest rate and currency exposure on a $500 million euro debt facility, I’m on the hook should things move against me. If I sell pieces of the this contract to 50 different banks and insurance companies, they’re technically on the hook, too.
Yet, I’m allowed to say that I have no exposure simply by pointing out that I have other positions that offset my risk. This is called netting. And, it completely ignores the risk that my other positions might not fully offset the risk, as well as the risk that any number of the participants in the daisy chain of obligations might go belly up as did Lehman, Bear Stears and AIG a few years back.
Many other banks and investment banks would have followed them into oblivion had not TPTB decided to let them utilize fairy tale accounting. The government officials, bankers and billionaires arguing that the Brexit could be disastrous for global finance know all about the risk. In fact, they’re deeply familiar with them.
This past November, I updated the biggest banks’ Wipeout Ratios. As the table below shows, a mere 0.25% decline in the value of their derivative portfolios would wipe out the Tier 1 Capital of JPM, C, GS and BAC. Is it possible that a 0.25% decline might occur in the wake of a Brexit?
The Bureau of International Settlements sure seems to think so — unless you believe the timing of the all hands on deck meeting scheduled for Jul 23-28 in Basel is a coincidence.
Let’s take a look at some of the key currencies and indices that might be affected by a potential Brexit, and why TPTB cannot afford for the referendum results to stand.
The first currency that comes to mind, of course, is the British pound. In euro terms, the EURGBP, it has followed some fairly well-formed patterns.
Note that the EURGBP represents the amount of pounds sterling it takes to buy one euro. So, as the value increases, it represents an increase in the amount of pounds it takes, a relative weakness in GBP. As the value decreases, it represents a relative strength in GBP.
In general, EURGBP has maintained an inverse relationship to the S&P 500 — meaning that EURGBP strength (GBP weakness) has been negative for stocks, and vice versa. To put it another way, a strong GBP is good for stocks, and a weak GBP (rising EURGBP) is bad for stocks.The rising white channel, in general, represents a gradual decrease in the value of the GBP relative to the euro, while the falling purple channel represents a gradual increase in its value.
The chart above shows six distinct periods of valuation shifts.
(1) From the advent of the euro until May 2000, the GBP strengthened relative to the EUR. Note that SPX topped out two months prior in Mar 2000.
(2) For the most part, the EURGBP recovered while stocks plummeted.
(3) While SPX climbed from its 2002 lows to its 2007 highs, EURGBP went mostly sideways.
(4) As stocks plunged again, EURGBP spiked higher, topping out 3 months before SPX bottomed in Mar 2009.
(5) As SPX recovered from its 2009 lows, EURGBP began a slow, steady decline to the bottom of the white channel.
(6) EURGBP began a sharp rise again in Jul 2015, rebounding about 1/3 of the way back to the top of the channel. EURGBP bottomed out on Jul 17, 2015, when SPX closed at 2126 — just 8 points shy of its new all-time high set on May 20, 2015. Over the next five weeks, while EURGBP bounced off the channel bottom, SPX shed 12.2%.
What Does it All Mean?
By now, two conclusions should be patently obvious. First, a sudden devaluation in the GBP could do a great deal of damage to stocks. We can argue sovereignty and national pride all day long, but this is the relationship that has TPTB’s knickers in a bunch. It’s also why you’ll find few cabbies or maids warning about the dangers of a Brexit.
The other conclusion one should draw is that the latest bounce off the white channel bottom hasn’t produced much of a decline in stocks. The first two in 2000 and 2007 produced crashes of 51% and 58% respectively.By contrast, SPX is currently trading 2% below its all-time highs. We’ve had plenty of days with 2% rallies this year, so SPX is conceivably only one good headline away from new all-time highs. What gives?
First, it wasn’t as though the past year has been happy and carefree. Each time EURGBP bounced off the channel bottom, SPX tumbled about 12-14%. If there hadn’t been huge bounces after each, SPX would be about halfway to a 50%+ decline instead.
The huge bounces, you ask? Each were produced by algo-fueled recoveries in USDJPY and CL — the prices of which were propped up by our old friends: the central bankers. The first involved a 6.2% bounce in USDJPY and 35% bounce in CL. The second was almost entirely the result of a near doubling (98%) in the price of CL since Feb 11.
I’ve written about the manipulation of stocks using CL and USDJPY countless times, so there’s no point in rehashing it here. Suffice it to say that CL is likely nearing its upper bound. It’s producing actual inflation, an inconvenient truth for central bankers trying to sell us on the need to continue ZIRP and NIRP.
USDJPY, on the other hand, has fallen so far since Jun 2015 that it could drive stocks to new highs simply by recovering some of those losses. To be sure, a little extra pain at the pump (for the have-nots) is NOT going to stand between TPTB and their inflated balance sheets. If EURGBP starts screaming higher and stocks start plunging, don’t be surprised to see CL pushing higher. I have a 54.76 upside target that could easily come into play if the Brexit happens.
Likewise, the BoJ has a long and distinguished history of throwing its citizens under the bus when necessary to prop up stocks [see: The Yen Carry Trade Explained.] Their need is a little more pressing, in fact, since they have borrowed trillions of yen in order to “invest” in global equities. The USDJPY recently bounced at an important Fib level, and there’s very little in the way of overhead resistance.
Given all the above, what can we expect if the “Leave” camp prevails? Destruction, or something a little less dramatic?
continued for members…
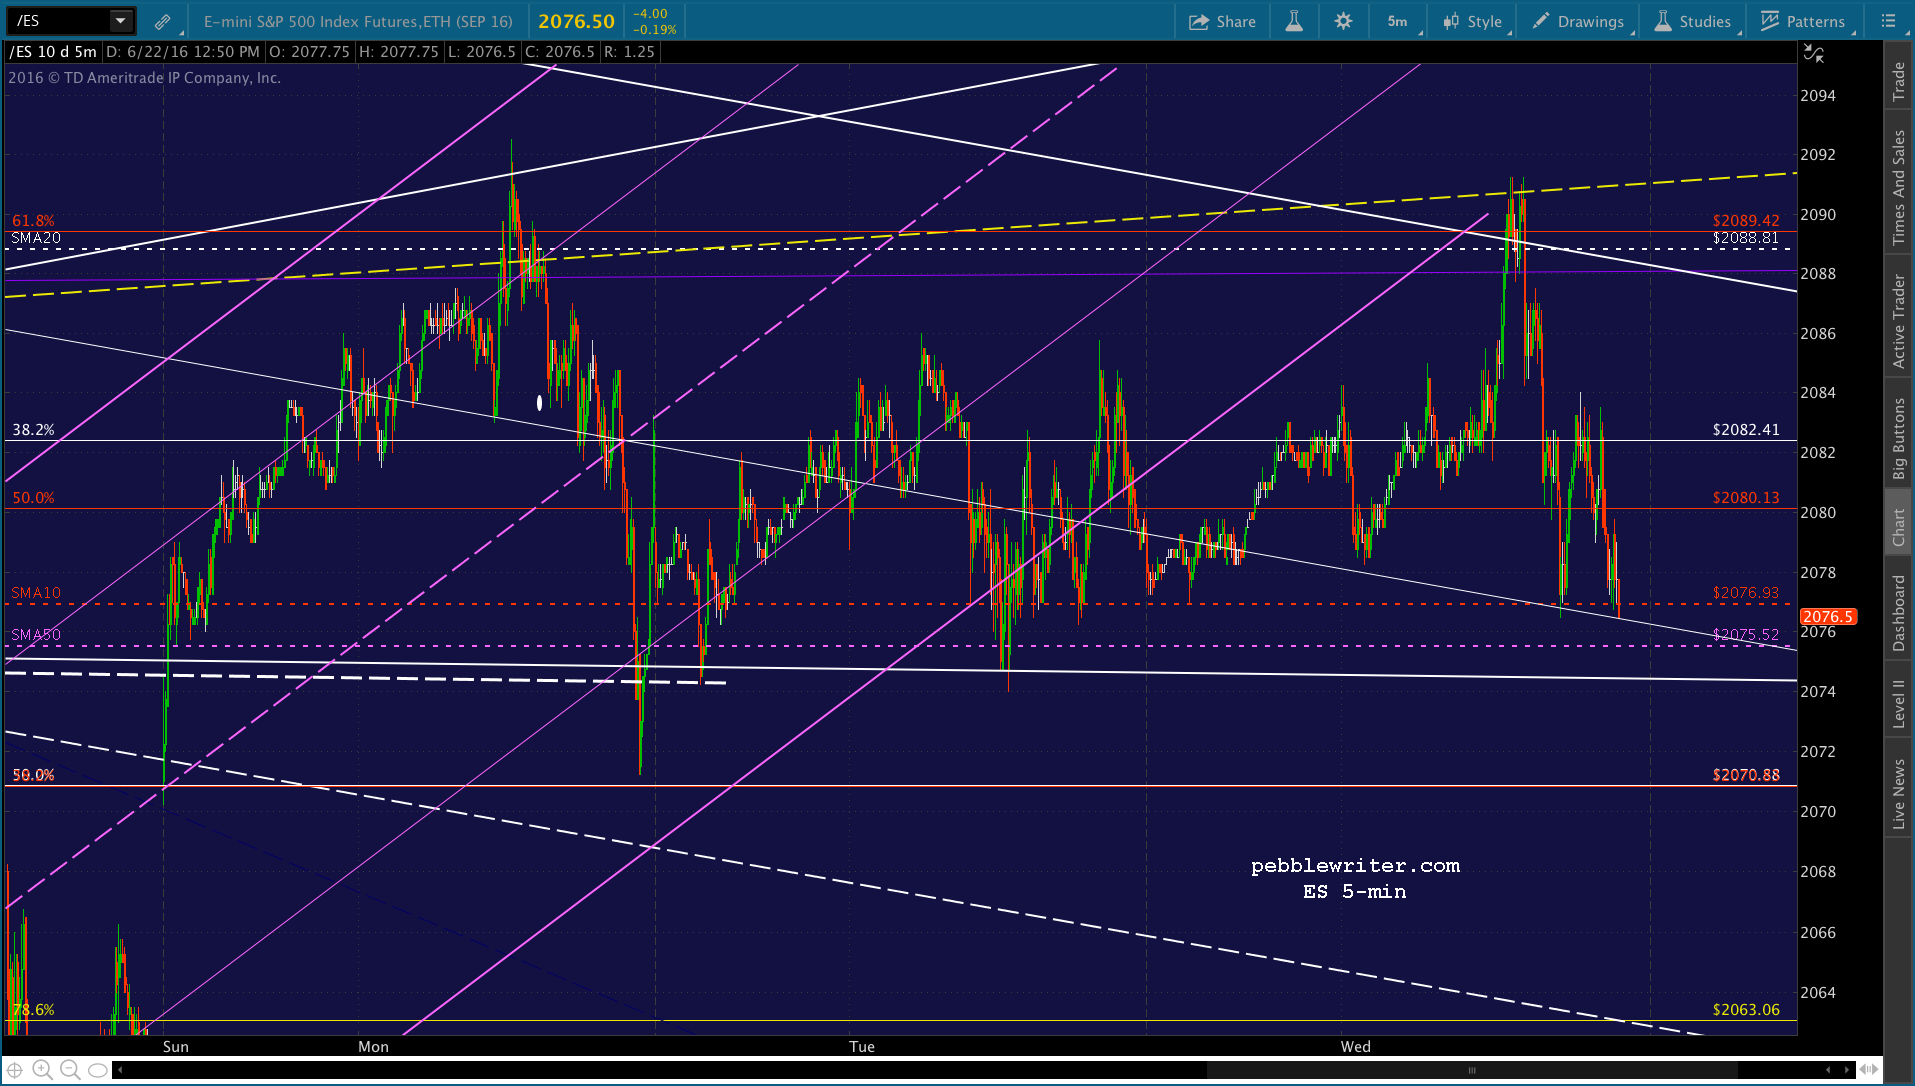
First, given how binary the situation is, charting is of little help in predicting which direction EURGBP will break. I believe there is plenty of selling pressure in the markets right now, so would want to be short over the next 36 hours if ES dips below its SMA50 at 2075.52. It’s clearly been propped up there for the past several days.
Charting can, however, give us an idea of where EURGBP might go in the even it breaks out or breaks down. And, this might help us with an equity forecast.
First, let’s look at the key channels. EURGBP bounced off the bottom of the large, rising white channel in Jul and again in Nov 2015. In Feb 2016, it pushed above the white channel’s .236 line and made it halfway to the rising white midline before being slammed back below the .236 line in May.
It stayed below just long enough to flesh out the rising red channel (May 31), at which point it bounced up to the rising red channel midline and returned to the red channel bottom. The closeup below shows that is backtesting the small, falling white channel — ordinarily a sign we get right before a breakout.
However, the fact that the pair returned to the red channel bottom rather than working its way higher within the red channel and to the top of the falling purple channel supports the idea that TPTB are trying to force it lower. Remember, a drop in EURGBP means stocks rally.
If the red channel does break down, the first stop is likely to be the purple channel midline at .7549 (also the white .500 Fib level, the red dot.) If that doesn’t hold, then I’d look to the bottom of the small, falling white channel where it intersects the white .618 Fib level at .7415 (the white dot.)
It would be a little sloppy, as the pair already broke out of the falling white channel. To reenter it is a technical faux pas. But, these sorts of things are more and more common, now that TPTB are manipulating markets more often.
If EURGBP drops through the .618 at .7415, the next levels of support are the .786 at .7224 and the .886 at .7111.
The upside case (stocks fall) is more compelling. The nearest upside target is the purple .707 at .8262 where it intersects with the top of the falling purple channel (the purple dot.) If the pair breaks out of the purple channel, however, the intersection of the red channel top with the .786 (at .8411, the yellow dot) makes an appealing target.
If it keeps going, then the red dot up at .8599 is a very strong candidate. It marks the rising white channel midline, the purple .886, and the top of the rising red channel.
Implications for Stocks
As discussed above, if EURGBP’s rising red channel breaks down, it’ll send stocks higher. TPTB have been working diligently to get SPX back above 2134 – a mere 34 points (1.6%) above today’s high. There have been several opportunities, but I believe they were waiting for an event big enough to: (1) justify the move, and (2) send SPX much higher than 2134.
When EURGBP broke down through the red channel midline between May 16-25, a 5.2% drop, it was good for a 70-pt (4%) increase in SPX. The 6.8% drop between Oct 13 – Nov 18 corresponded with a 13% SPX gain.
So, it stands to reason that a 3.7% drop to .7415 could trigger a rally in SPX of at least several percent — particularly since it represents a break of a year-long trend. An 8.2% drop back to the white channel bottom would likely produce gains on the order of 15% or greater. Think 2250+.
If it slides back down after the initial push, no problem. The key is to break through 2138 (the actual 1.618 extension of the drop from 1576 to 666 between 2007-2009.) Once that bogey is out of the way, every single bearish harmonic pattern in existence goes away.
If, on the other hand, EURGBP rebounds as the result of a successful Brexit campaign, we can expect a rather impressive sell off. Unlike last Fall’s sell offs, this one would presumably involve a fair amount of unraveling as the result of a fundamental change (as opposed to a temporary fluctuation) in the relationship between the two currencies.
Another 12-14% decline from today’s close would put SPX at 1793 – 1834 — near or even below Feb 2016’s lows. A summer of 2011-style sell-off would put SPX around 1650. A 2000-2002 or 2007-2009 sell off would, of course, be much more devastating.
Our big red target near the intersection of the .618 Fib line and the falling yellow channel would put SPX at 2010-2020, a modest 3.6% decline. An overshoot to test 2000 is also a good possibility. While we’re talking about SMA200s, remember that tags of this important moving average have been few and far between, this year. To be clear, SPX could stop tumbling there if it had adequate support from USDJPY and/or CL.
I’ll play around with these figures more tomorrow, when I’m a little fresher. With fresh charts, it should be easier to illustrate various levels of support. In the meantime, it’s safe to say a big move is coming. Whether we’re on the eve of prosperity or of destruction will be revealed soon.
With Fed testimony, the Brexit, key economic data and the fate of the Bachelorette hanging in the balance, this is shaping up as an extremely volatile week.
After a massive 8.1% ramp in oil futures over the last two sessions, CL is finally taking a break. It’s a horribly perverted-looking chart, but we expect no less from CL. It has become the primary driver of algorithms which determine where the “market” goes each day. And, when it slumps, USDJPY springs to life, as it did last night — adding 1.12% from the overnight lows. Note that USDJPY reached our 103.69 target — but, 3 days late. The delay helped stocks rally quite a bit in the interim.


 …and, the same chart this morning.
  We’ve talked many times about how USDJPY has been reduced to a tool for manipulating stocks (just yesterday, in fact.) Consider NKD, which has been building a sharply rising channel all week since Brexit. USDJPY needed to reset last night, ideally to flesh out the less steep white channel I expected to take form.
 There are a number of charts which indicate SPX should take a breather, now that the month/quarter are over. But, will it? It’s been a hell of a ride since popping back up above the DO NOT CROSS channel top on Tuesday, its first of three gaps higher this week.
 I’ll be watching to see when USDJPY drops the rest of the way to 102.3 — a pretty sure thing.