Posts

  • Update on Oil: Sep 7, 2017

    I started writing this post two weeks ago, after oil nailed our latest downside target (from Jul 31: 46.46) and was rallying nicely.   Of course, a lot has happened since then.

    I had been taken aback by the news that Andy Hall, such a prolific oil trader that he earned the moniker “God,” was shuttering his main hedge fund after sustaining a 30% loss trading oil so far this year.

    I know nothing about Andy’s investment strategy or trading style [though he had a “colorful” reputation]  But, this was a stark reminder of how fundamental analysis has utterly failed oil traders. We have only to look at the recent post-Harvey fluctuations to see the disconnect.

    In the past three years, our periodic, directional calls on WTI have averaged over 500% annually.  Our success has rested almost entirely on ignoring fundamentals and focusing on the things which have mattered: inflation, interest rates and stock prices.

    continued for members(more…)

  • Charts I’m Watching: Sep 7, 2017

    I’m focusing on oil this morning, so the regular array of charts will be somewhat delayed.  Not to worry, as our targets remain unchanged from yesterday.

    The only updates relate to the EURUSD, which found no reason to reverse following Draghi’s comments.  The USD continues to drop toward our downside target.

    continued for members(more…)

  • Was That It?

    Aside from the troubling headlines, yesterday’s price action was driven by continuing weakness in the USD (especially USDJPY) and oil’s inability to push through important overhead resistance.

    This morning, oil is pushing above that resistance.  We won’t see EIA inventory data until tomorrow, due to the holiday.  So, it remains to be seen whether traders will jump on board this move, or it’ll reverse intraday.

    If it does, we still have no shortage of lower price targets.  ES had no trouble reaching yesterday’s initial downside target, with a drop through 2450 before VIX was wrestled back under control.

    After the overnight ramp, it’s again threatening a breakout.  We saw how that went yesterday.  Is this yet another 1% V-shaped recovery, or a potential head fake?

    continued for members...

    Just a quick housekeeping note…I will post until 10:30 this morning, then have to hit the road for some meetings.  With any luck, I hope to get an updated oil forecast posted as well.  But, there’s a pretty good thunderstorm brewing here in Boston, and I’m wondering how long the power will remain on…

    First, a quick look at WTI shows it’s running into resistance at the red TL and SMA200.  Time for a reversal.

    The big picture for SPX and ES, just in case things get out of hand.

    The initial bump should get SPX up to a backtest of the red channel, with the SMA5 200 just above at 2468.95.  My gut tells me we’ll get another leg down.  But, we’ll have to see what happens with CL, VIX and USDJPY.  USDJPY continues to limp along, with yesterday’s dovish Fed comments not helping much.   It’s the .618 Fib that intersects with the white channel bottom that has me thinking this could be more than the usual 1% V-shaped dip.Also, we’ve been keeping an eye on COMP, which just missed tagging its SMA10 yesterday.  Might it take another swipe at it today?

    And, last, VIX — which has two clearly defined upside targets if allowed to go in that direction.

    UPDATE:  10:06 AM

    VIX has dropped down to test the SMA200, and USDJPY is rallying for no particular reason.  Otherwise, the initial pop would have fizzled by now.  But, it’s still early… I think it’s as simple as whether or not VIX bounces at the SMA200.  If it does, we’re looking at another leg down to 2438 or lower.  If it plunges through it, then 2482.I’m going to focus on CL and try to get that posted before I have to take off.

    UPDATE:  3:30 PM

    SPX is sitting just above the SMA5 200, exactly where it’s either going to reverse lower or break out.  The implication is that it’s going higher to the .886.  But, the fact that VIX hasn’t collapsed or CL broken out or USDJPY made new highs argues otherwise.

    Note that VIX is below the SMA200, but not below the yellow channel bottom.  It’s either a pretty good tell or a pretty good head fake.

    As to CL, I think this is the top.  But, I have more calculations to do before providing a target.  I’m in transit, but should have a chance to post those charts around 5:30-6:00 EST.

    UPDATE:  6:20 PM

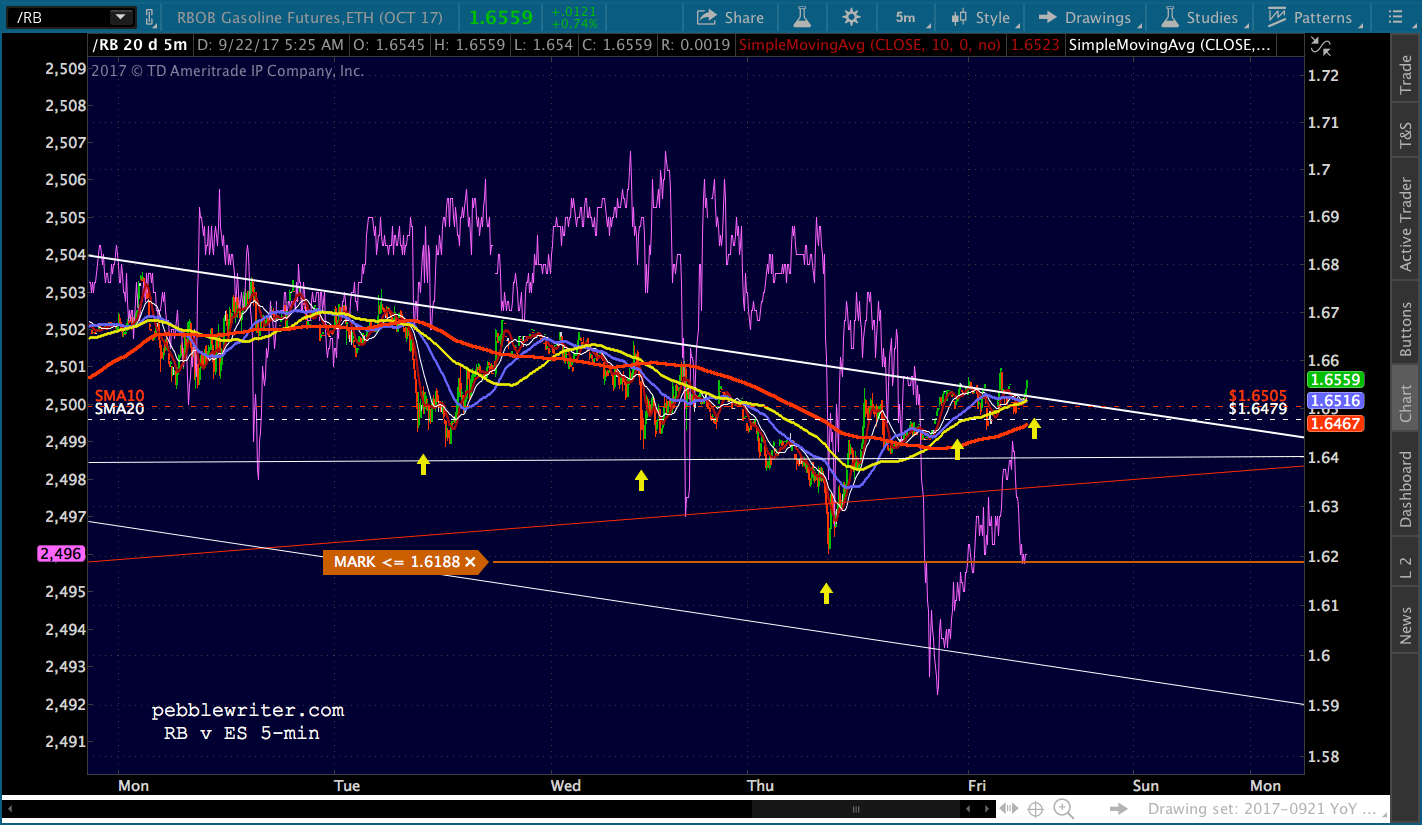
    For CL, the two charts below support my expectation that prices are headed lower.  Whether you’re talking about CL or RBOB, the August YoY comps spell higher inflation than the Fed would like (higher inflation = pressure to raise rates…not desirable in this environment with slowing economy and high “hidden” inflation.)

    I don’t have my oil price database with me on this trip.  But, the EIA is showing a very healthy monthly increase in average gas prices for August (3.9% MoM and 8.4% YoY.)   I believe this is understated, but  my back of the envelope calculations indicate CPI should come in at 1.9% or higher.

    Given that August’s YoY increase will be wildly higher, we should expect CPI to easily exceed 2% and potentially 2.5%.  I think the Fed will have no choice but to try to tamp down inflation and, therefore, oil/gas prices.  The fact that API reported a 2.8 million barrel build versus last weeks 5.78 million barrel draw is icing on the cake.  But, we’ll find out for sure tomorrow morning when EIA data is released.

    More tomorrow morning.


  • Update on Gold: Sep 6, 2017

    As the great philosopher would say, that escalated quickly.  Yesterday, gold reached our purple target detailed in our last update [see: Gold, Ready to Shine?]

    As we pointed out in June, 1348.60 is a key price level, as it represents 2 channel lines and the .886 retracement of the plunge from 1377 in July 2016…If GC is able to remain atop its SMA10/20 for the ride up to 1348.60, by all means ride along.

    We’ll take a quick look at what to expect next.

    continued for members(more…)

  • More Than A Pit Stop?

    Stocks were well on their way to a breakout over the holiday weekend, a common enough occurrence — when reality demanded a pit stop (hydrogen bombs and impending ICBM launches can have that effect.)

    S&P futures dropped 20 points from Friday’s highs by the time they reopened Sunday.  Even after a concerted ramp job, things still looked dicey for today’s open as of a couple of hours ago.  The rising red channel had broken down and hinted at a corrective C-wave down to 2450ish.But, that was before the algos got busy.  Now, with 20 minutes till the open, a breakout is solidly back on the table.  As one reader pointed out the other day, what’s it going to take for stocks to sell off?Glad you asked.

    continued for members(more…)

  • Charts I’m Watching: Sep 1, 2017

    VIX completed the first breakdown we discussed yesterday, but stopped short of dropping through the white channel midline.  Thus, although the implications are bullish, equities have yet to actually break out.continued for members(more…)

  • It’s Their Nature (An Update on VIX)

    In considering central bankers’ “assistance” to markets, I’m reminded of the old fable about the scorpion and the turtle:

    A turtle was happily swimming along a river when a scorpion hailed it from the shore.

    The scorpion, being a very poor swimmer, asked the turtle to carry him on his back across a river. “Are you mad?” exclaimed the turtle. “You’ll sting me while I’m swimming and I’ll drown.”

    “My dear turtle,” laughed the scorpion, “if I were to sting you, you would drown and I would go down with you, and drown as well. Now where is the logic in that?”

    The turtle thought this over, and saw the logic of the scorpion’s statement. “You’re right!” cried the turtle. “Hop on!”

    The scorpion climbed aboard and halfway across the river the scorpion gave the turtle a mighty sting. As they both sank to the bottom, the turtle resignedly said:

    “Do you mind if I ask you something? You said there’d be no logic in your stinging me. Why did you do it?”

    “It has nothing to do with logic,” the drowning scorpion sadly replied. “It’s just my nature.”

    Forget their statutory mandates.  FOMC members lay awake at night worrying about three things:

    (1) keeping interest rates low enough to prevent devastating deficits, but high enough to keep “animal spirits” alive;
    (2) keeping inflation low enough to facilitate low interest rates, but high enough to not choke off investment;
    (3) keeping equity prices on the rise, in hopes of eliciting a “wealth effect” or, more importantly, avoiding another meltdown.

    They have many tools with which to accomplish the above, of course.  But, in general, QE dominated between 2008-2011.  The yen carry trade took over between 2011 and 2015.  Oil’s recovery came to the rescue for most of 2016.  And, VIX has been the tool of choice since December 2016.

    Each of the last three is still active from time to time, with VIX being the most effective lately.  We had a reminder, just yesterday, of how well it works.  SPX was able to break out of a falling channel……simply because VIX was crushed by nearly 20%, dipping below the support of two key SMAs and the bottom of a long-term channel (shown below in yellow.)  In fact, it’s pretty clear that SPX’s recent slide occurred entirely while VIX managed to pop up above the yellow channel bottom.Algorithms, mindlessly searching for clues as to direction, eat this stuff up.  Just last week, Fed chair Yellen admitted that algorithms’ influence is increasing.

    Yet, she characterized the rising influence as worrisome.  And, she and several other FOMC members have expressed concerns that equity valuations are too high.  If that’s the case, why do they continue to manipulate currencies, oil prices and VIX?

    Like the scorpion, it’s their nature.  Interest rates and inflation are pretty well under control most of the time [in the case of inflation, it’s mostly a matter of defining it properly.]  And, when they’re not, they can be fine tuned or bludgeoned into place as need be.  The stock market is a little trickier — hence the combination and alternating of different techniques.

    And, stocks are arguably more closely watched than interest rates and inflation, imparting a daily, almost instant, impact on the country’s financial mood and appetite for risk.

    So, although the Fed might like to make it to the other side of the river (with moderate growth, moderate inflation and normalized interest rates) it’s more important to keep stocks on the rise — even if it means inflating bubbles that will ultimately sink us all.

    With that in mind, let’s take a fresh look at VIX.  The chart below, which we’ve examined many times, shows a rising yellow channel.  Every year or so, VIX drops down to the channel bottom — corresponding with a rally in stocks which is characterized by general complacency.  The tags are marked by yellow arrows.Note that each tag is followed by a spike in VIX which corresponds with a sharp drop in stock prices (the thin purple line.)

    Everything changed following the US election last November.  The historic sell-off which occurred that night (-5.4% in S&P futures) was completely erased by early the next morning after USDJPY and CL made spectacular reversals.  But, the manipulation of oil prices and FX leaves a mark.  It has real and immediate consequences.

    VIX, on the other hand, can be hammered into oblivion without inflicting any damage — other than to unsuspecting bears.  And, that’s exactly what happened.  Of the 168 sessions so far in 2017, VIX has tagged or dipped below the yellow channel line 108 times.VIX has been so reliable since the beginning of the year that I have come to regard it as a veritable “toggle switch” for equities.  The big yellow channel bottom nearly always comes into play with any significant rally by SPX.

    And, when it doesn’t, it’s only because a lesser trend line or some other surrogate has broken down, instead.  Note that there doesn’t even need to be a break down.  Simply approaching the channel bottom, threatening to drop below it, can be enough to boost equities.Admittedly, we’ve covered this same ground many times over the past 8 months.  Why rehash it now?  Yesterday, VIX crossed a line that should make a difference in whether the bears will finally get their day in the sun.

    continued for members(more…)

  • Gold: Ready to Shine?

    It’s happening again. The notes from gold bugs are starting to flood in, wondering whether this time is different, whether the breakout is real.

    Recall that our last update [June 7 Update on Gold] came tantalizingly close to a bullish call.

    If DXY falls through the midline of the purple channel (96.10) then, sure, GC could complete the IH&S and keep going. But, I think it’s unlikely. I think central bankers are loath to see gold break out, just like they’re loath to see the dollar break down past a certain point.

    As it turned out, DXY did fall through 96.10.  On Aug 10, GC popped up above a powerful trend line of overhead resistance (below in yellow) that has been confounding gold bulls since Sep 2011.   It’s latest affront came on Jun 6, when it presided over a 7.3% month long reversal. Note that it was so strong as to send gold lower even while DXY fell (they are normally negatively correlated.)

    As a result, GC finally tagged the .786 Fib at 1323.30.  And, each test launch from North Korea and tweet from the White House lavatory sees it tick a little higher.

    Will it finally break out?  Is gold finally ready to shine?

    continued for members(more…)

  • Unicorns and Butterflies?

    Another day, another V-shaped recovery.  This one overshot our next downside target by 3 points, reversing at a nonsensical Fib level.

    The talking heads would have us believe that traders suddenly stopped caring about nuclear war and floods of biblical proportions.  But, it was just another sudden collapse in VIX leading algos down the path to the land of unicorns and butterflies.It’s worth noting that VIX stopped short of the yellow channel bottom, and has since bounced a little higher.  Could our next downside target still be in play?

    DXY rebounded where we expected, but CL still has a ways to go.  And, it remains to be seen how the divergence between oil and gas prices will impact August CPI.

    Note that today’s second Q2 GDP revision came in hotter than expected, even after adjusted for (non-existent) inflation. One thing we know for sure…while the Fed would like to raise rates at least enough to build some cushion for the next calamity, they don’t want to be forced into such a position.

    Thus, it’ll be interesting to see how the EIA inventory data shakes out later this morning (and, how creative the folks at the BEA will need to be.)

    continuing for members(more…)

  • Better Late than Never: Aug 29, 2017

    SPX should reach our next downside target today — even if it is two sessions late.

    DXY has tagged its next downside target.  USDJPY is fast approaching its target.  Oil even broke down as expected.  All it took was a hurricane of historic proportions and the threat of global thermonuclear war.

    continued for members... (more…)