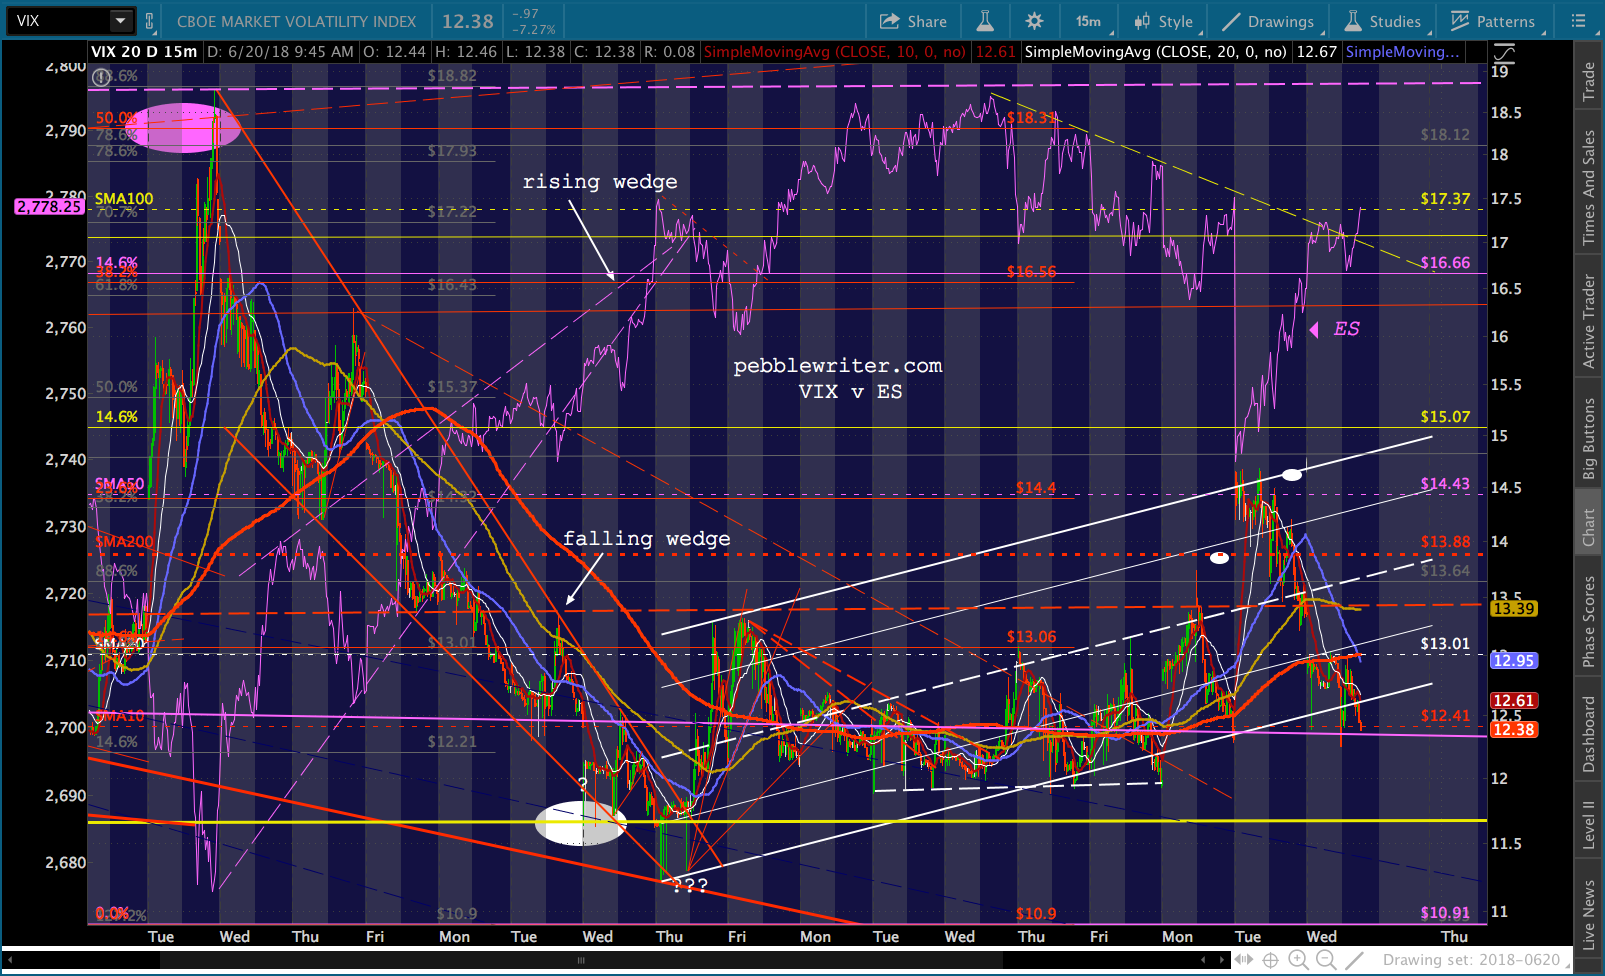
A quick glance at VIX tells you all you need to know about the past two weeks. VIX has steadily gained since Jun 7. But, most of the gains have come in the after-hours, elevating VIX to a level from which it can make a meaningful plunge during the next day’s trading session. As ES once again pushes up against the TL connecting its highs of the past week, is it any surprise that VIX’s rising white channel is threatening to break down?
This is a classic case of algorithmic misdirection. While equities are dipping and recovering intraday on VIX’s dramatic plunges, oil and gas have fallen about 12% from their May 22 highs, emerging markets are having a very rough go of things, and the yield curve continues to flatten.
It continues to remind me of 2011 in many ways. Look for tomorrow’s post concerning oil and gas, inflation, interest rates and equities – then and now.
continued for members…
Around the horn…
SPX looks poised to test its SMA10 – also the top of its little falling white channel – as VIX dips below its SMA10.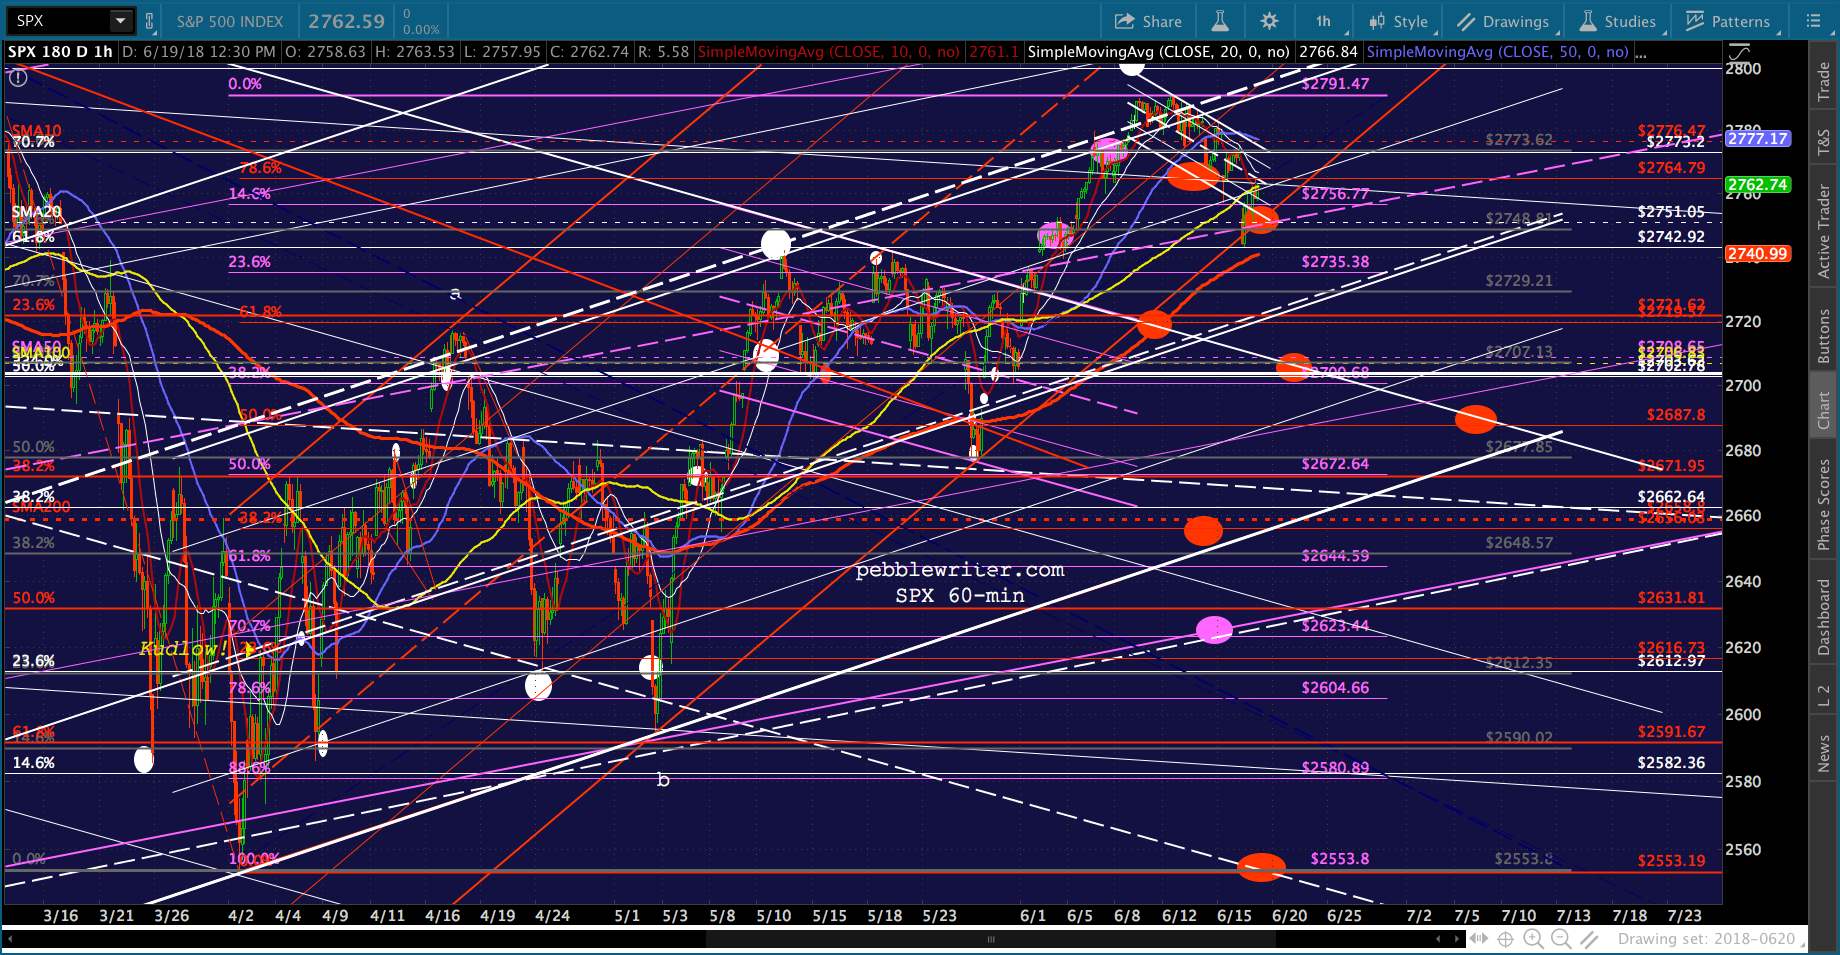
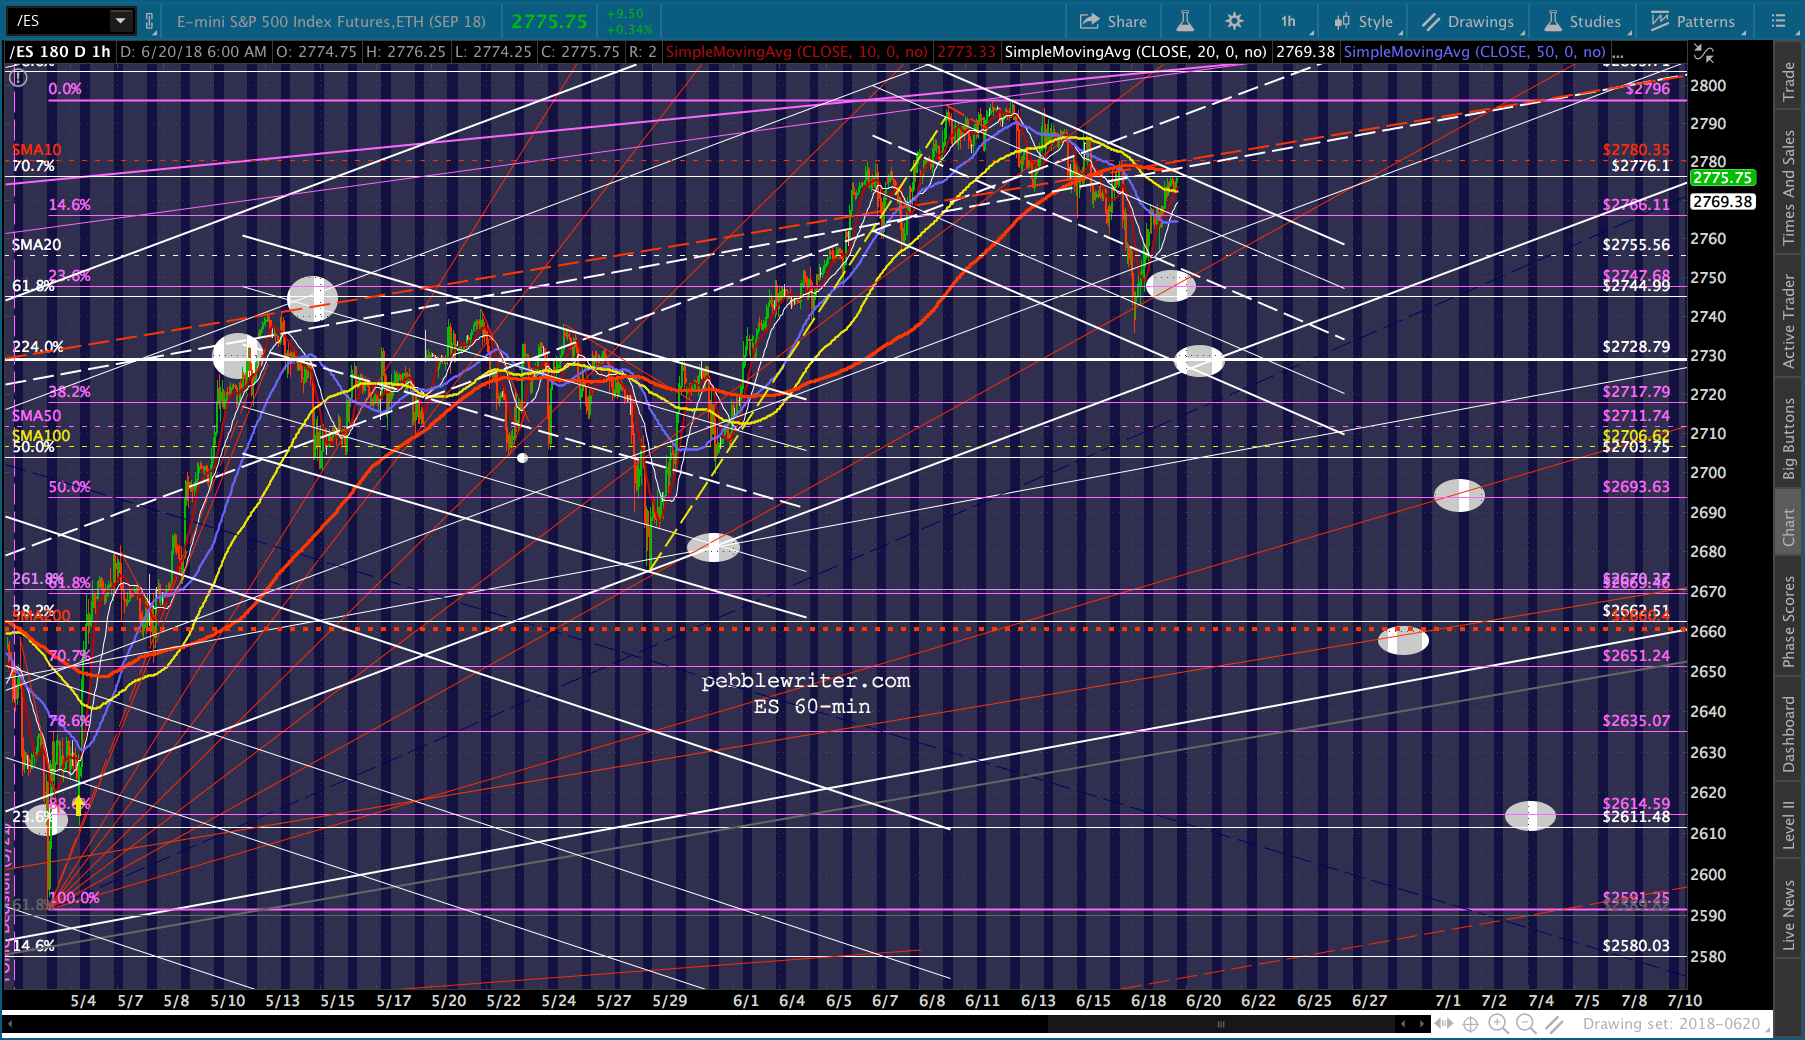
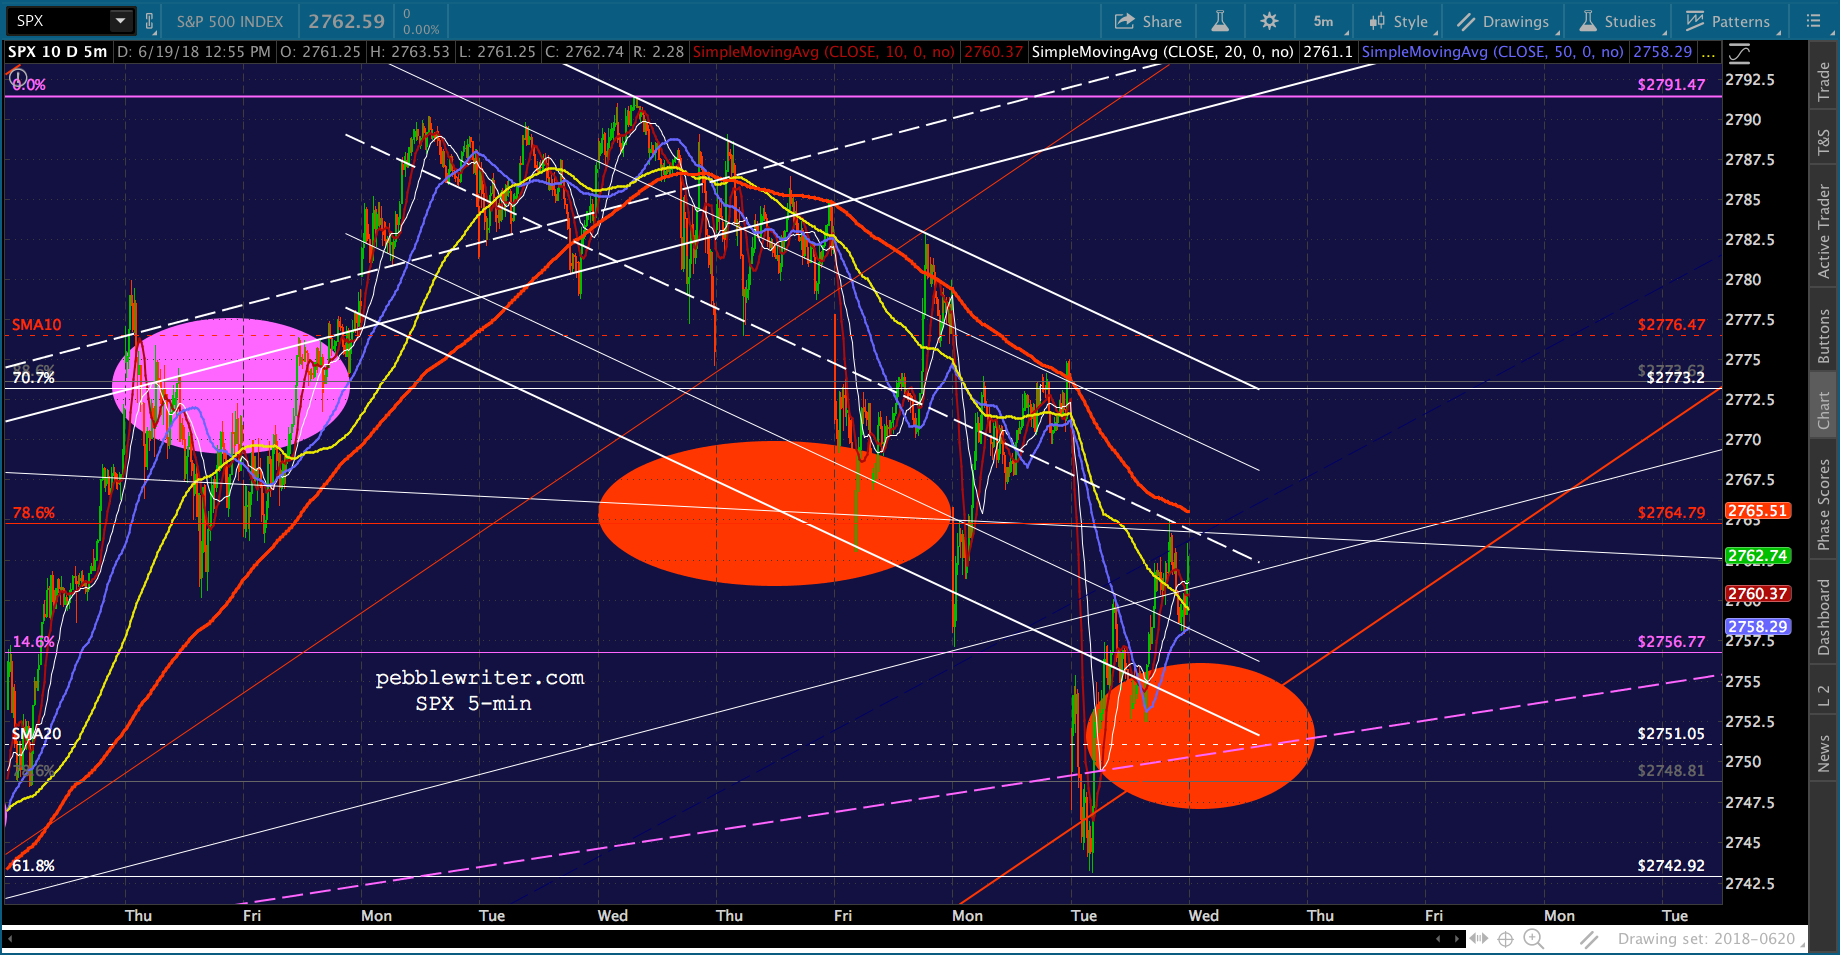 ES is already there.
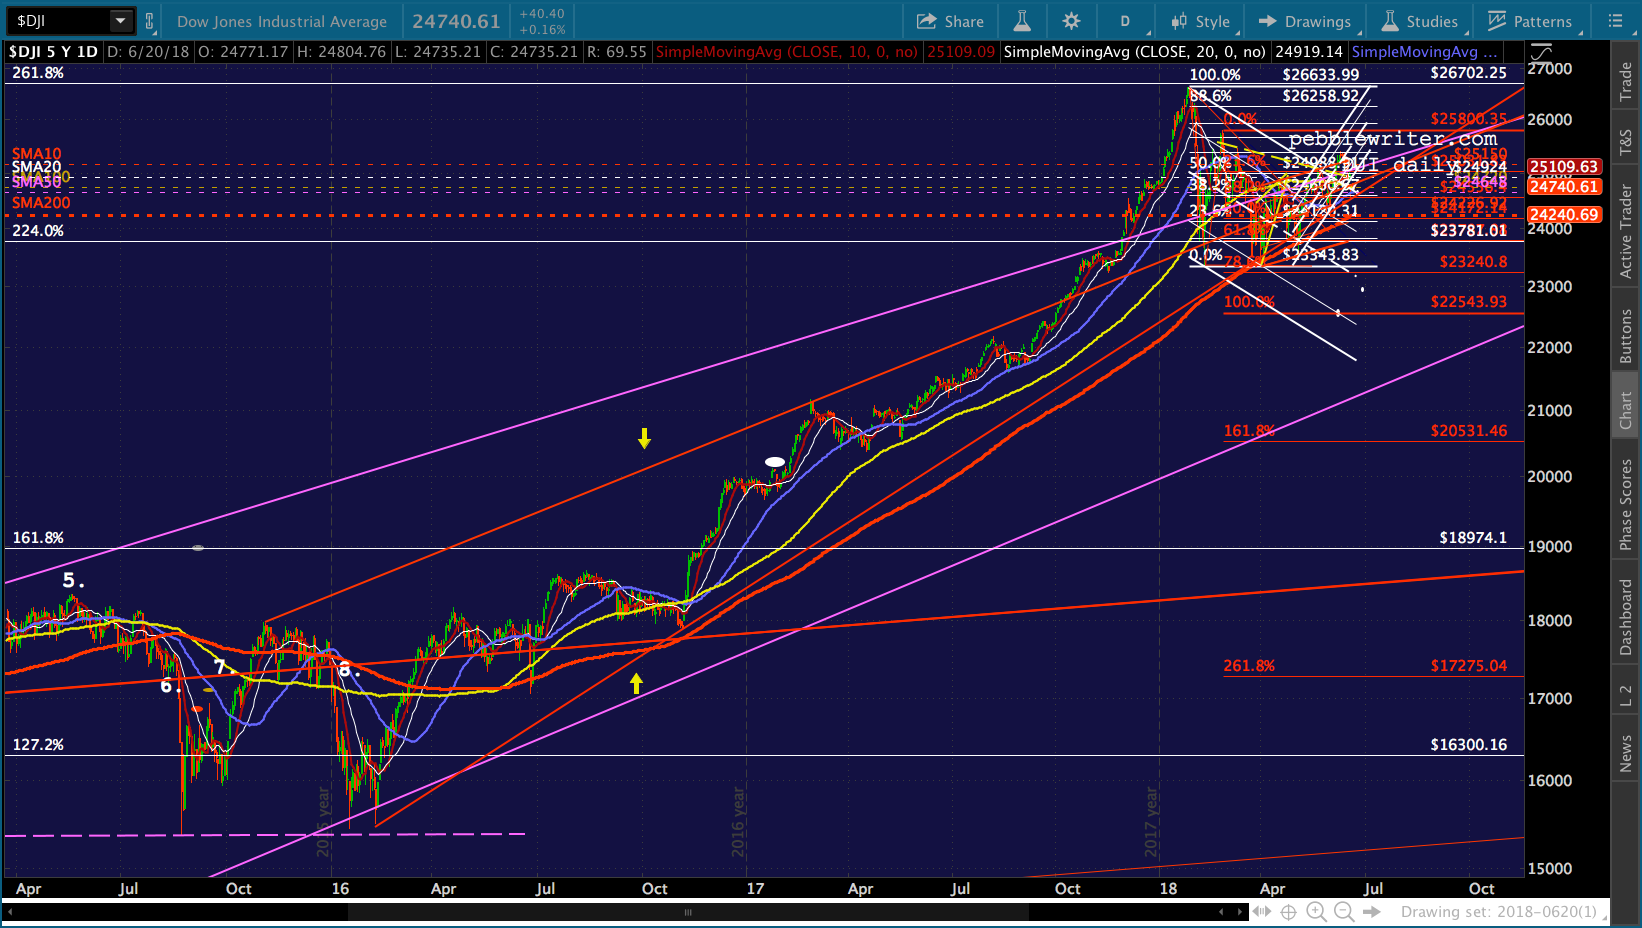
 The Dow made the sneakiest test, yesterday, of the bottom of the rising wedge it broke out of several times and is likely biding its time for another tag of the SMA200.
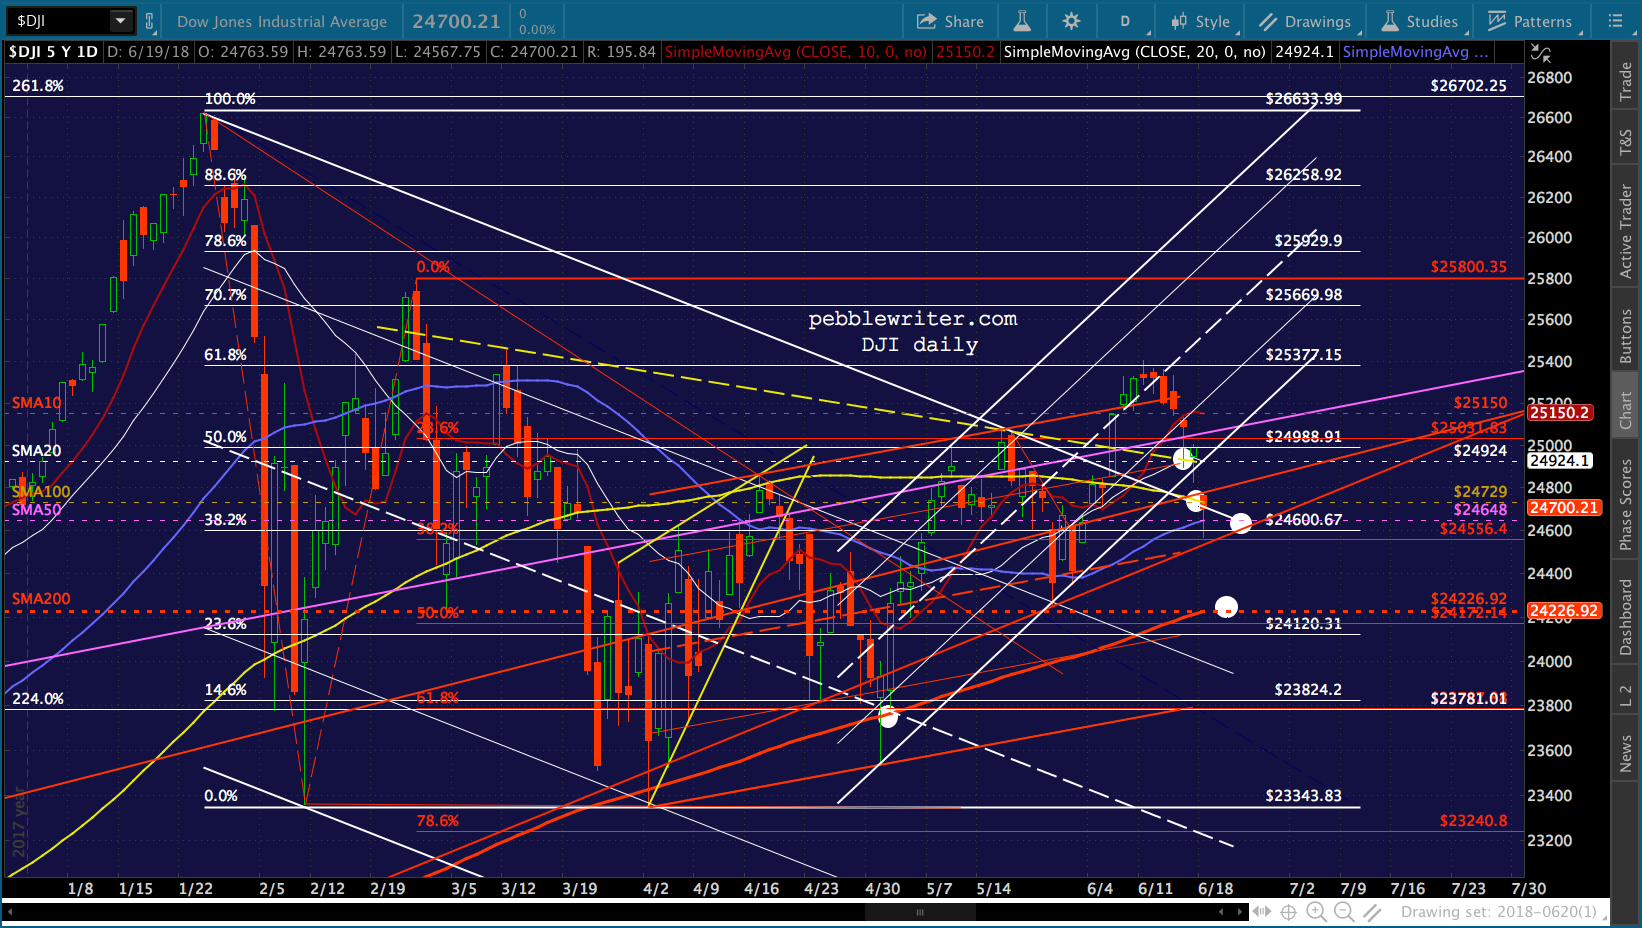
 On the currency front, USDJPY inched its way back to the SMA200 last night, but has fallen back again. How many times will the machines fall for this? Not sure, but it’ll continue until USDJPY either breaks out or falls apart.
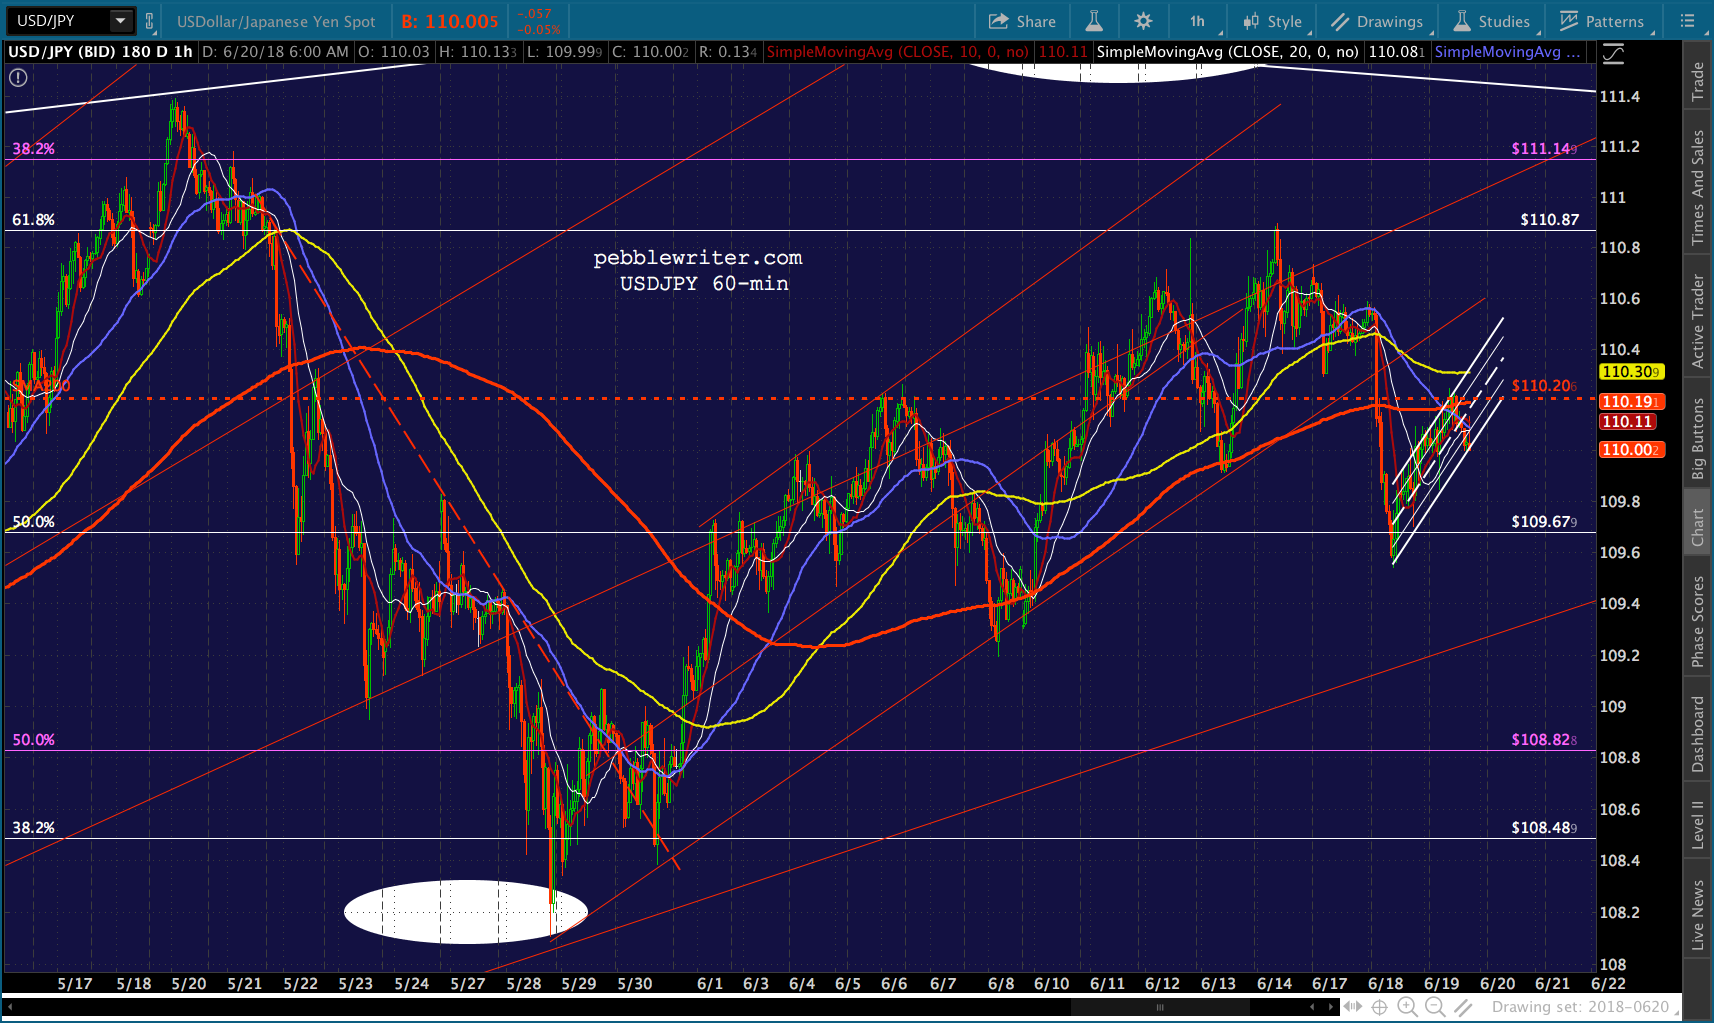 NKD strongly suggests this morning’s ramp job will fall apart — with the obvious SMA200 tag a near miss yesterday.
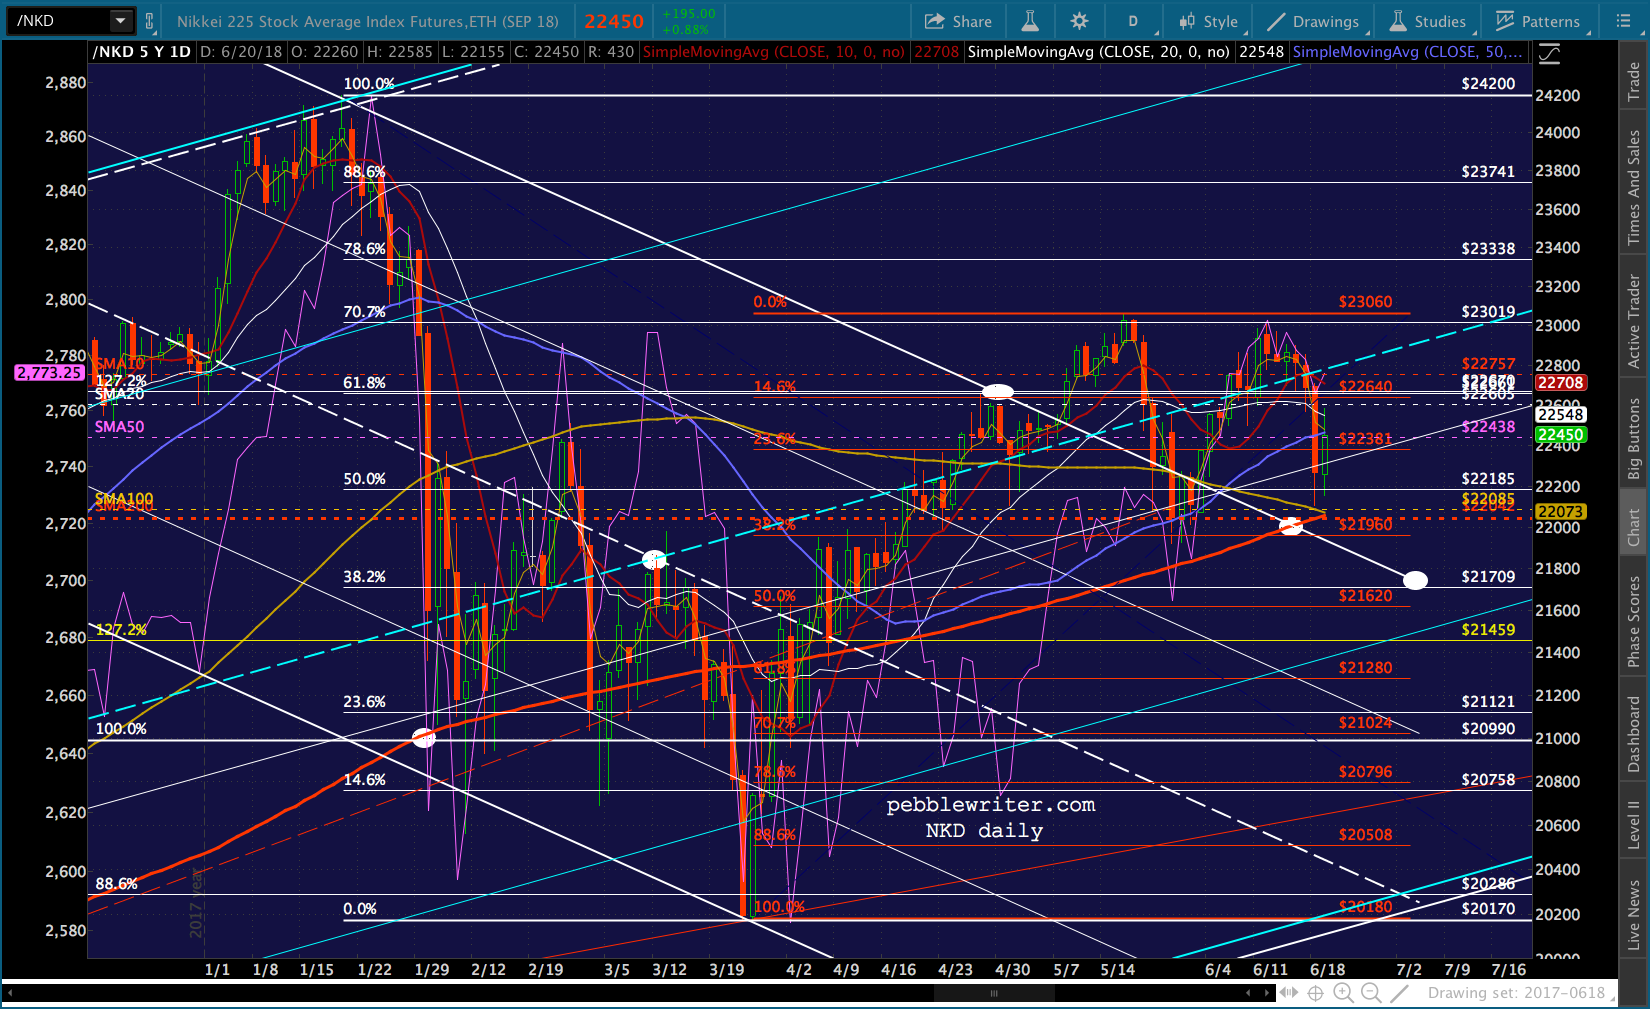 UPDATE: 12:40 PM
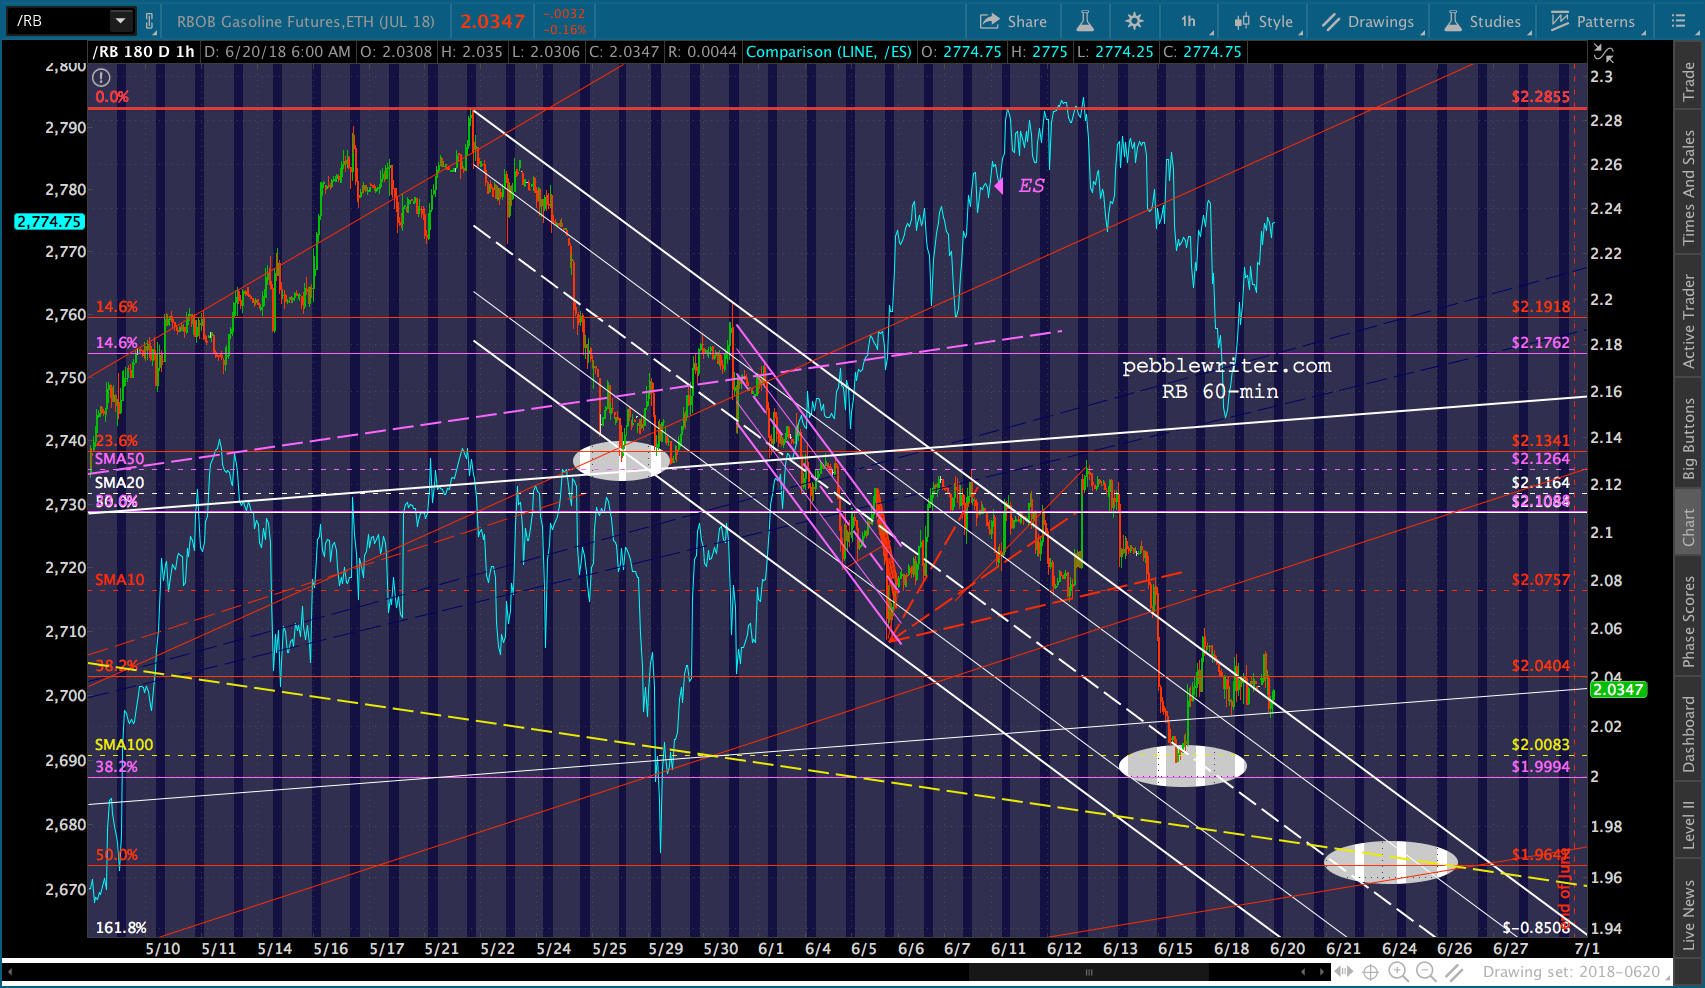
Big build in gasoline…no surprise.
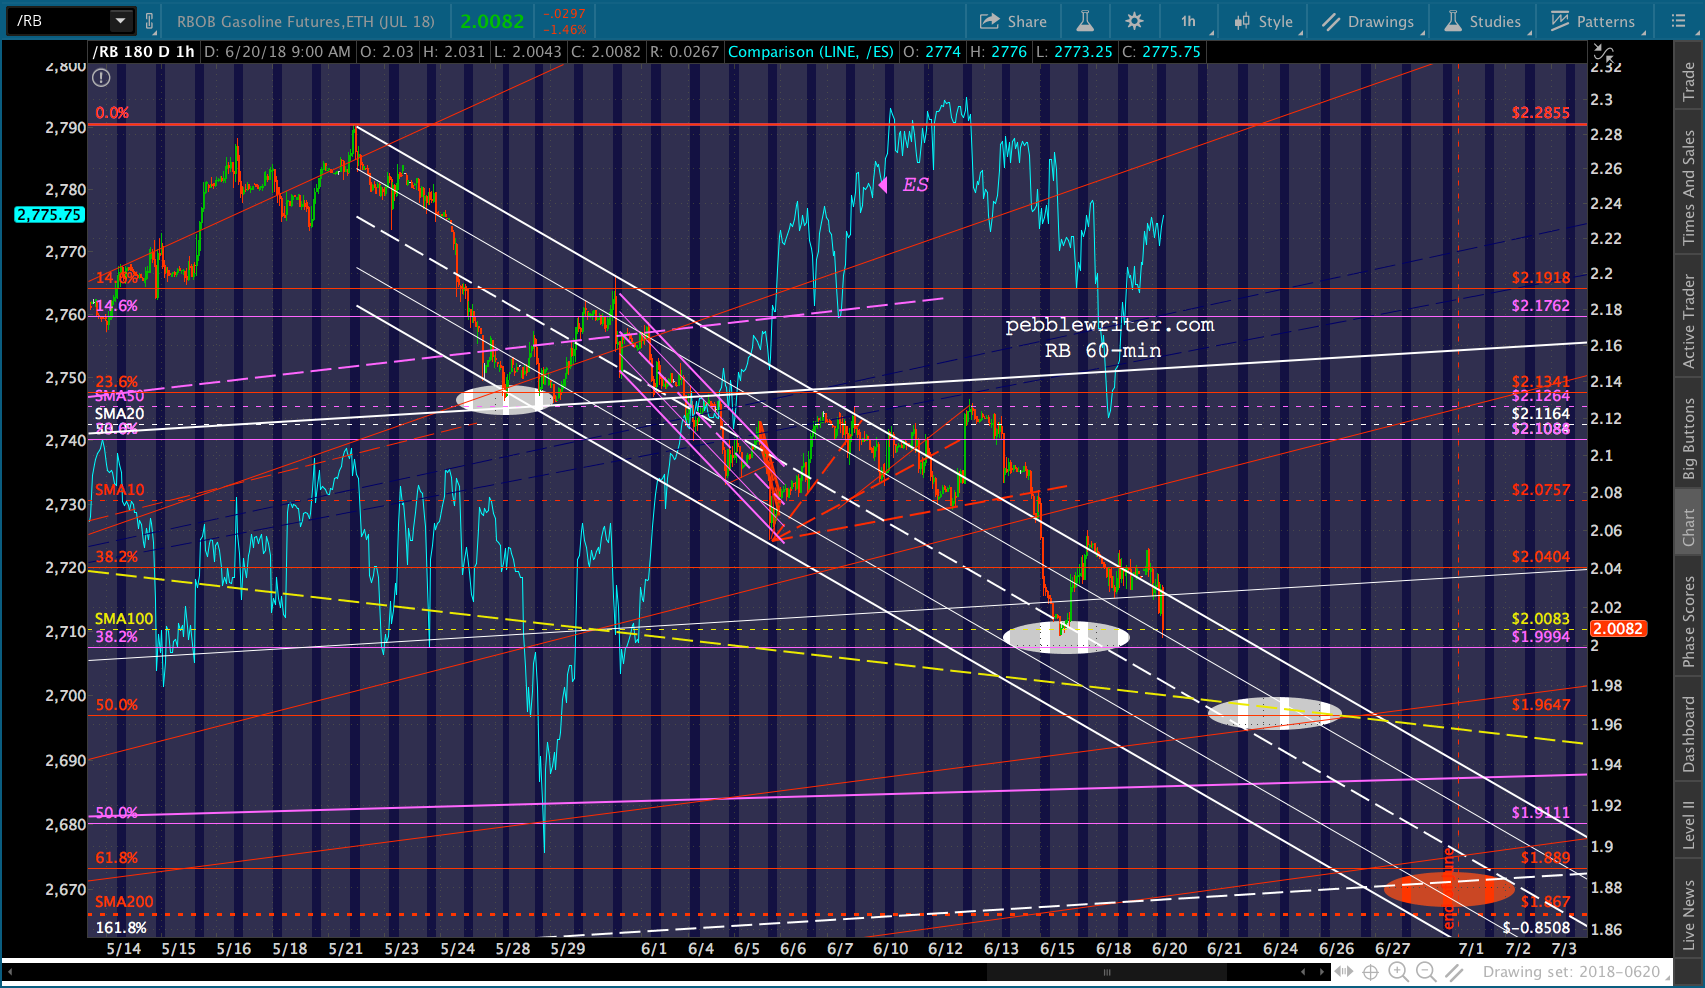
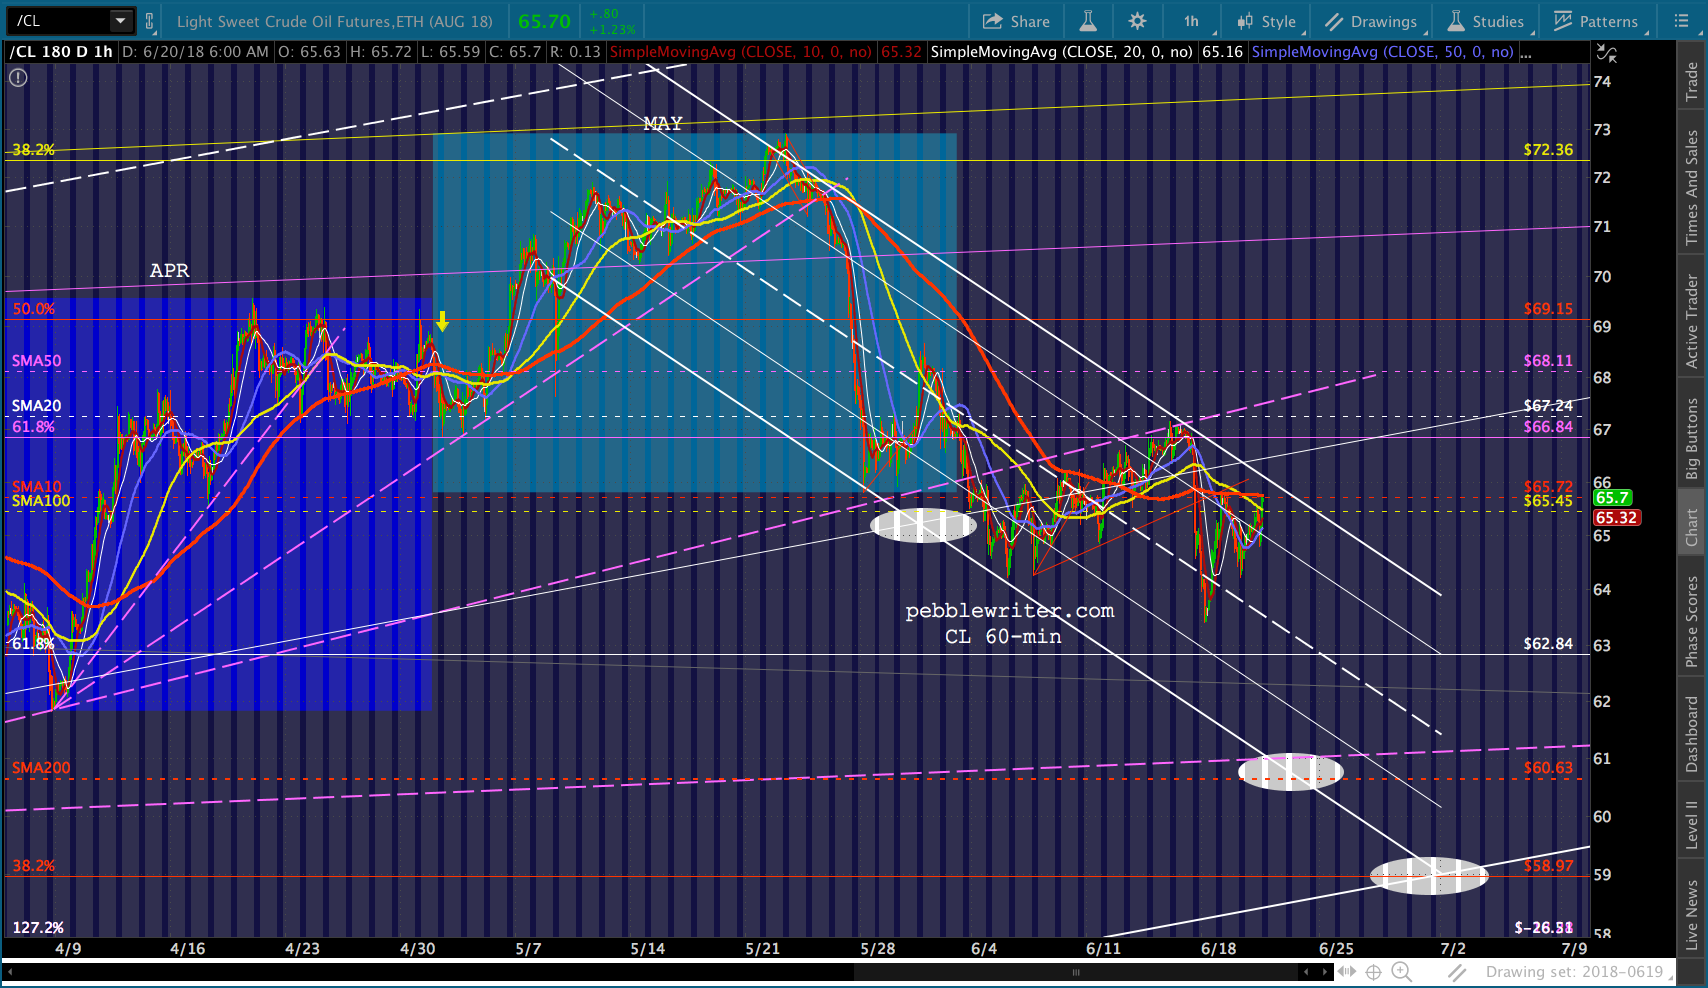
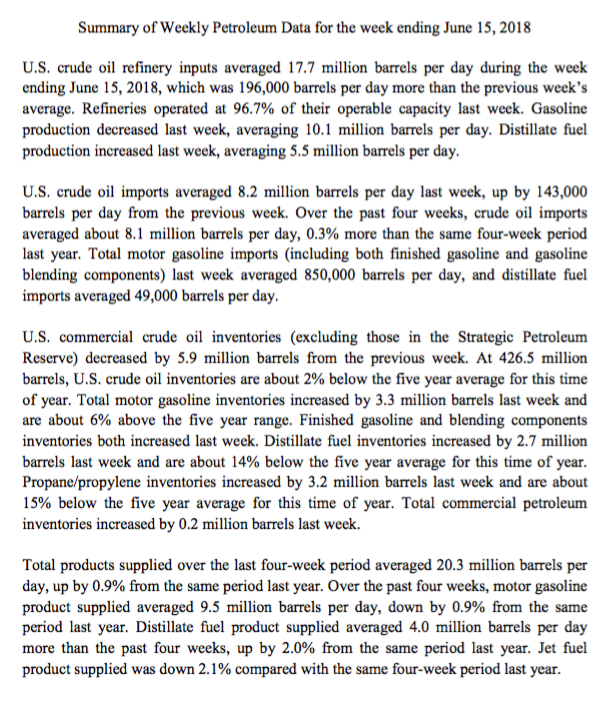 Crude, on the other hand, saw a draw. Quite a divergence between CL and RB…
 These two charts might be a negative for stocks, but SPX breaking out…
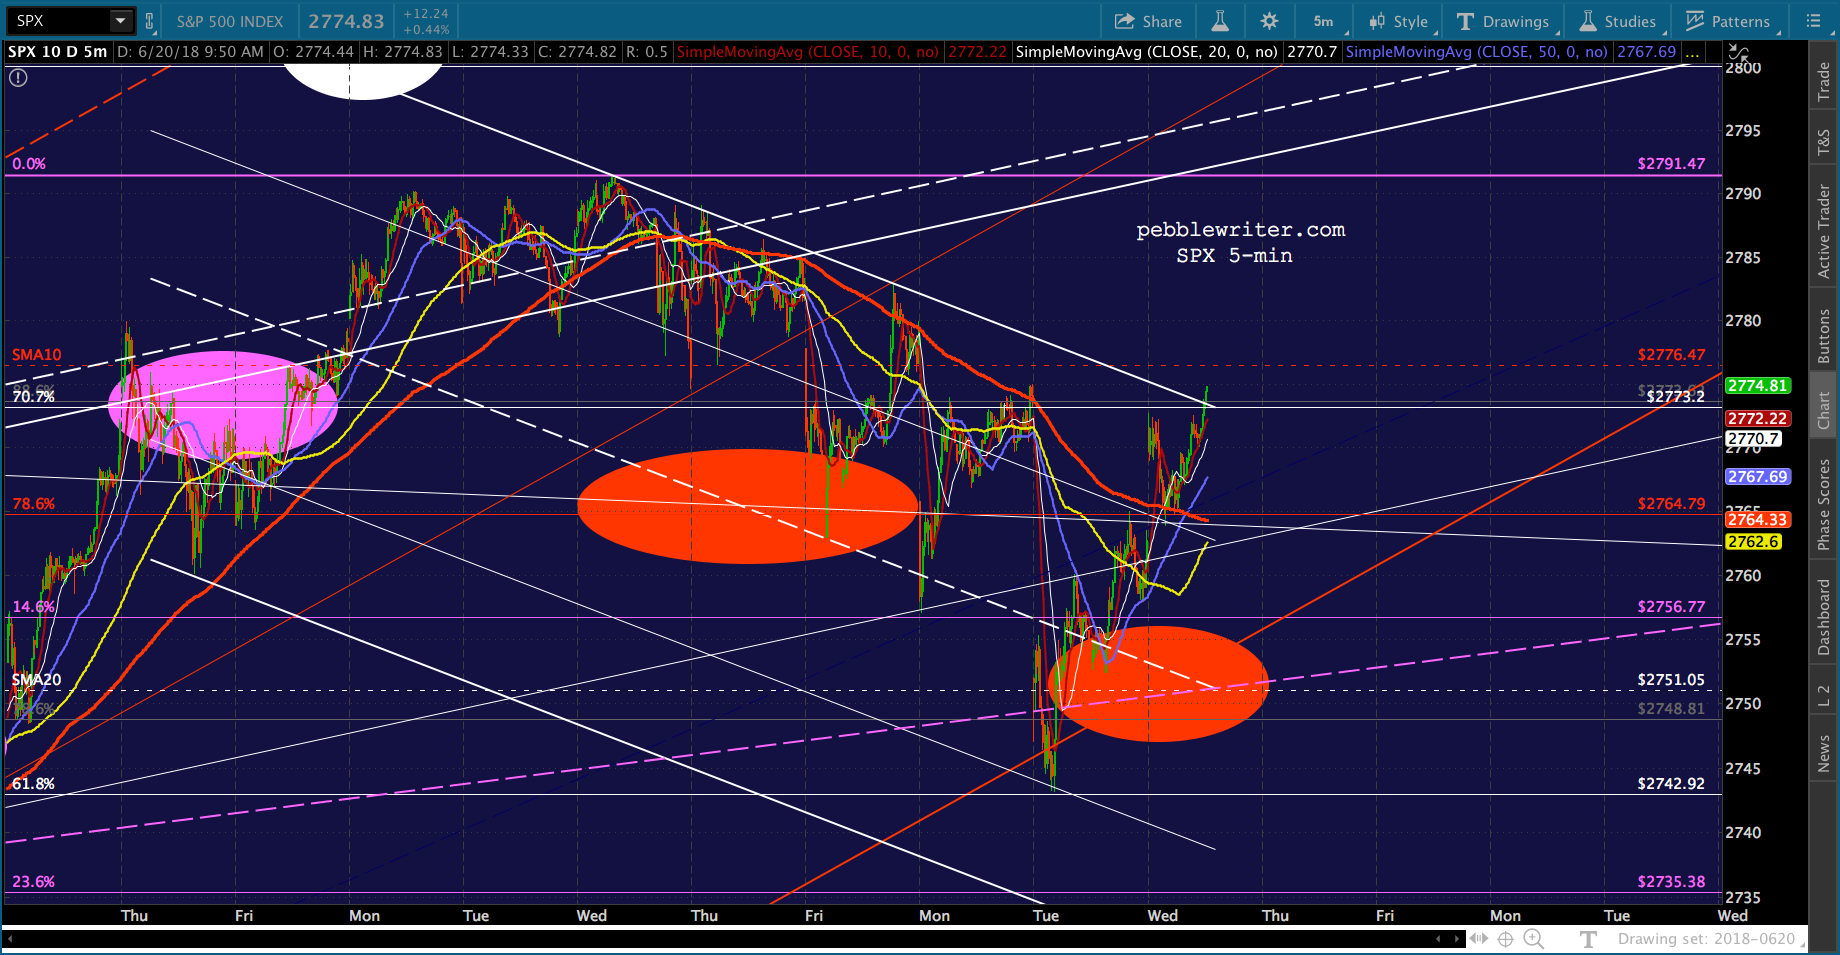 …on USDJPY’s push back above the SMA200…
 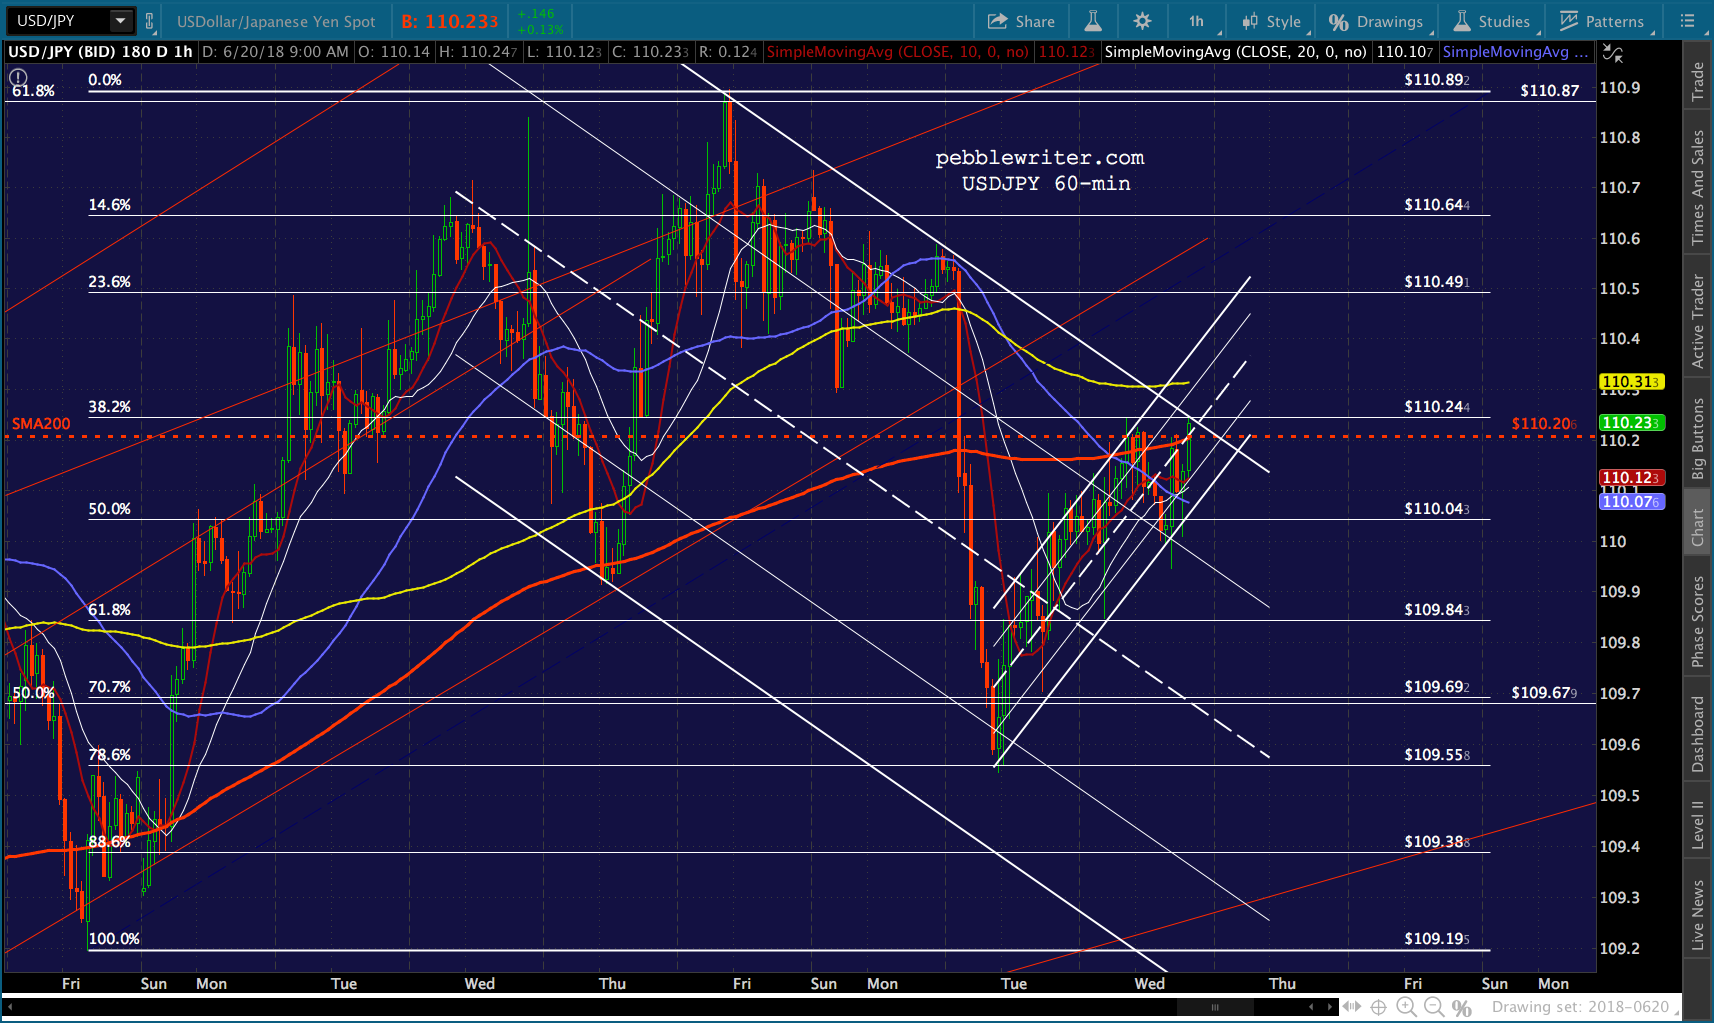 …and, of course, VIX’s threat (again) to break down.