Futures are off again this morning in the lead up to the FOMC meeting.
 continued for members…
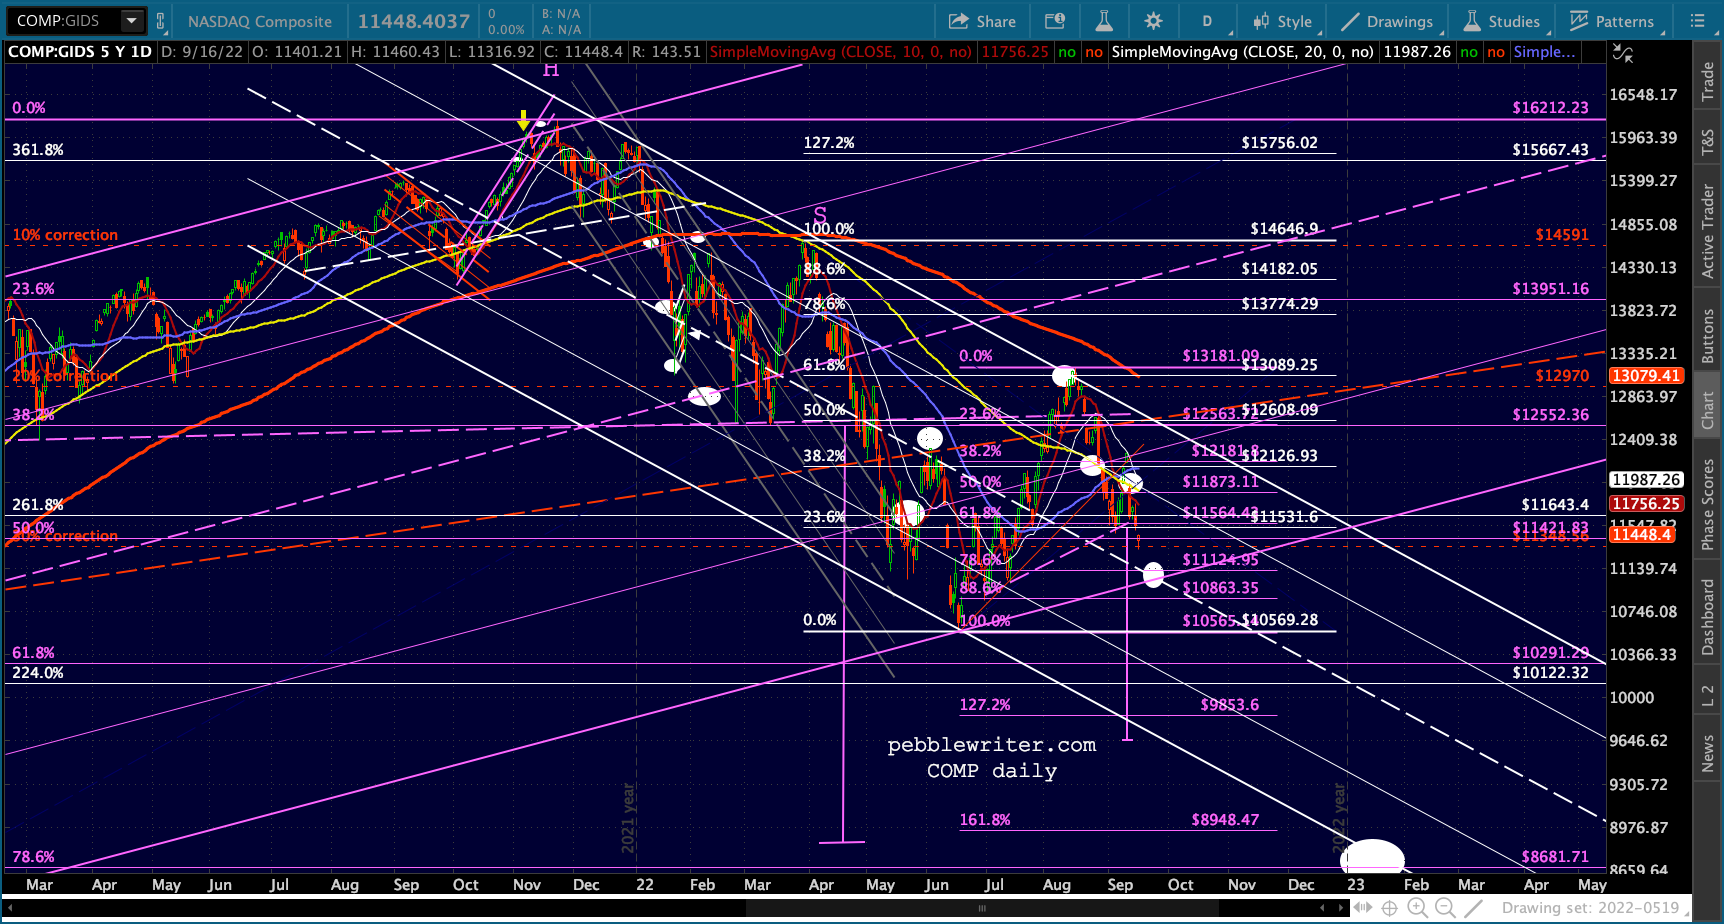
It’s hard to ignore the fact that ES and SPX continue to backtest the falling purple channel. Even though the path is obviously lower, it has provided an escape hatch of sorts for stocks ever since it first occurred on Aug 31.  Nevertheless, ES, SPX and COMP have all completed a bearish H&S Pattern.


 The other thing that happened at the end of August was VIX establishing important overhead resistance at 27-28.
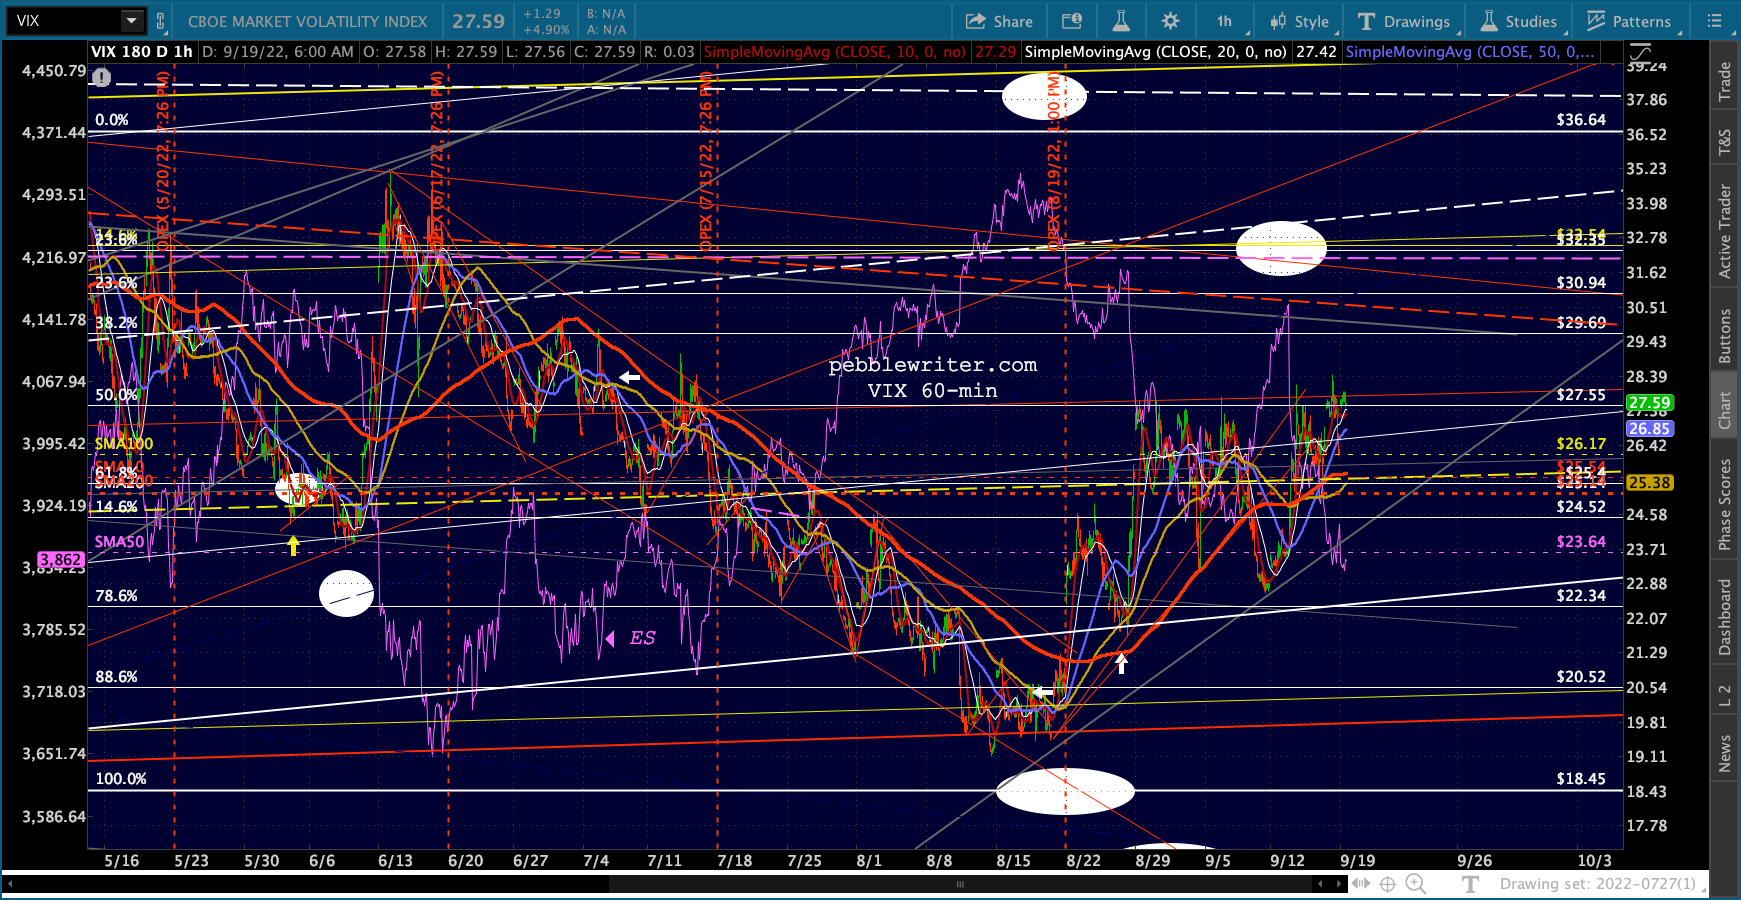
 USDJPY made another dip below the little trend line from early August. It hasn’t yet recovered, but is backtesting the TL at a slightly lower high.
 It remains, however, above the 1.618 Fib support – sending bullish signals to algos.
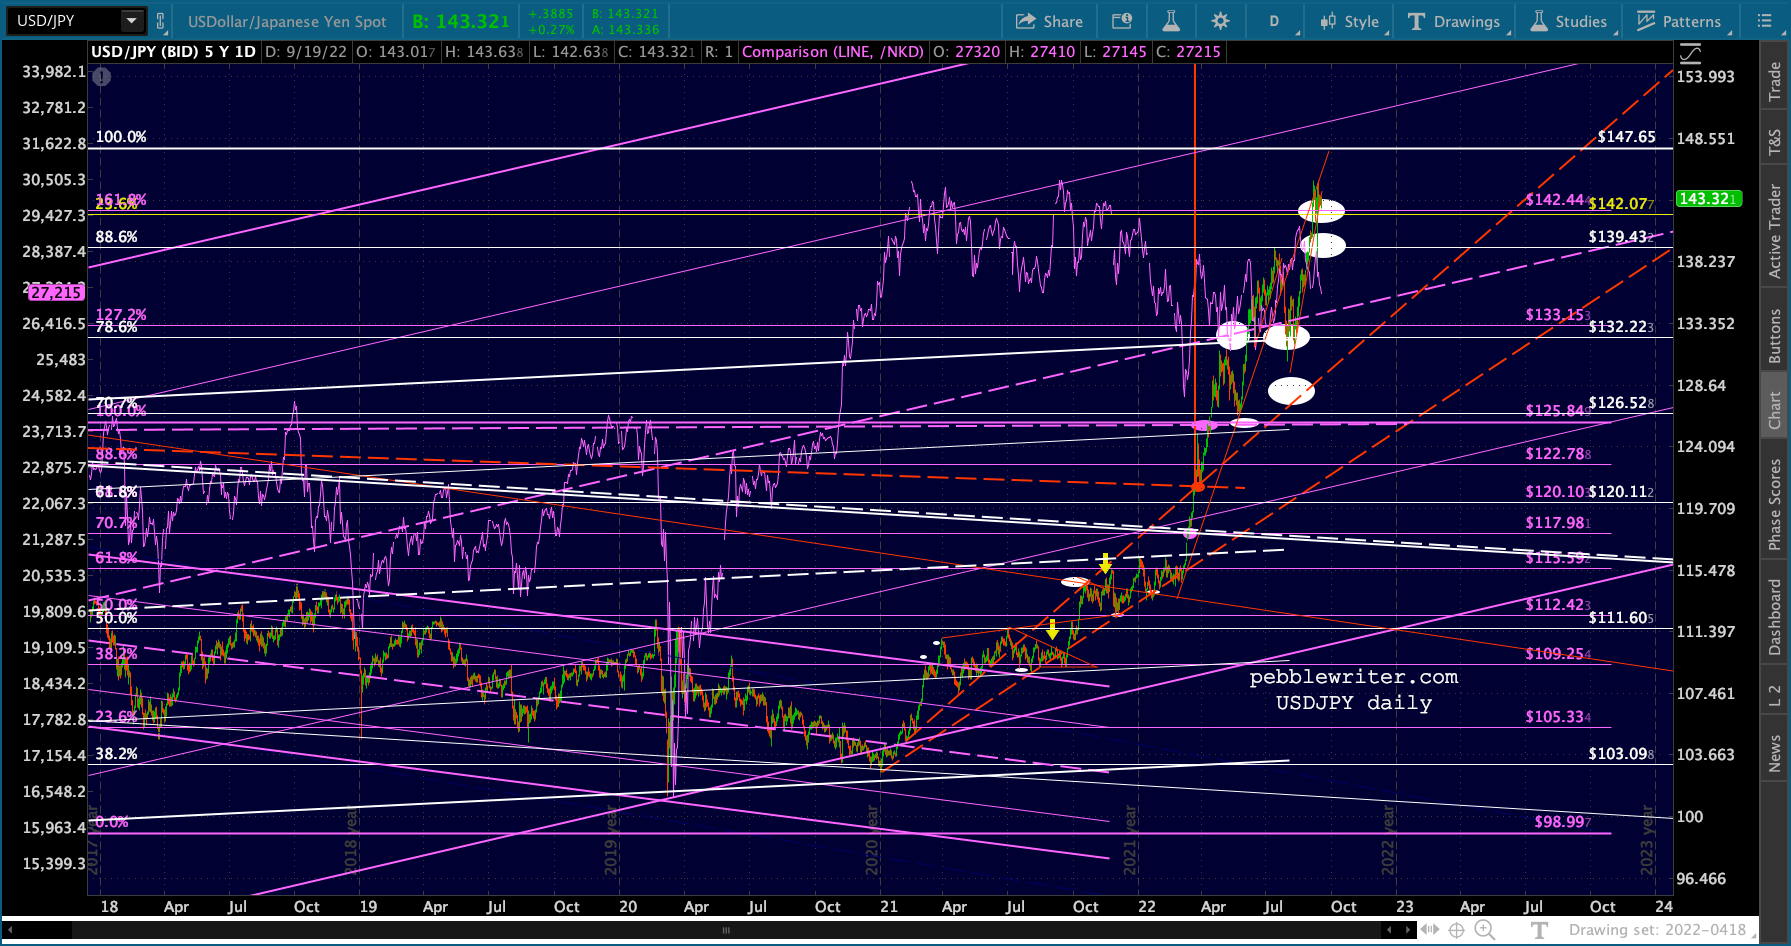 EURUSD continues its slomo rollover.

 BTC is very close to producing its first lower low since the Flag Pattern first began to take shape.
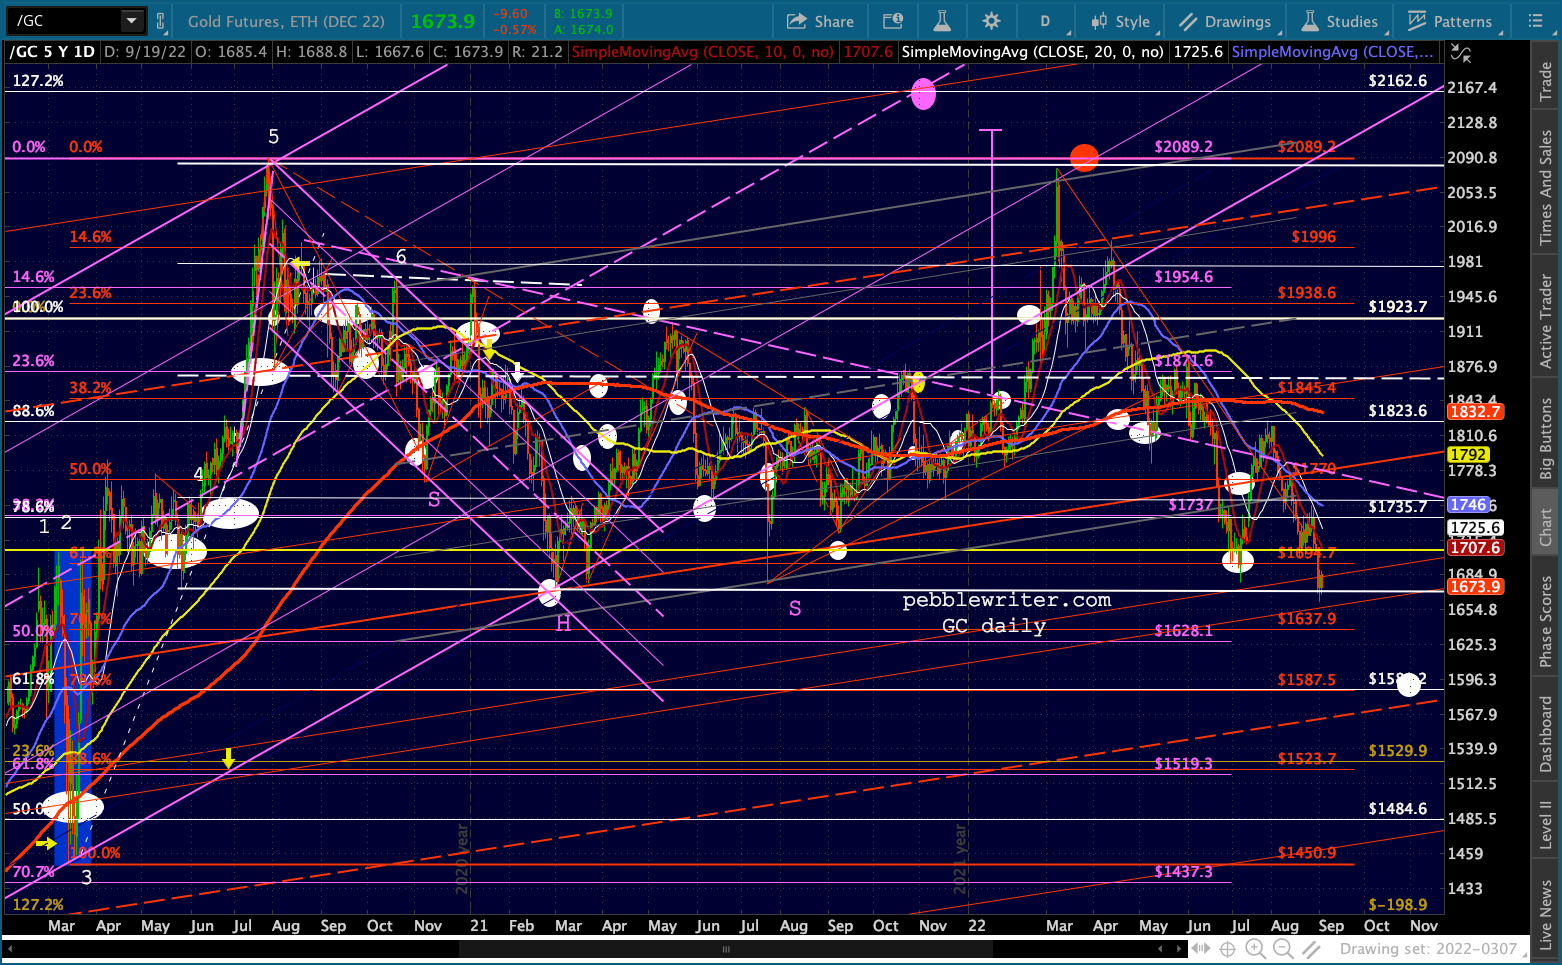
 Oil and gas are both off sharply this morning – but no lower lows just yet…
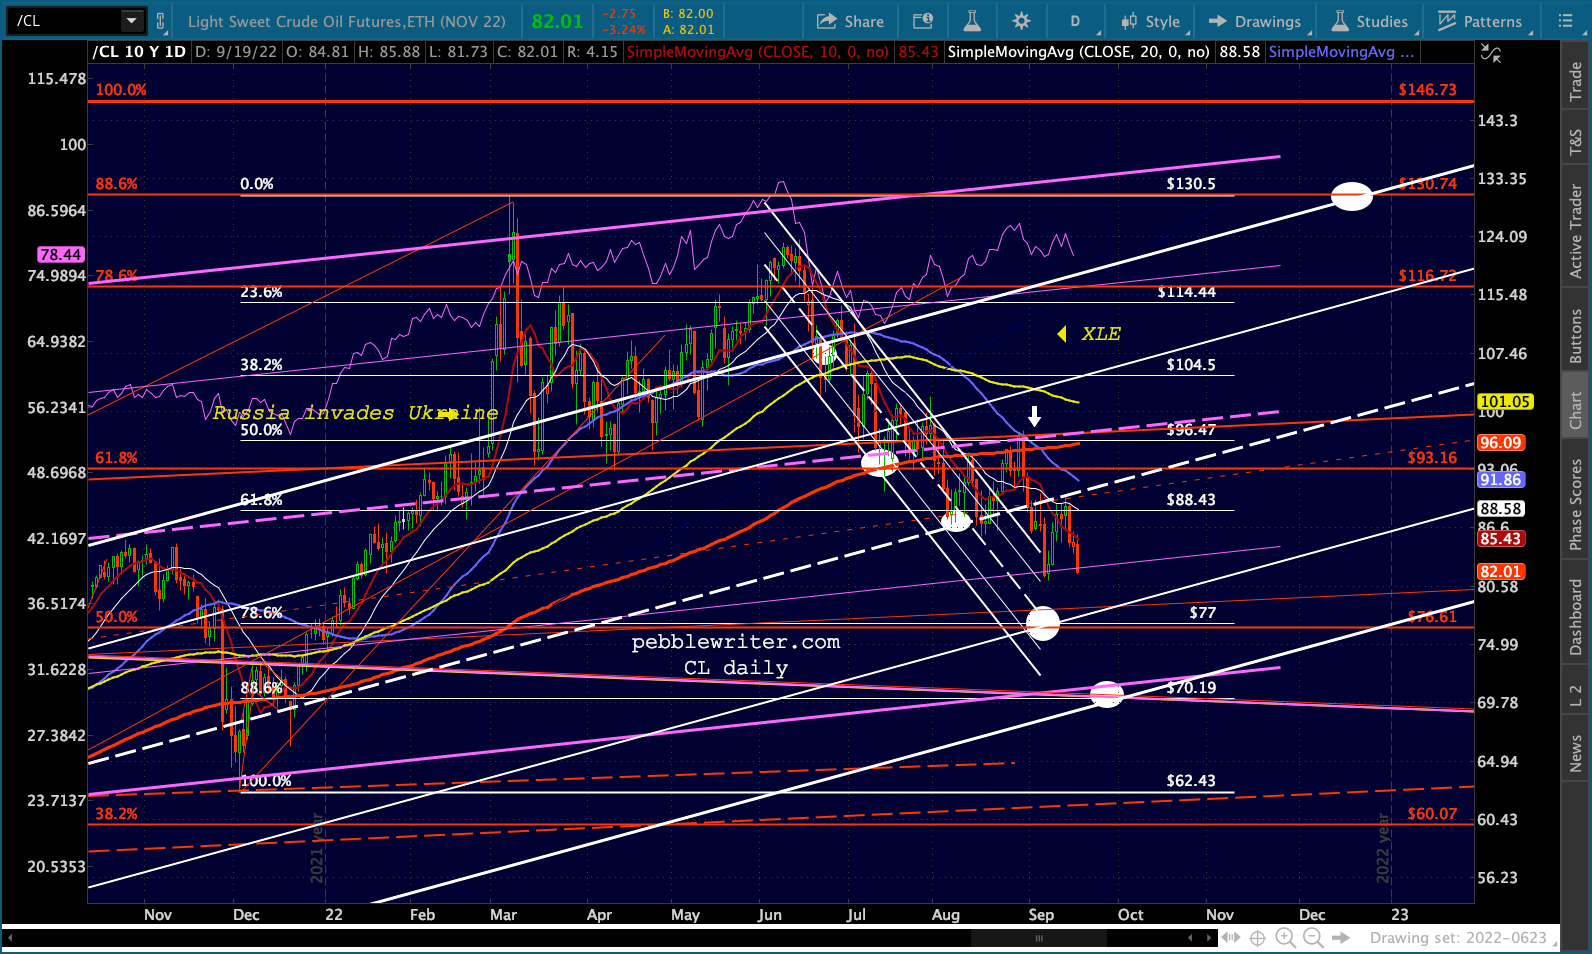
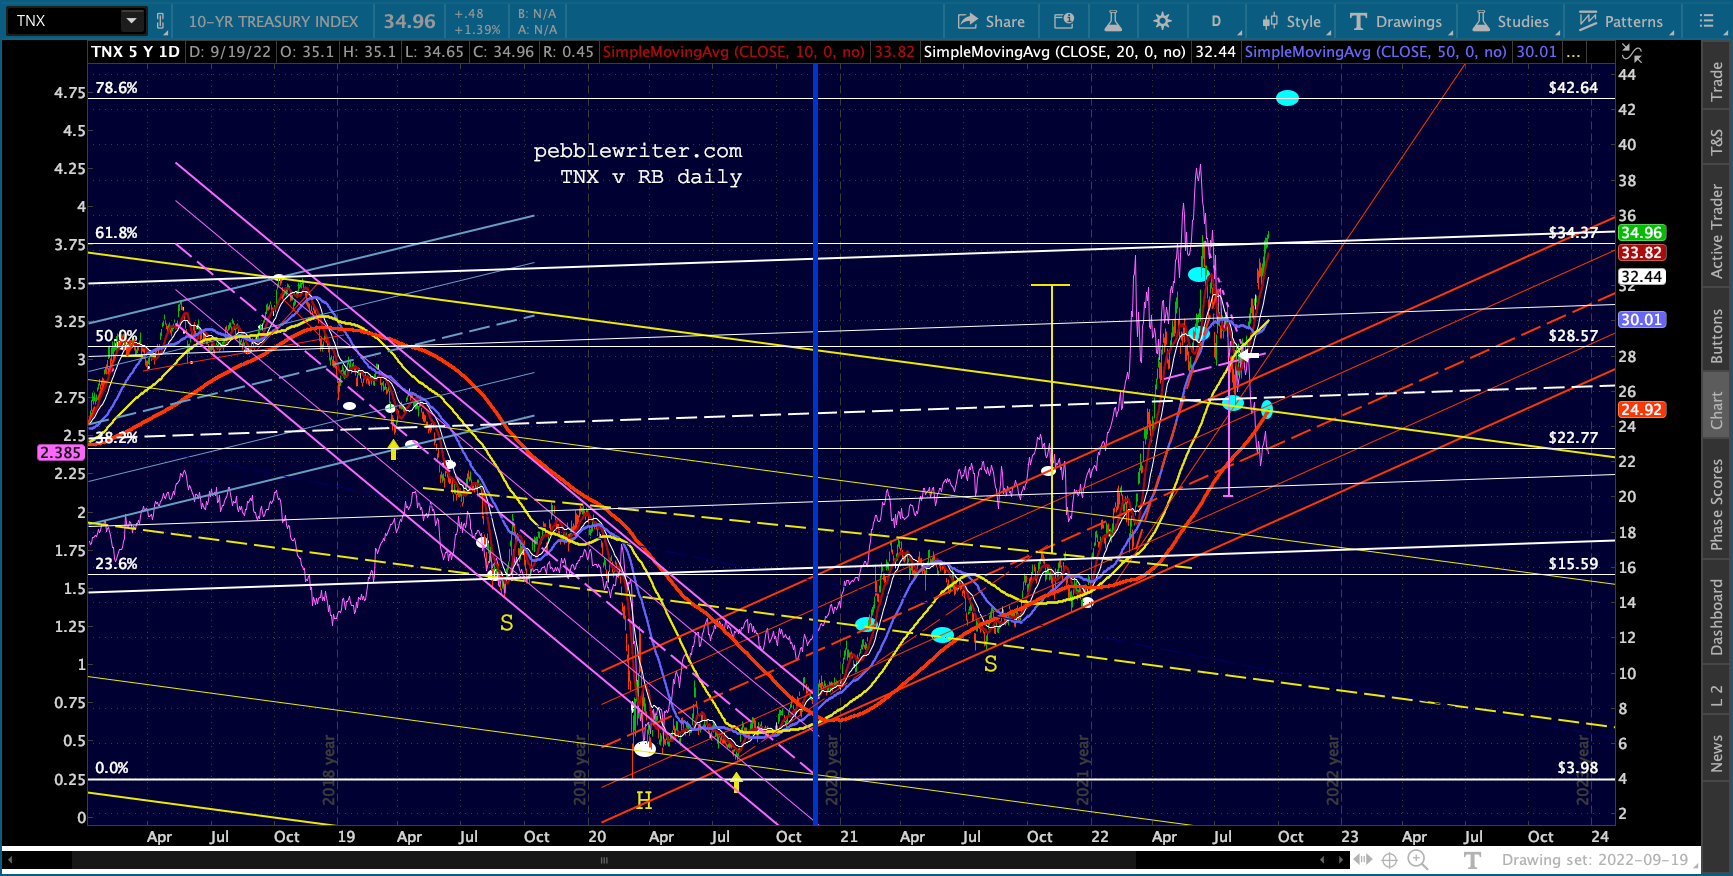
 …which is probably what TNX would need to see in order to decline. Instead, it has pushed to new highs.
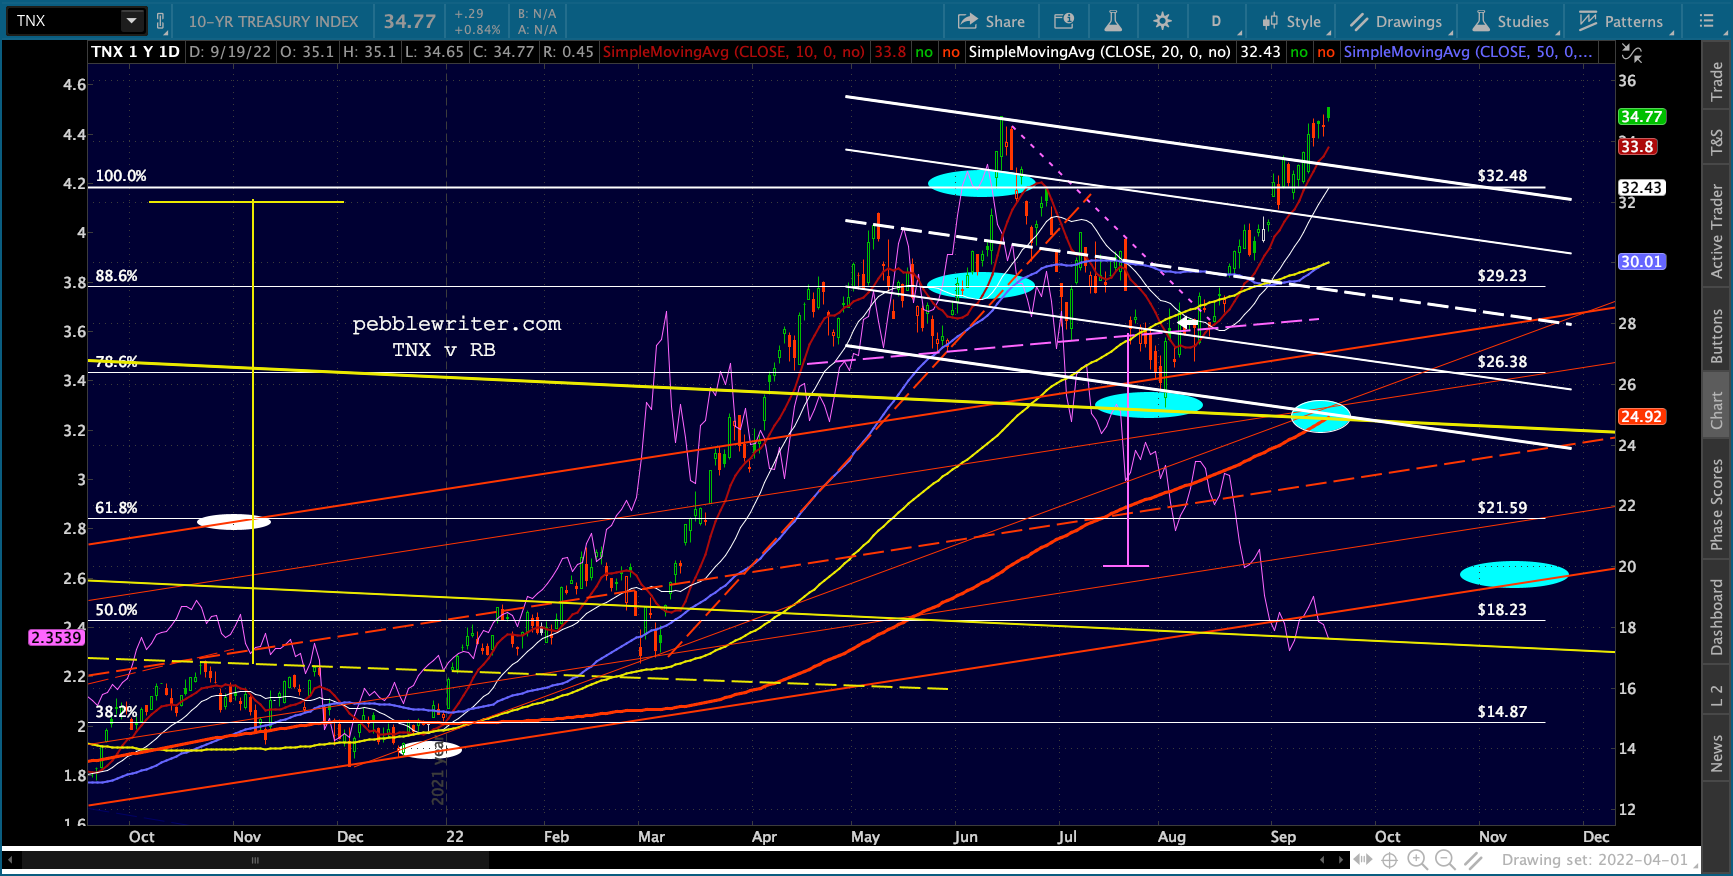 It’s hard to overstate the importance of the 10Y’s move. This is the highest yield since April 2011. With these new highs, we move the Fibonacci grid to the June 2007 highs at 53.16 and note that TNX just took out the .618 Fib at 34.37 again.
 This first happened a few months ago in June, when TNX reversed off the .618 down to a backtest of the broken yellow channel. By moving higher, TNX strongly suggests the .786 at 42.64 is in the cards.