

Several websites I read yesterday referred to stocks’ last minute decline as a “flash crash.” Nothing could be further from the truth.
First, a flash crash shouldn’t apply to a decline that went exactly where it should have and, in fact, was predicted in advance. From yesterday’s post Still Waiting:
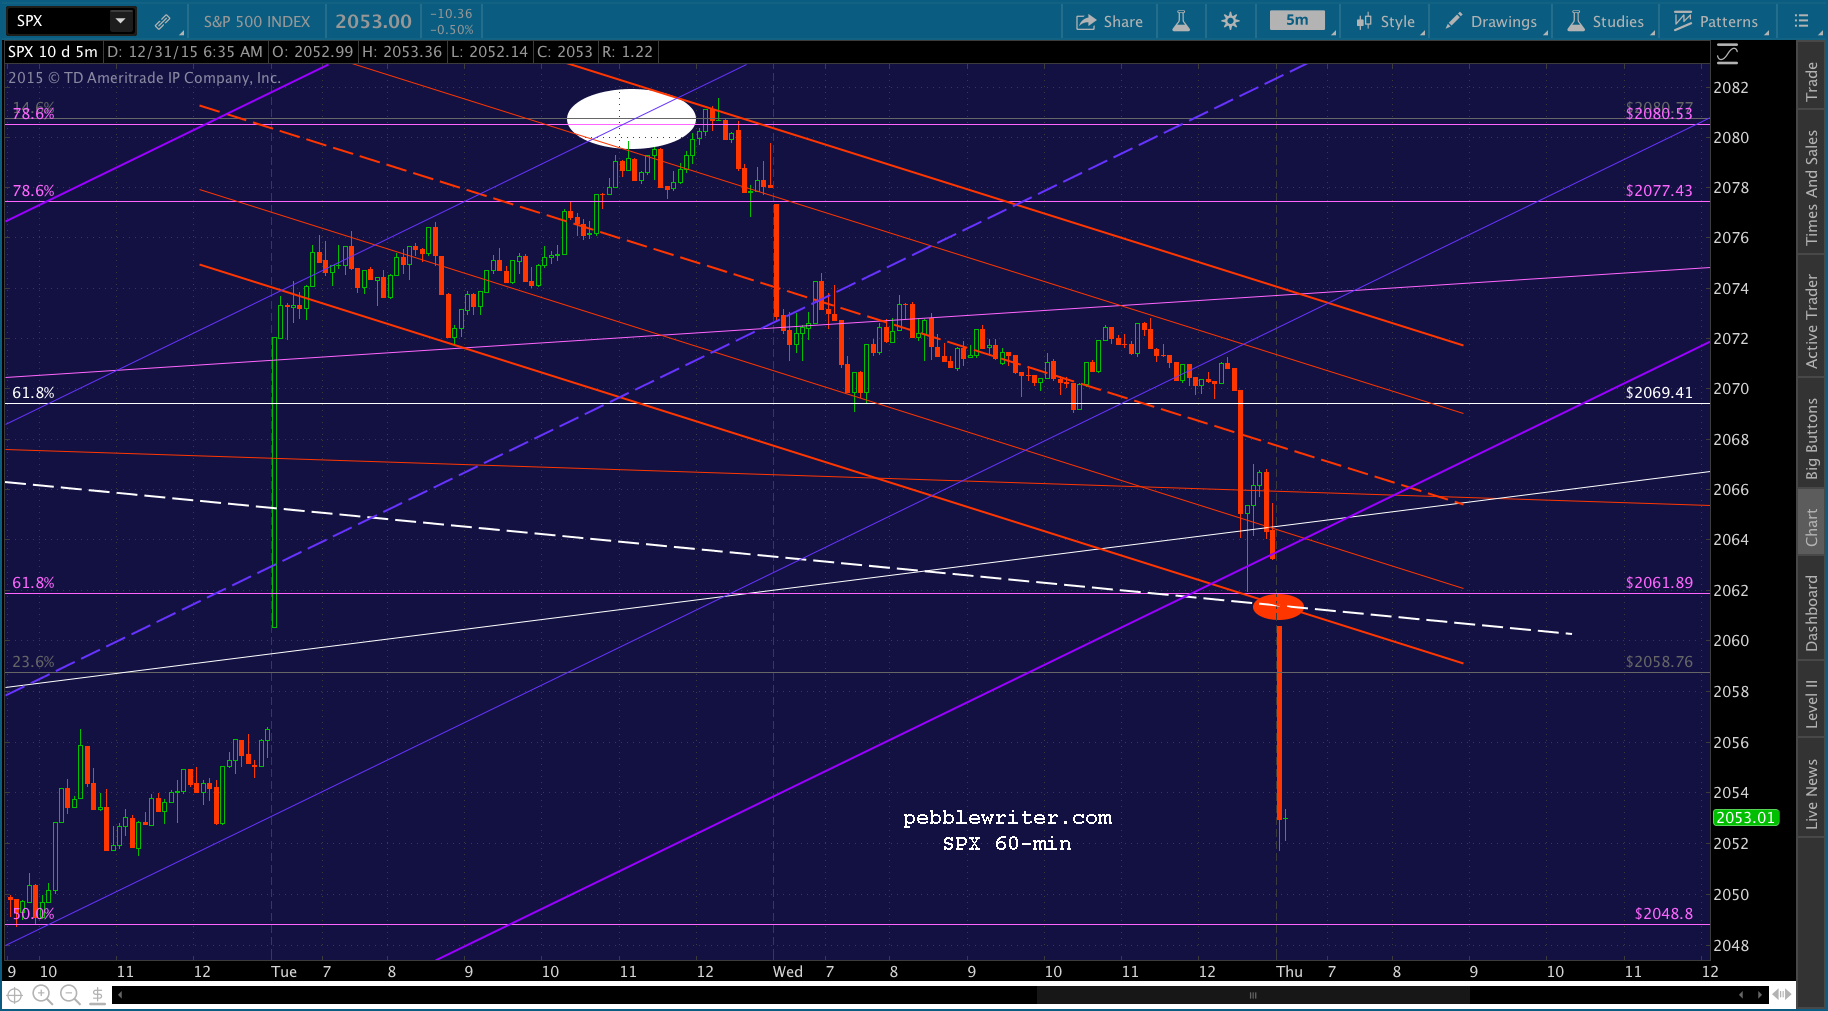
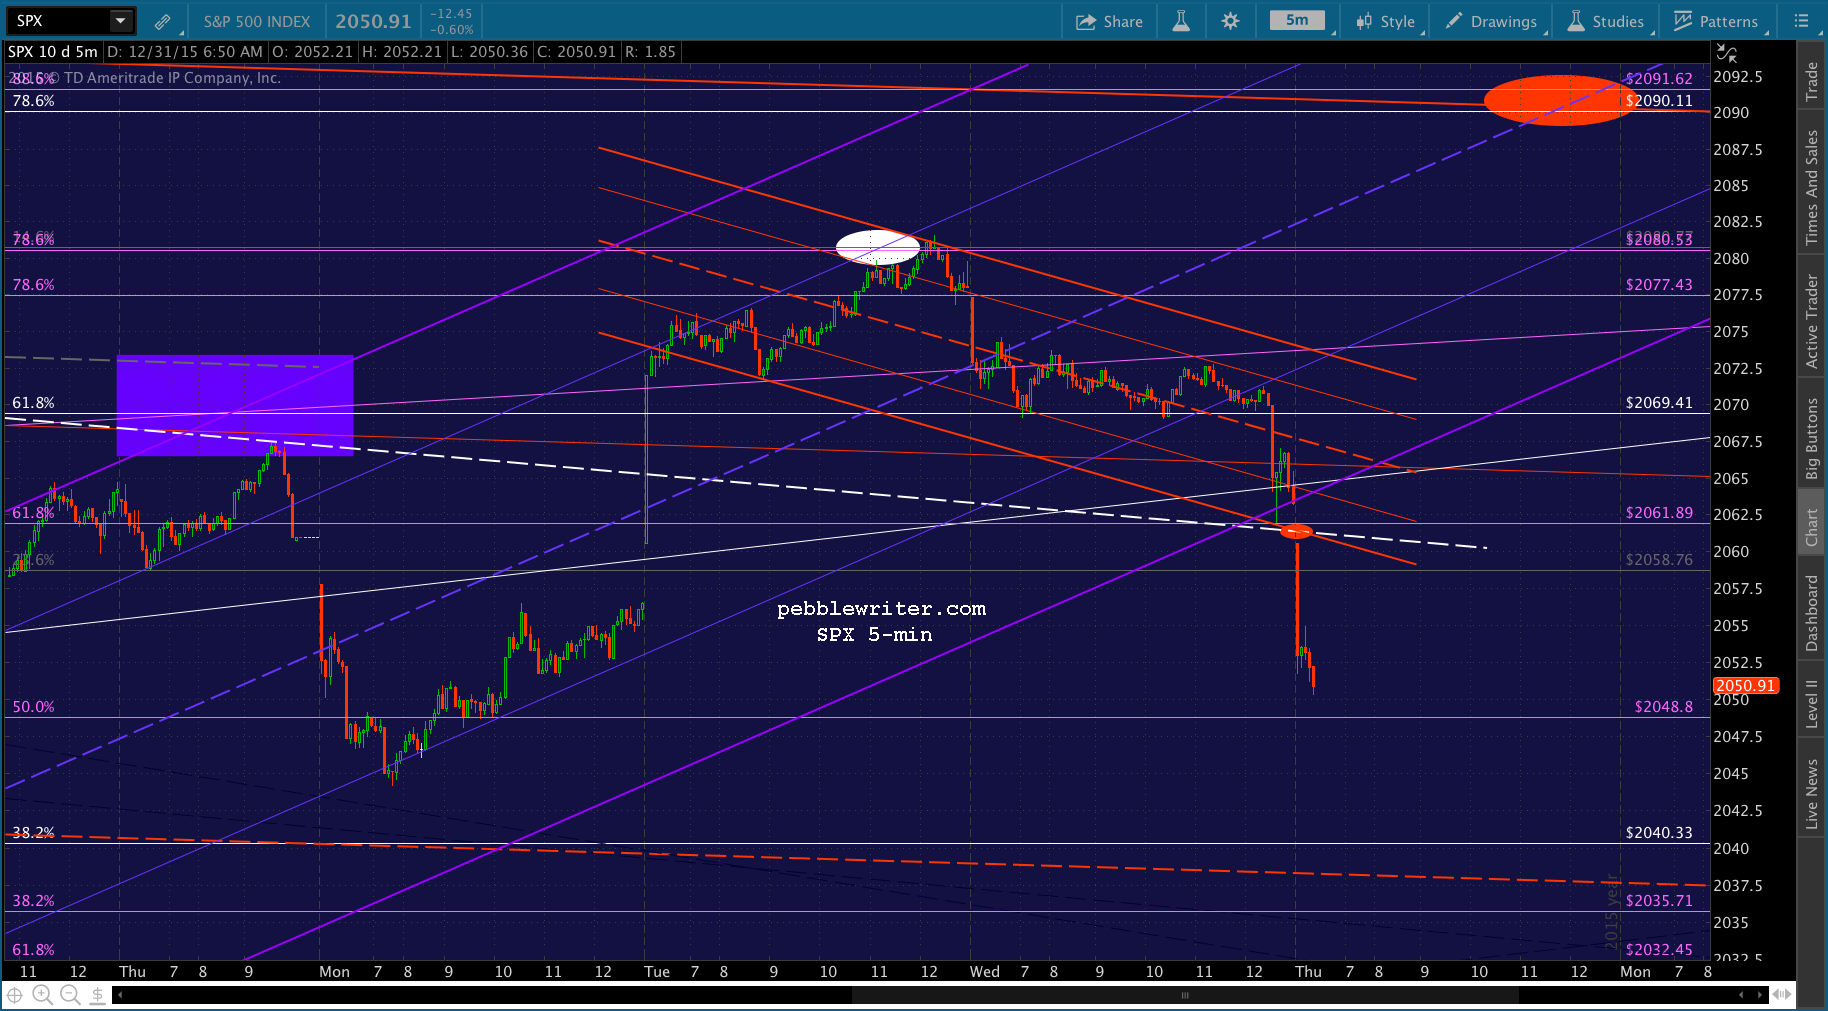
I believe the SMA50 at 2064.65 is the primary target, probably when the 5-min SMA200 crosses it sometime later this morning.
 Second, a decline shouldn’t be referred to as a flash crash if it was planned and carefully executed by mechanisms we’ve been watching play out on a regular basis all year long.
USDJPY — which was ramped higher all day long in order to prop up stocks, dropped through support in the final hour. They could easily have waited until after the close to let it settle lower. For whatever reason, they didn’t. So, the decline happened in the closing minutes. Bottom line, while SPX has failed on several occasions to take advantage of opportunities to break out, it isn’t because it can’t. CL, USDJPY, TNX and EURUSD are still fully capable of forcing stocks higher.
It’s because TPTB have made certain choices that delayed a breakout. The grand plan will be made clear to us muppets when they’re good and ready.
continued for members…
Note that SPX is still nicely contained in the rising purple channel, but could benefit from a slightly lower low in order to fully backtest the white IH&S neckline.
 ES is currently off 7 points, but we should see a rebound after the open. At least, that’s what ES’s daily charts say.

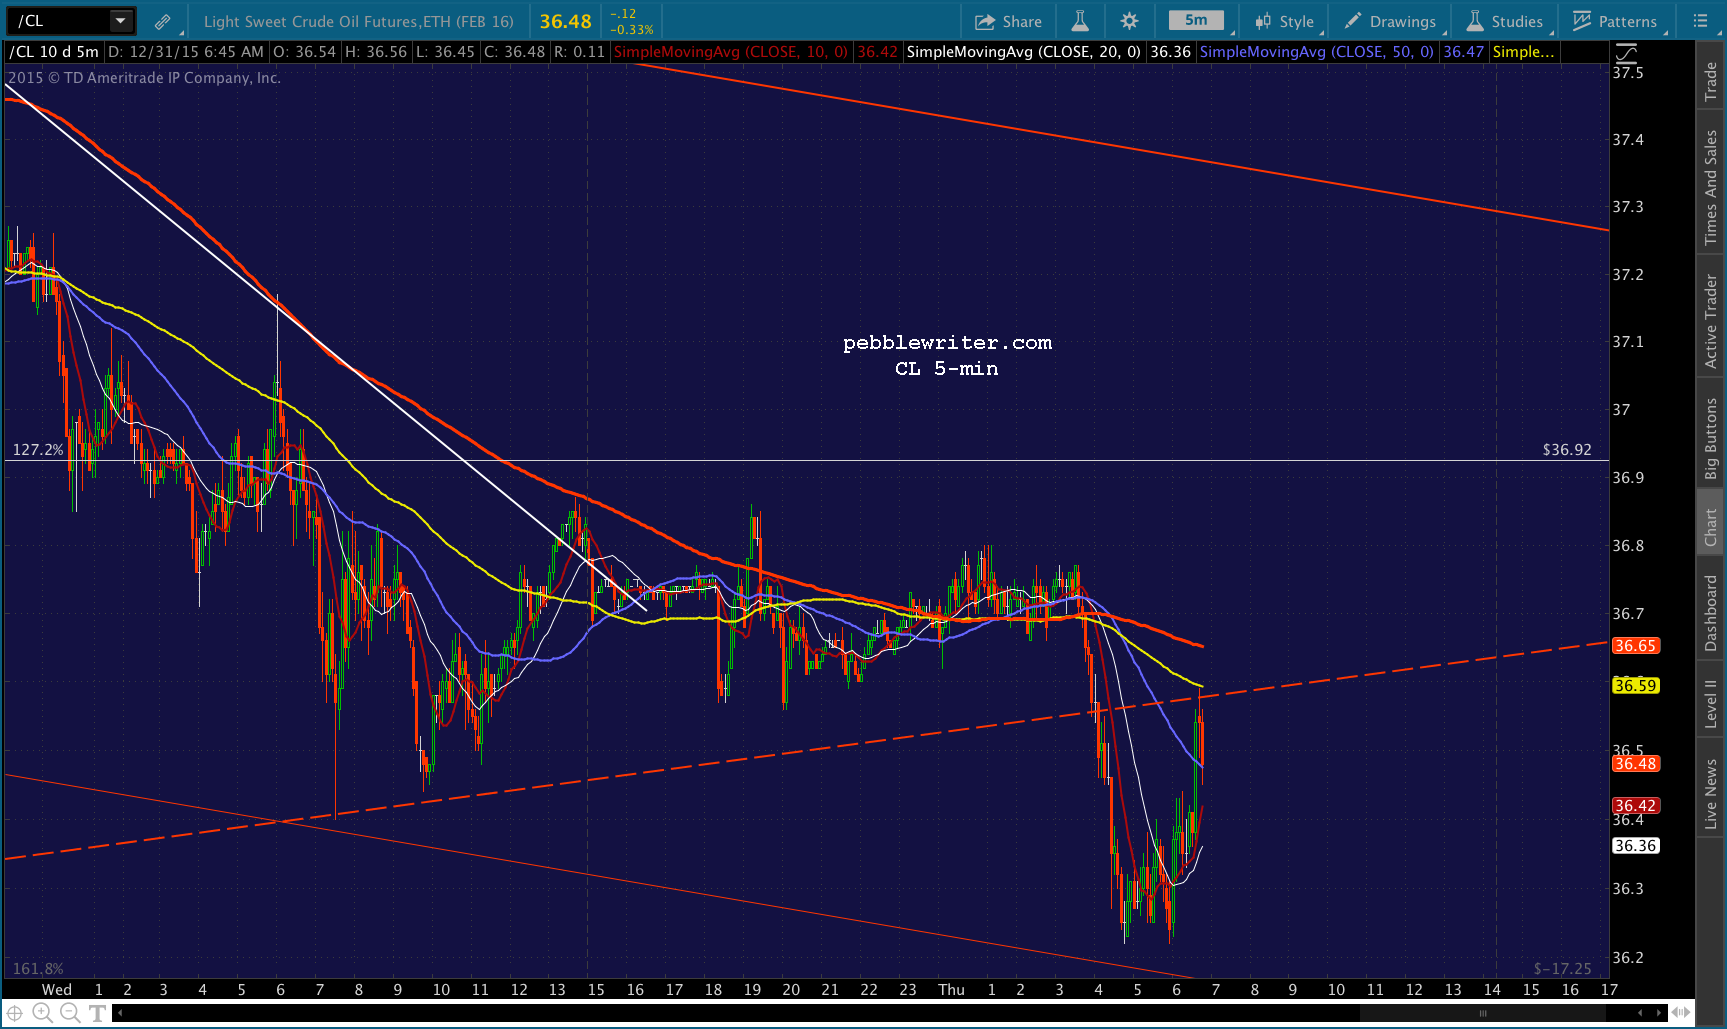
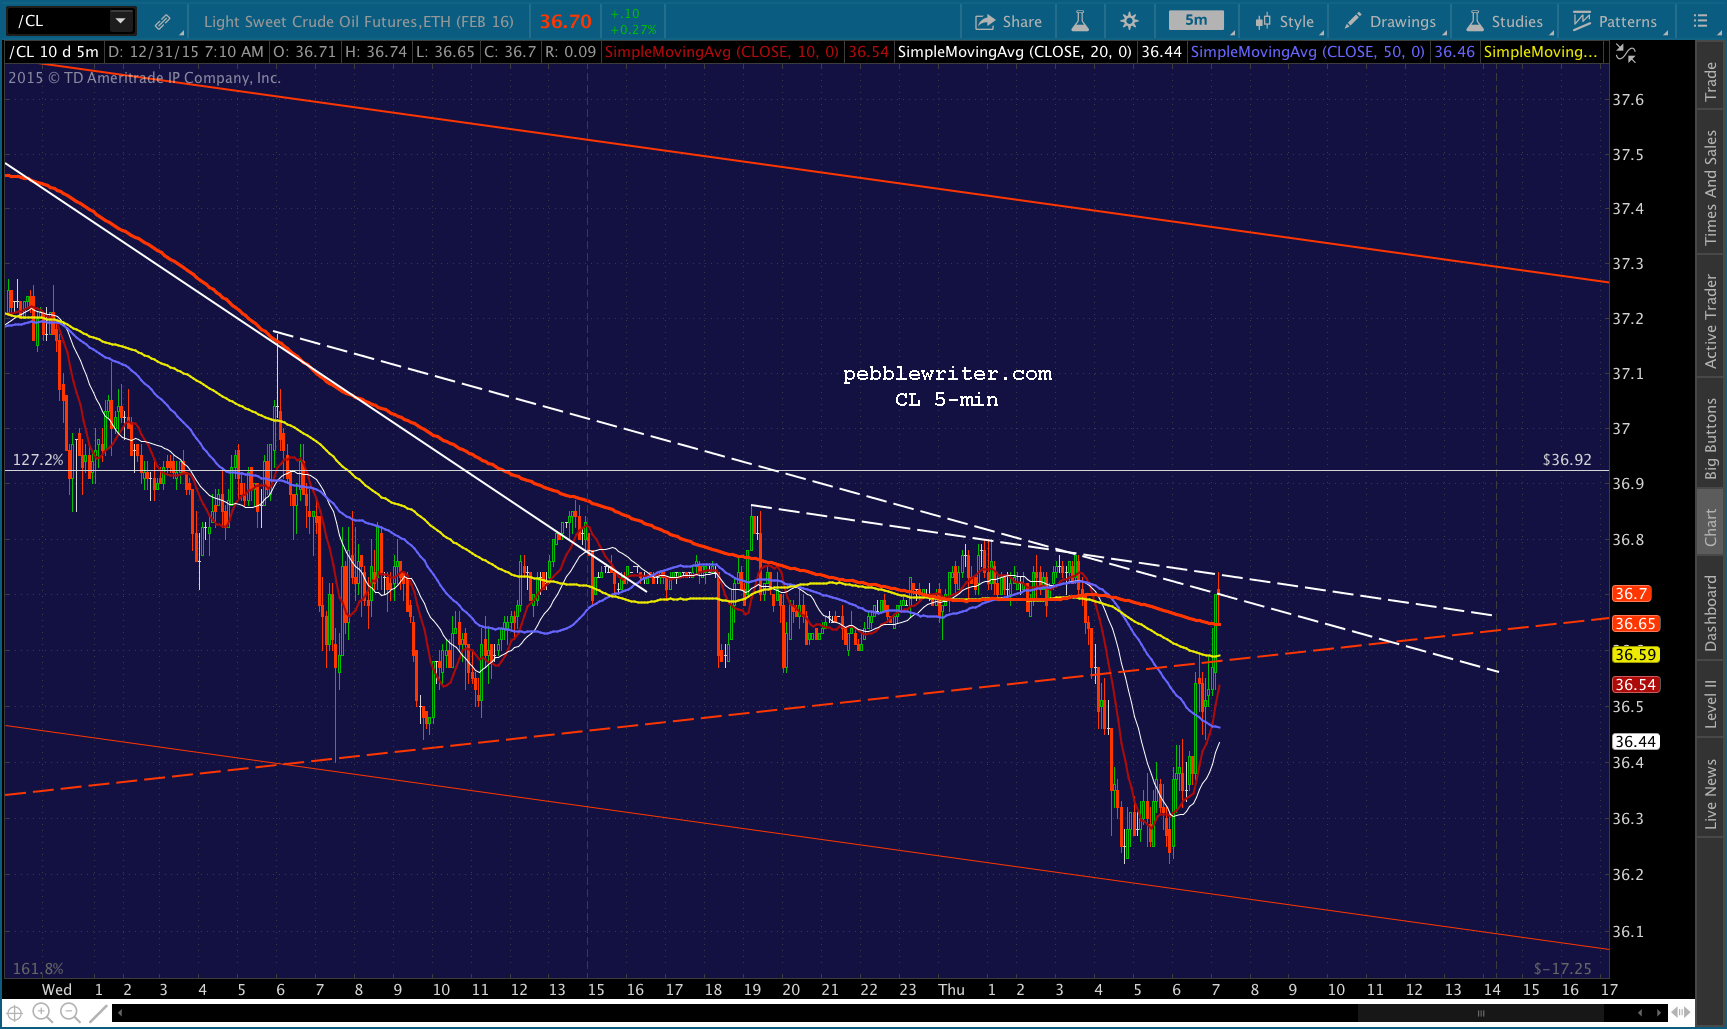
 The problem is that USDJPY and CL broke down below the TLs supporting them all week, backtested those TLs, and have been going sideways ever since.
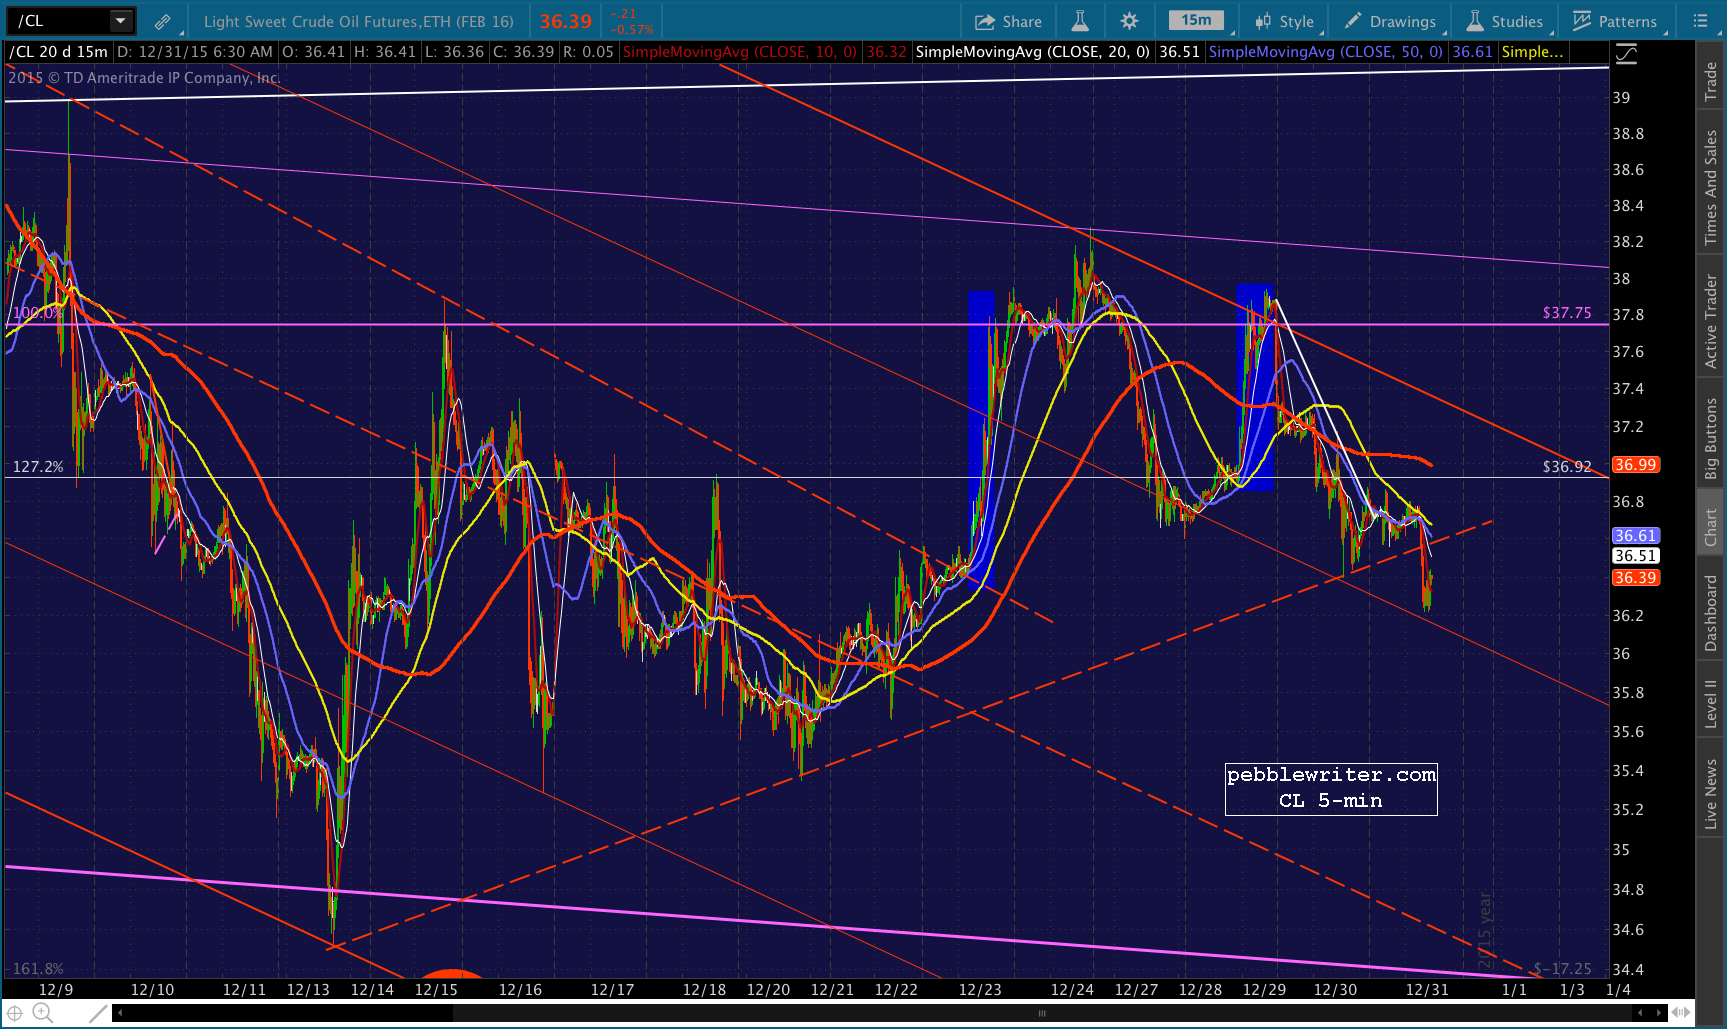 So, we’re left to wonder whether stocks are really breaking down, or whether this is a slickly planned headfake designed to prevent muppets from participating in an after-hours, low-volume holiday ramp job over the weekend. I lean toward the latter.
UPDATE: 9:37 AM
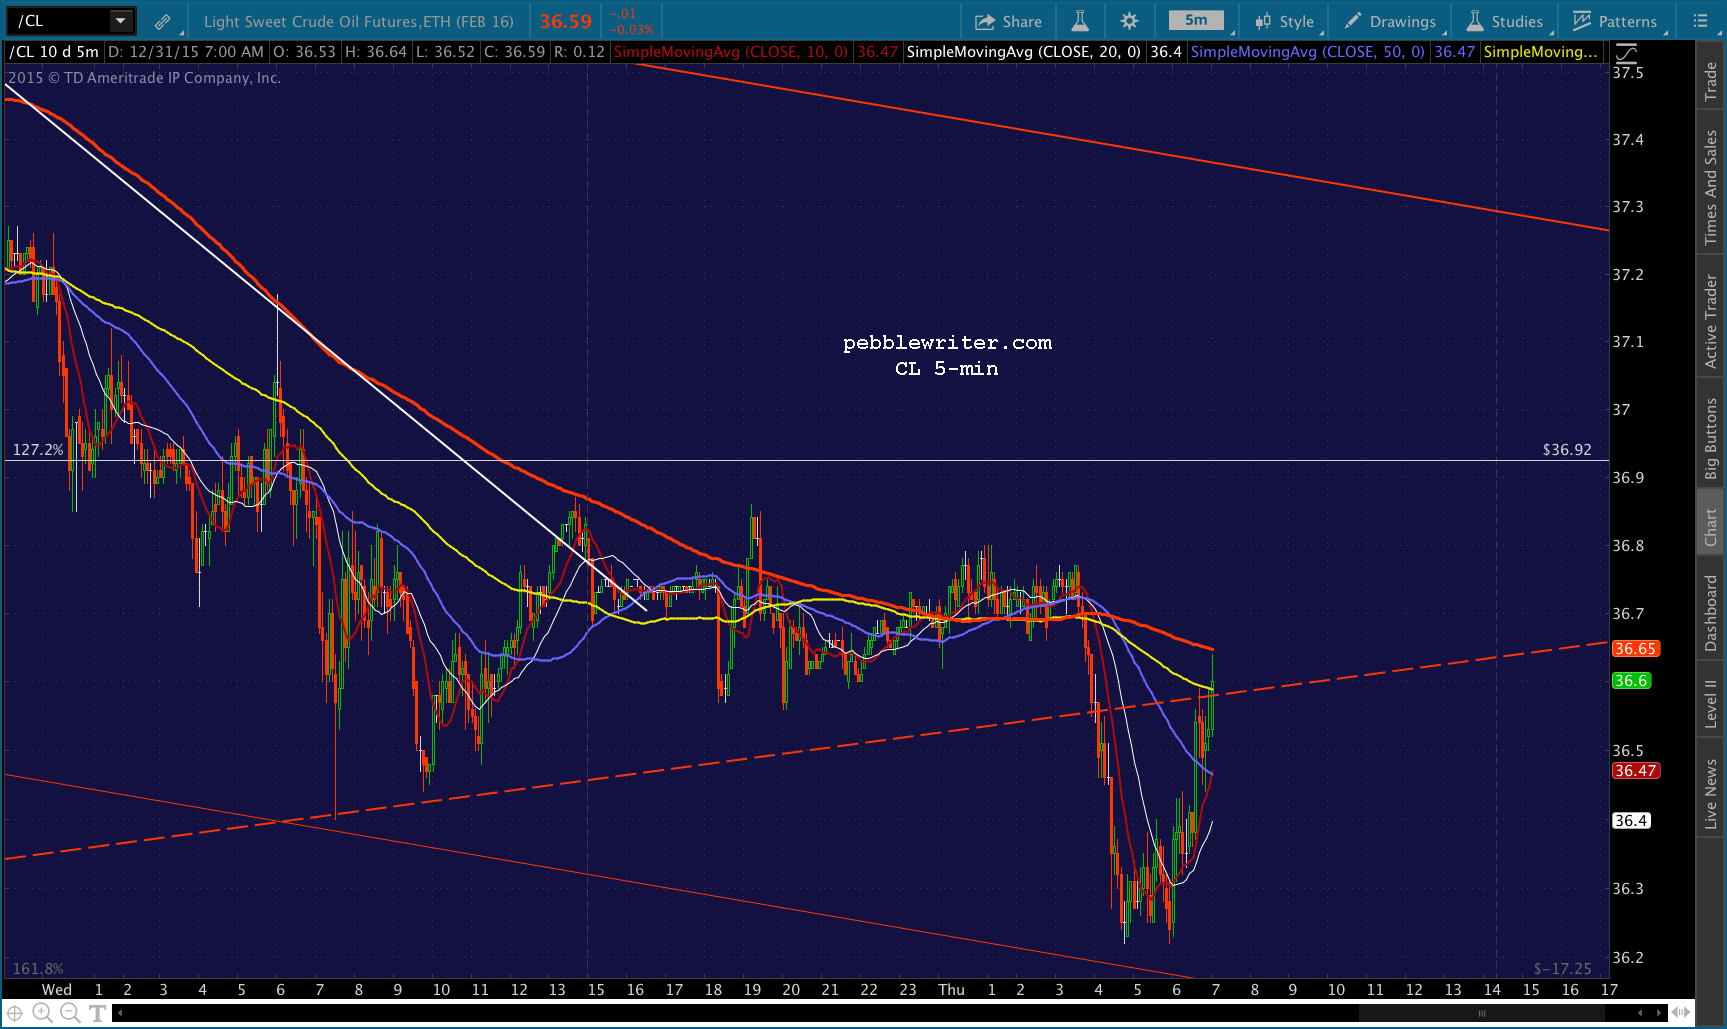
ES has tested the SMA20, and CL is spiking toward the broken red TL. If it breaks through, we should see stocks follow along and recover this initial slide. If it doesn’t then we have to look for more downside targets.
One quick housekeeping note. In the past, I’ve highlighted intraday calls by drawing a blue box around them. But, it takes time. I have to switch into text mode and insert some CSS in two different places. In the end, it’s too time consuming.
Going forward, I’m just going to highlight the relevant text in blue. Hopefully, everyone can see it. And, because it’s so fast and easy, I should be able to be more consistent.
I’d try a long position here at 2053.01 with a target of 2062 and tight stops. Hard support is at the .500 Fib at 2048.80, but I wouldn’t wait that long. I’d keep an eye on CL as it approaches the TL.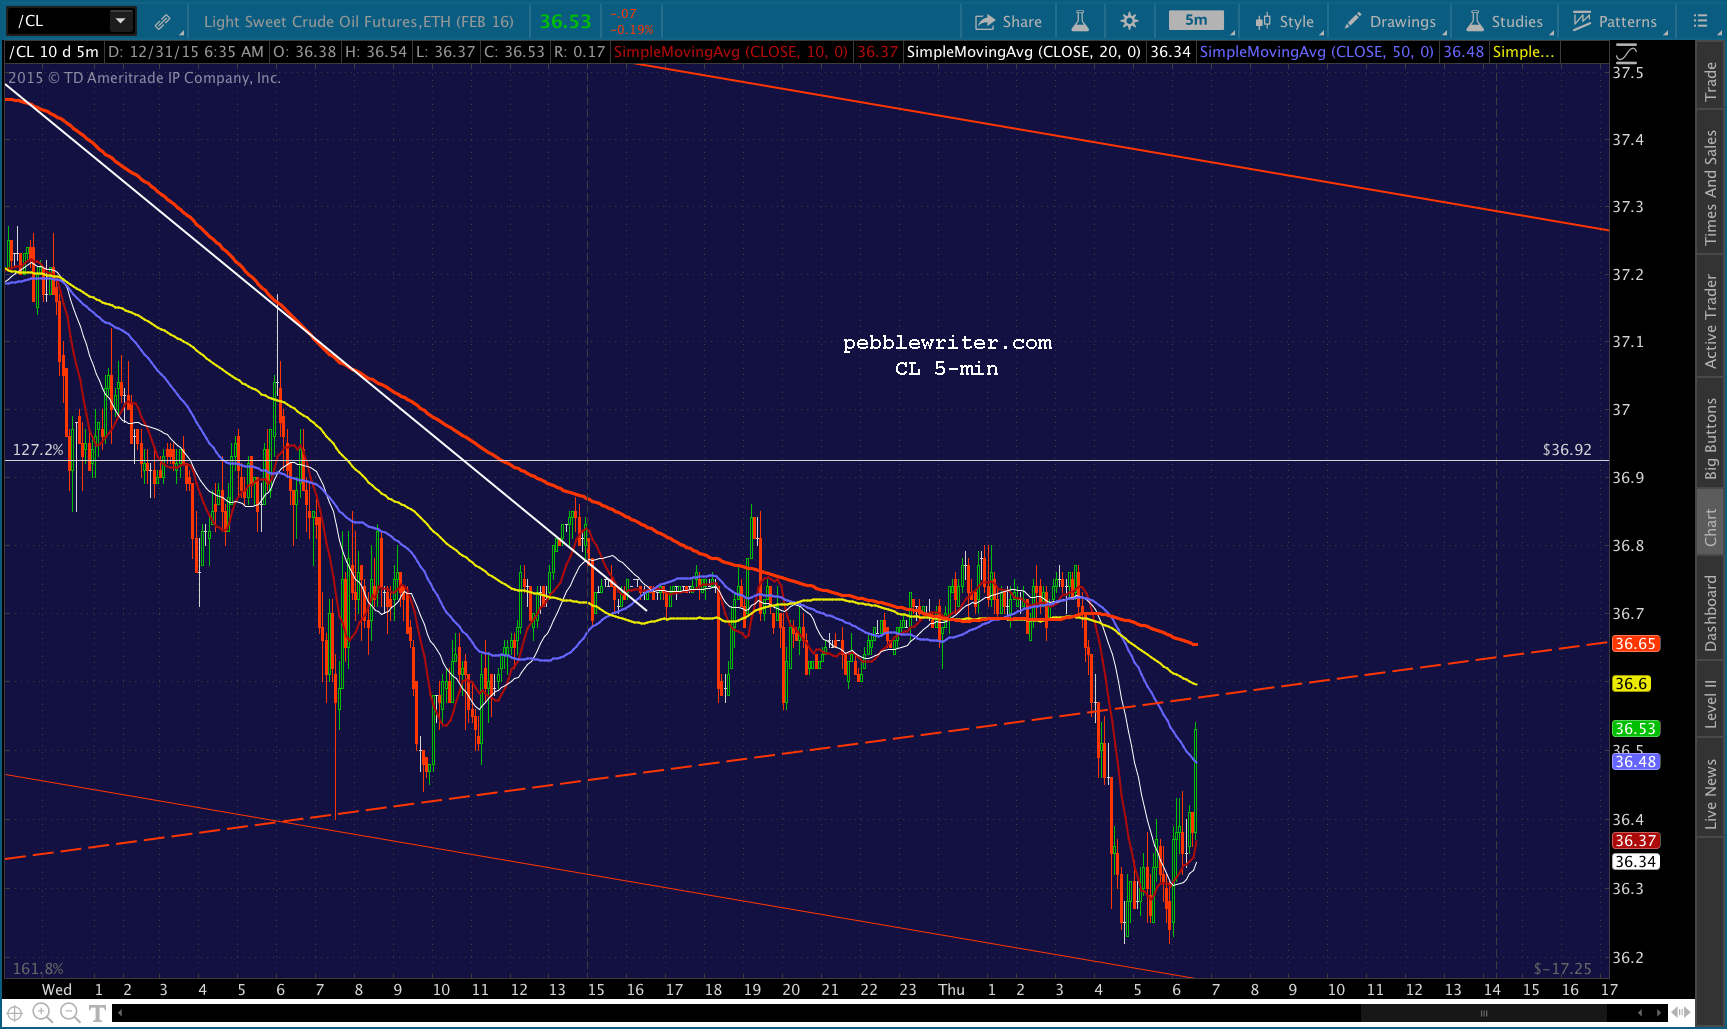
 UPDATE: 9:46 AM
CL isn’t pushing through the TL, and USDJPY is threatening to drop through horizontal suupport. I’d close the long position here and go to cash until we get some upward momentum in either one.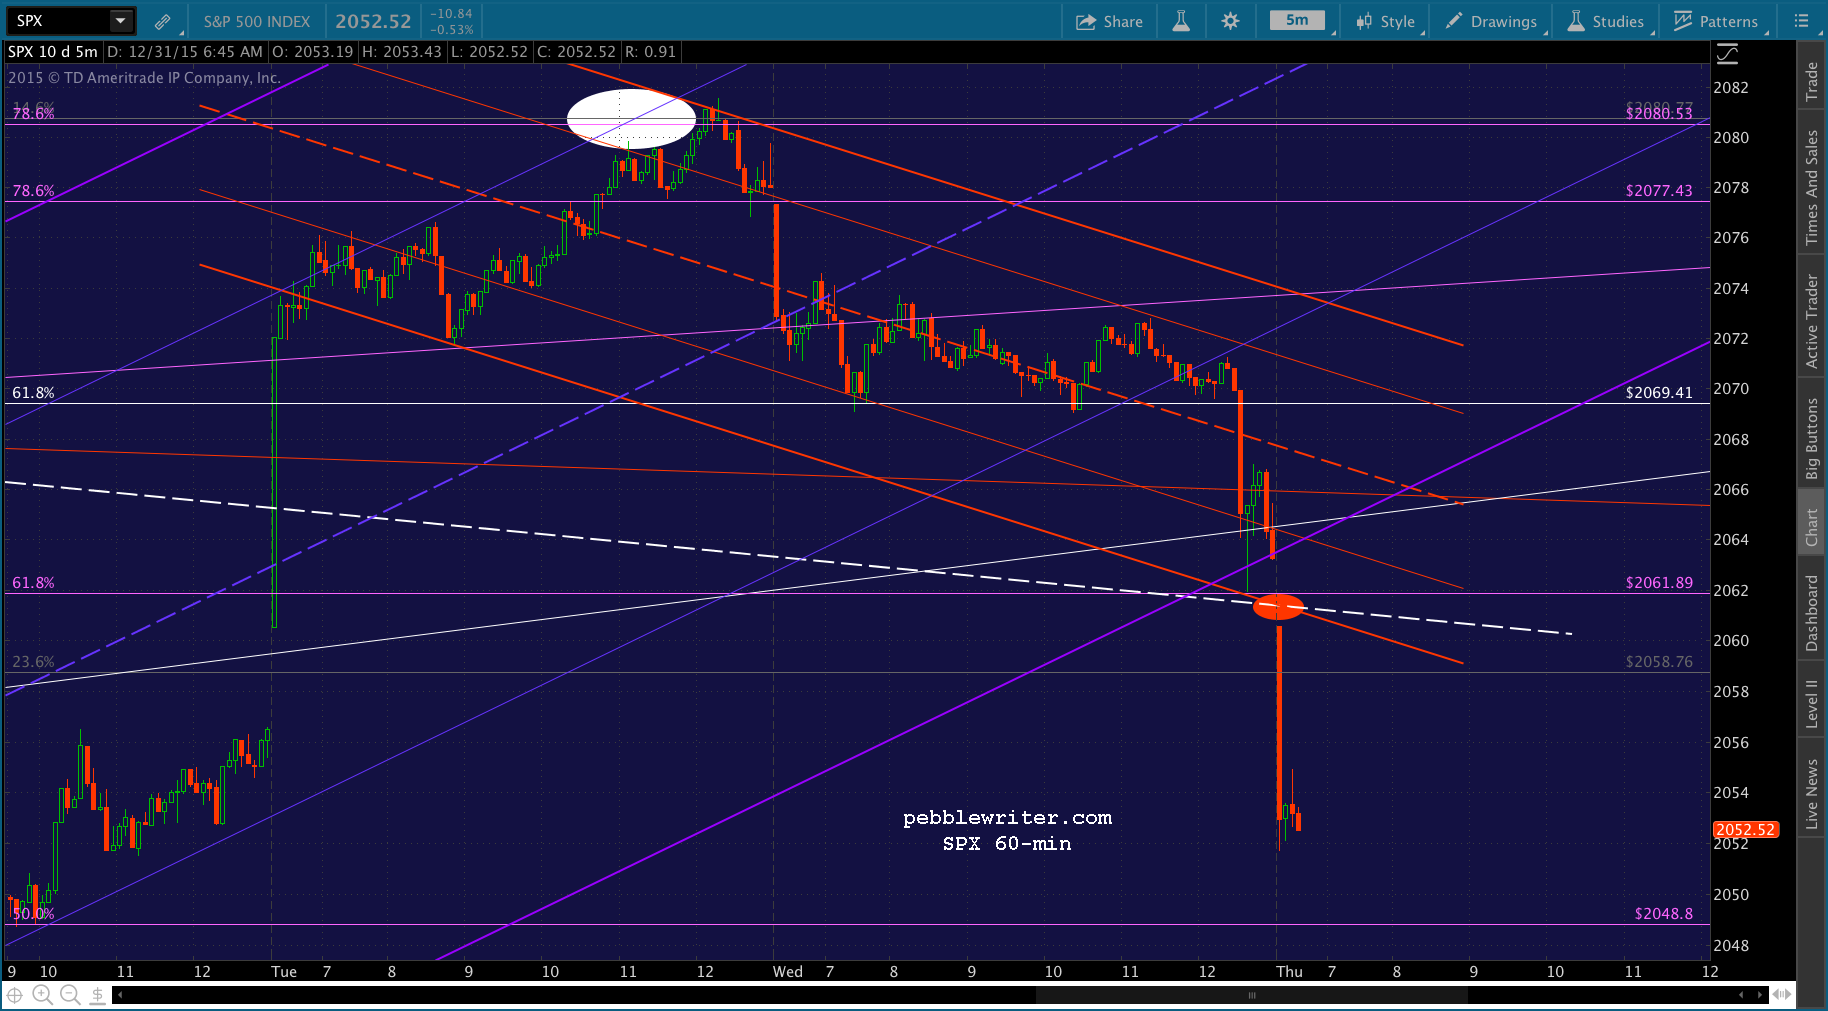

 If USDJPY breaks below that TL, we’ll have to consider shorting.
UPDATE: 9:52 AM
USDJPY just broke down, but SPX isn’t reacting much – perhaps because CL is strengthening again. Not really enough room to short with the .500 just below at 2048.80. We’ll evaluate a long position there at 2048.80.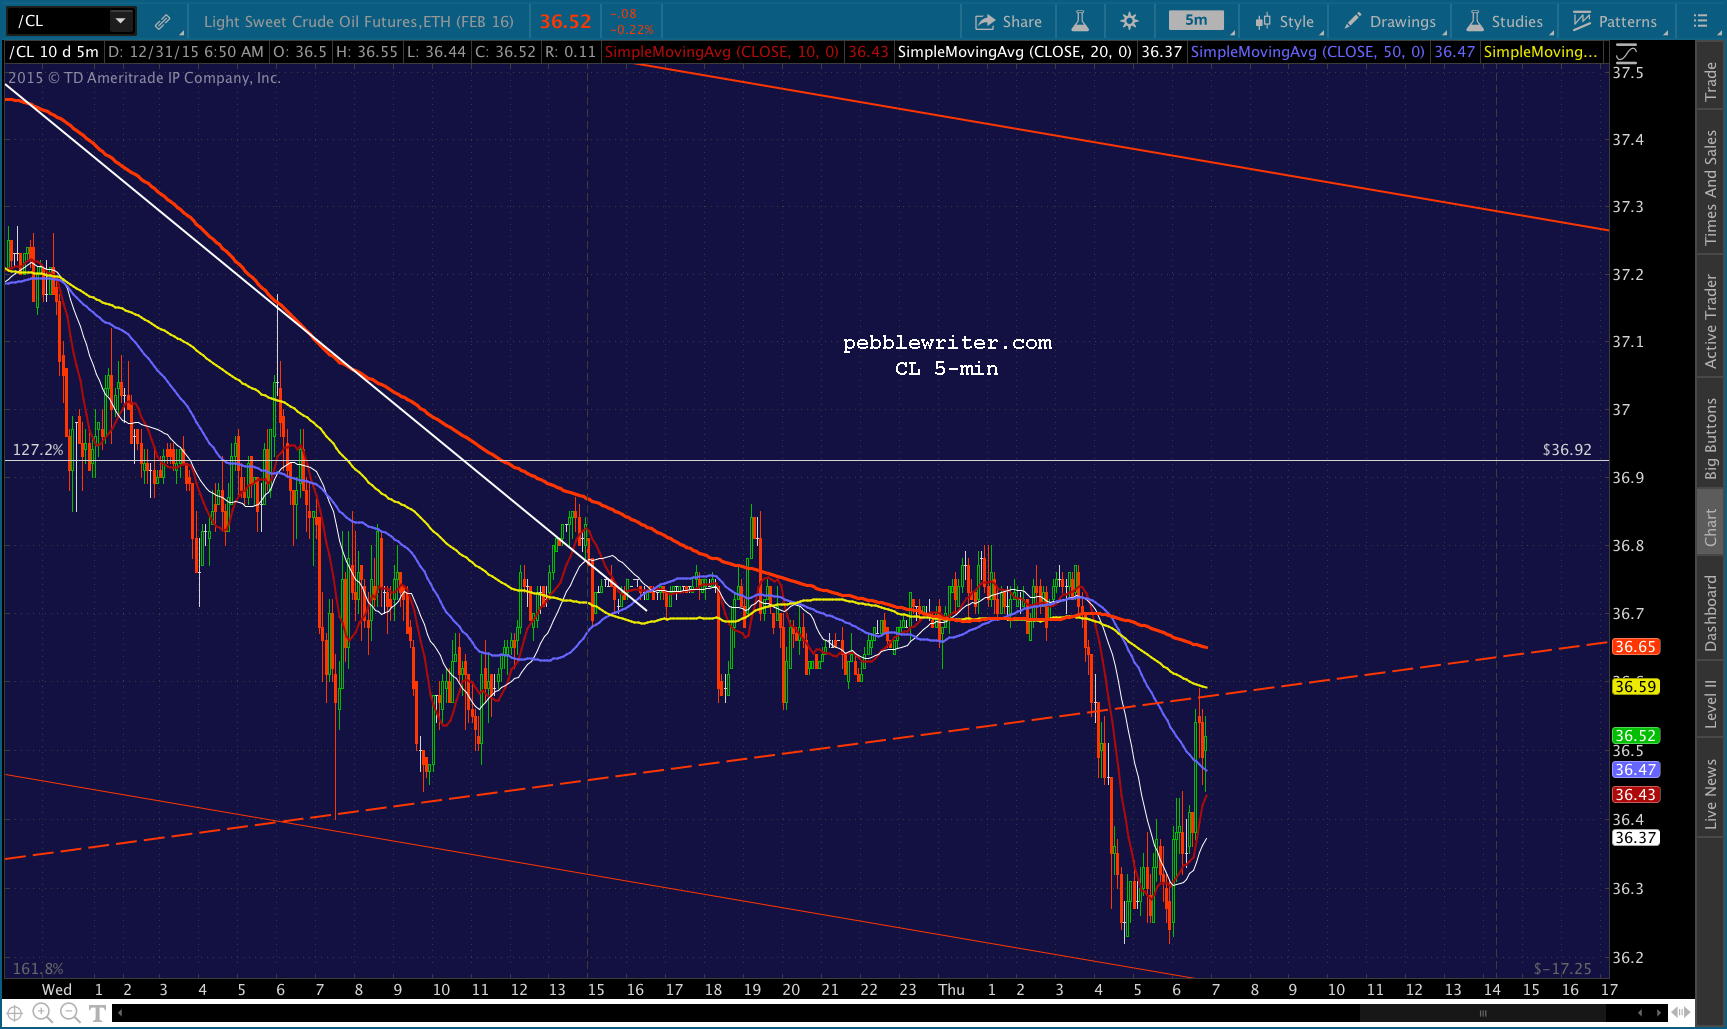
 UPDATE: 9:59 AM
Note that SPX just tagged its SMA20 as well (2050.36 v 2050.84.) I would go back to long here with the SMA20 as our stop, but I’d want to see CL punch through the TL first.
 UPDATE: 10:09 AM
CL is punching through, but USDJPY is dropping like a rock. All those long dollar trades unwinding? In any case, I can’t go long until USDJPY reverses — which at this rate might not be until the white .886 at 120.2 or even the yellow .618 at 120.11.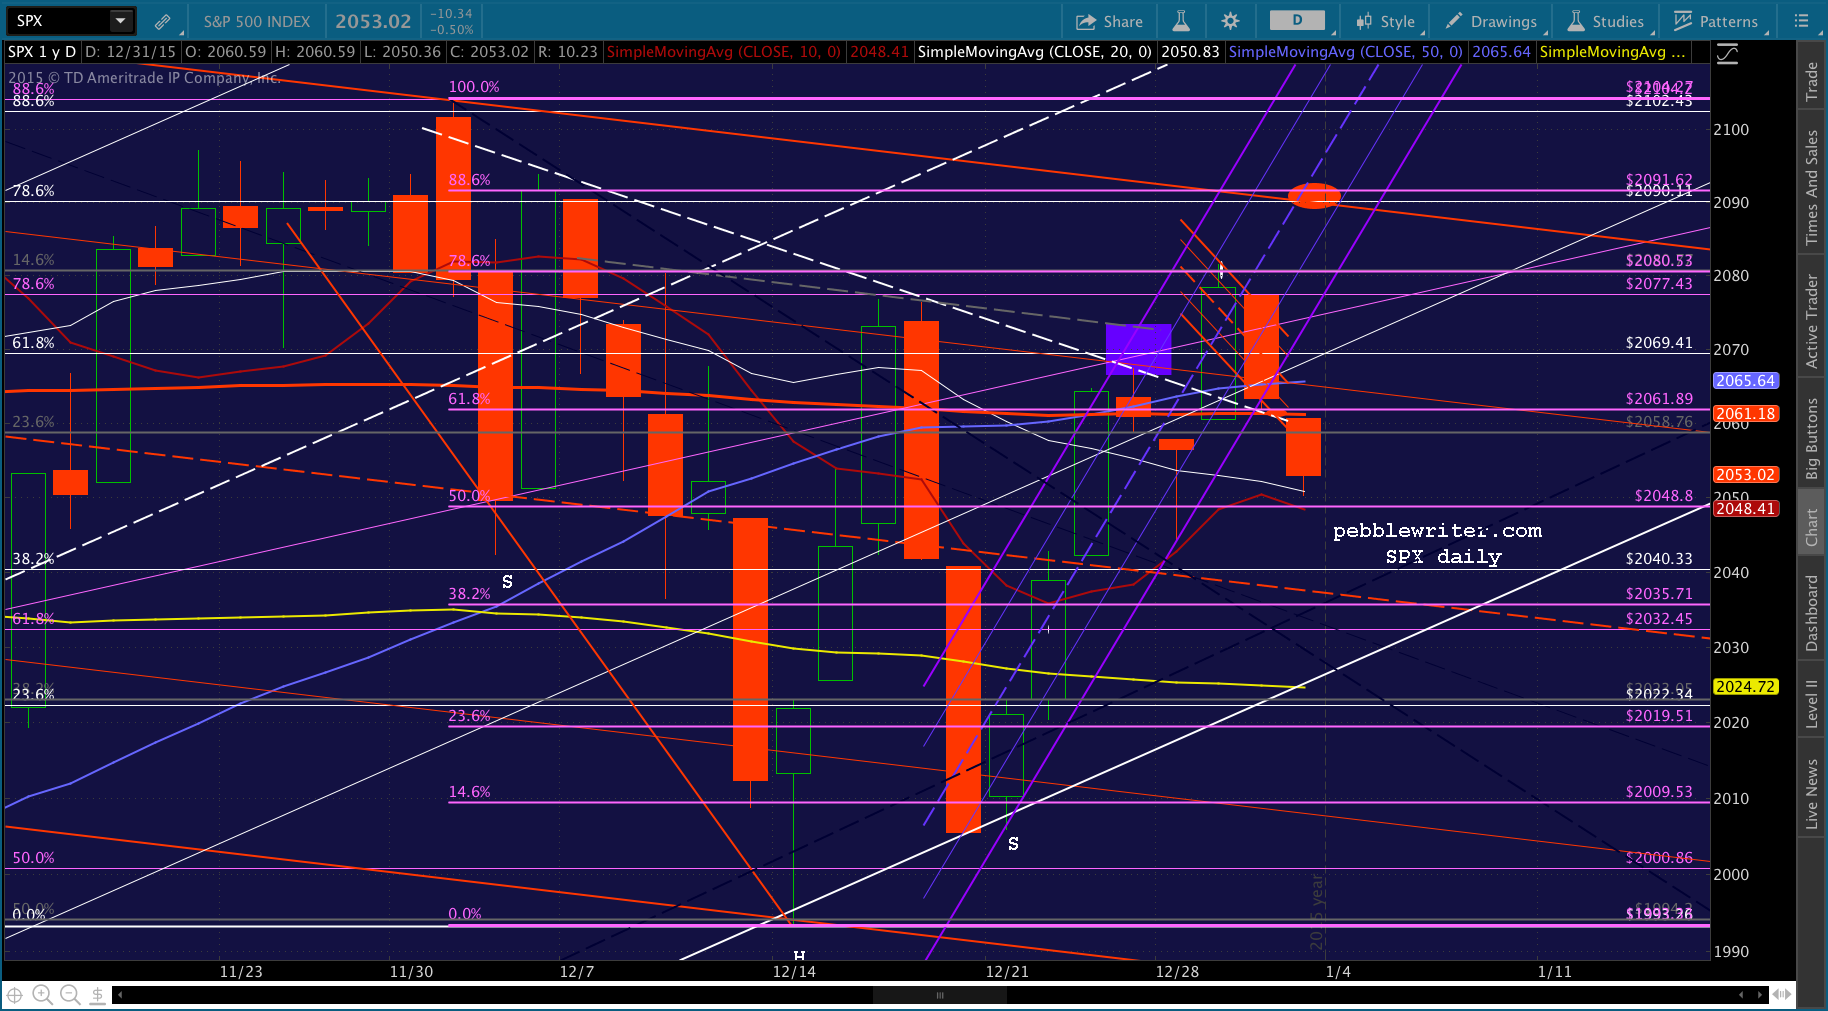
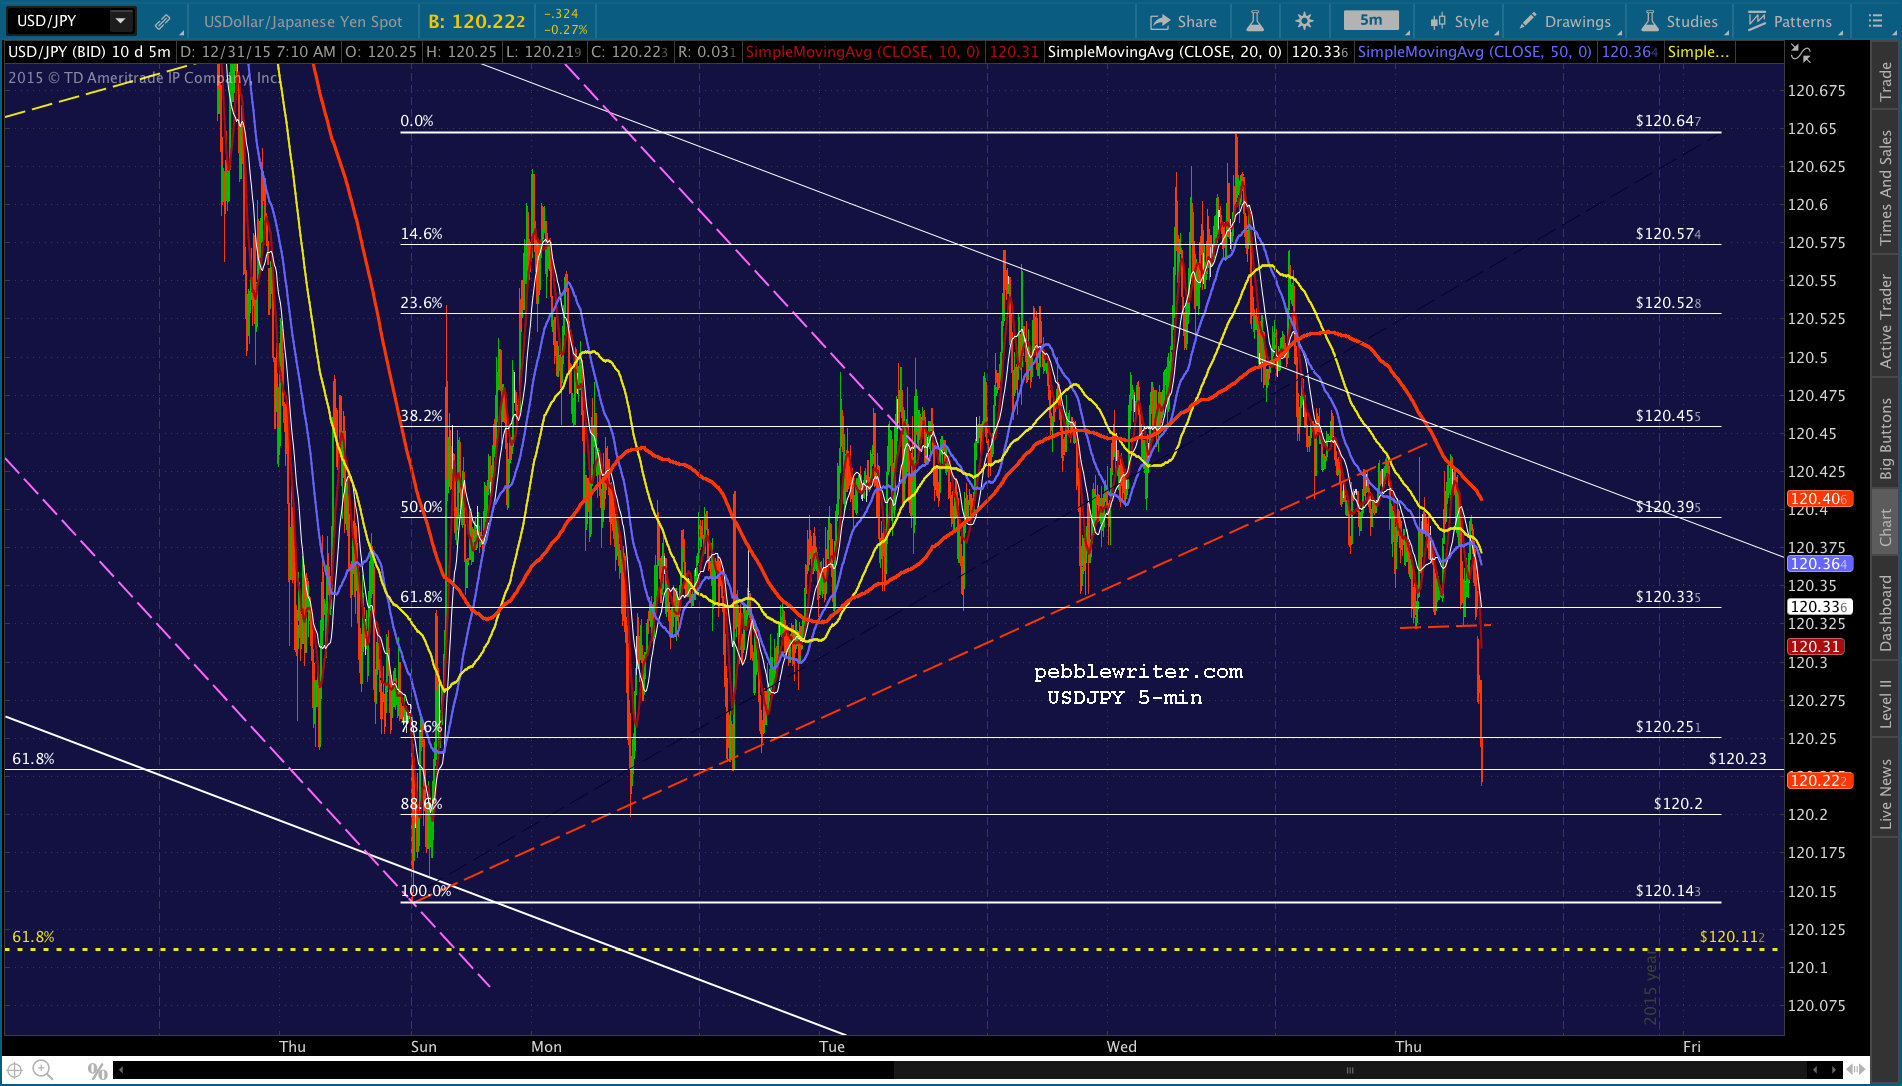
 Yesterday, we spent almost all day waiting for SPX to break down through obvious support. Today feels like the opposite — as though it’s being deliberately suppressed. And, just as I finished typing those words, USDJPY plummeted through 120.11 — the most important Fib on any chart in my world.
 If it is being deliberately suppressed, then this would be a bear trap and would be followed by a big rally up through resistance by Monday. If it’s not, then I’m clearly leaving money on the table. The next downside support isn’t until the white .382 at 2040, followed by the red Flag Pattern midline at 2037ish and purple .618 at 2035.71.
I’d love to get some of that, but I’m not sure it’s worth taking the chance. And, if it’s anything like yesterday, it could take hours before the final denouement. Cash seems like a good place to be at the moment given the weirdness of this situation.
We’re up 19% for the month, and I’m more than satisfied with that. I have some very cool charts I’d like to get posted dealing with the very big picture — going back to the 1930s. If you’ll indulge me, I’m going to set some alerts in case SPX comes roaring back, and focus on getting those other charts posted this morning.