

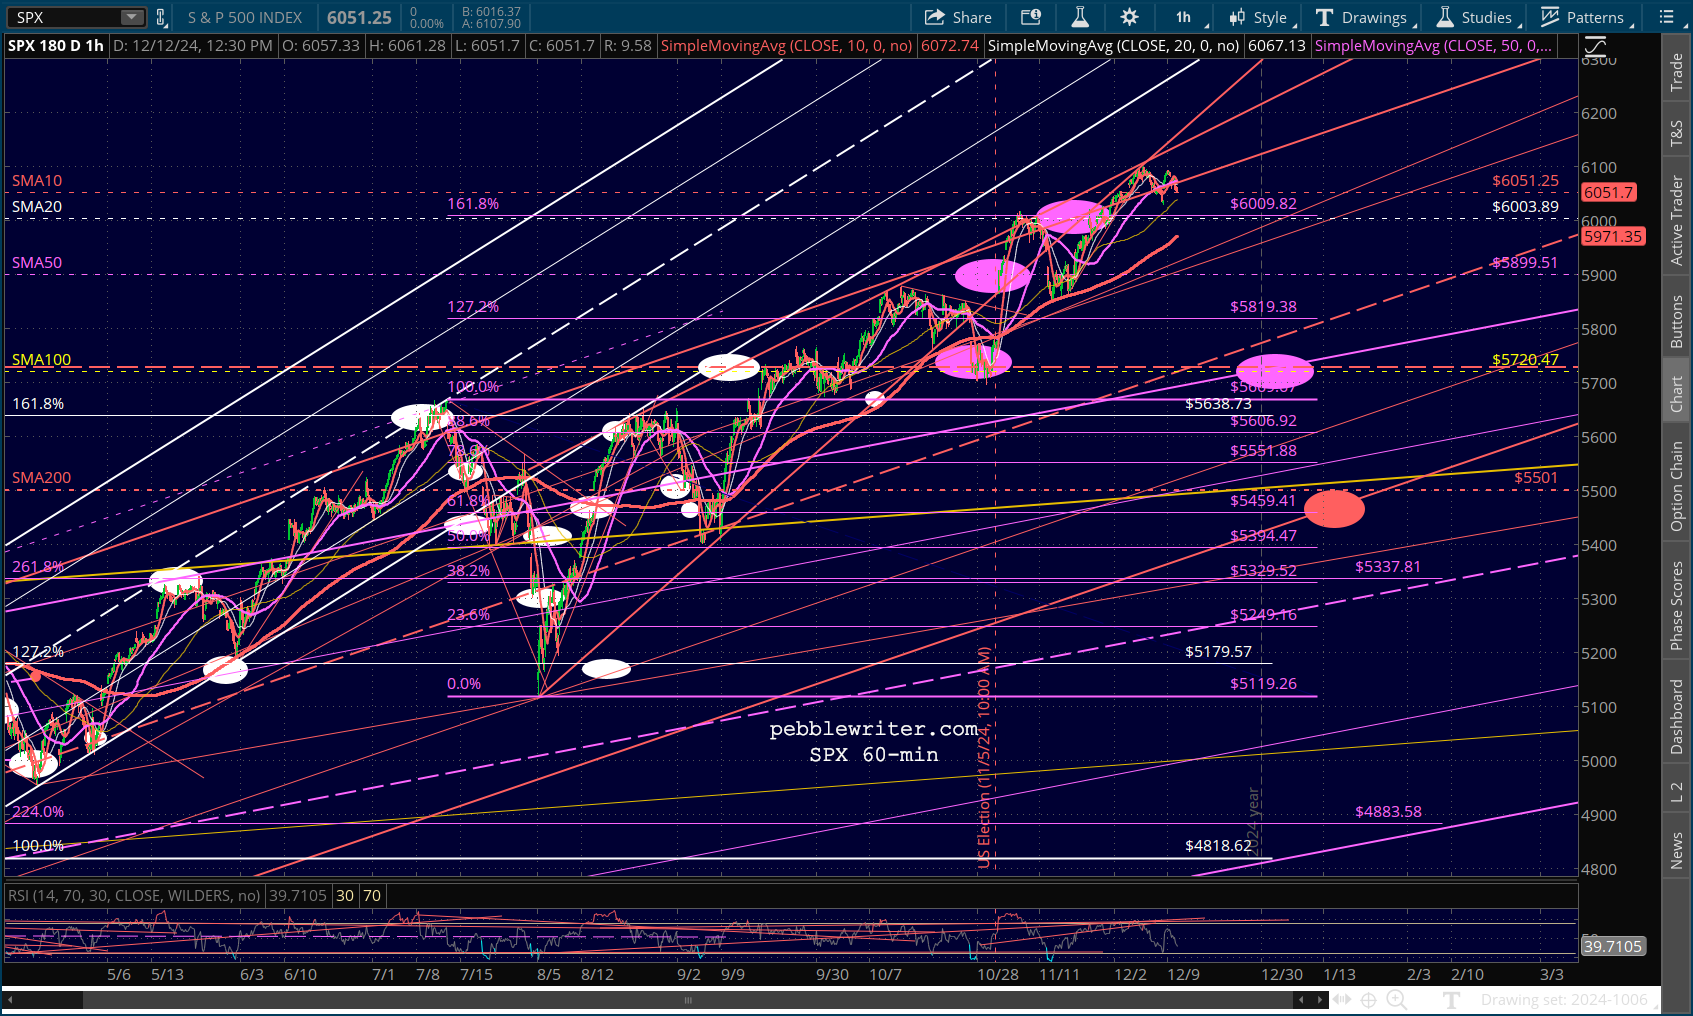
Futures are up modestly after yesterday’s slide. The advance comes with an asterisk, though, as breadth continues to decline and interest rates continue to climb.
 continued for members…
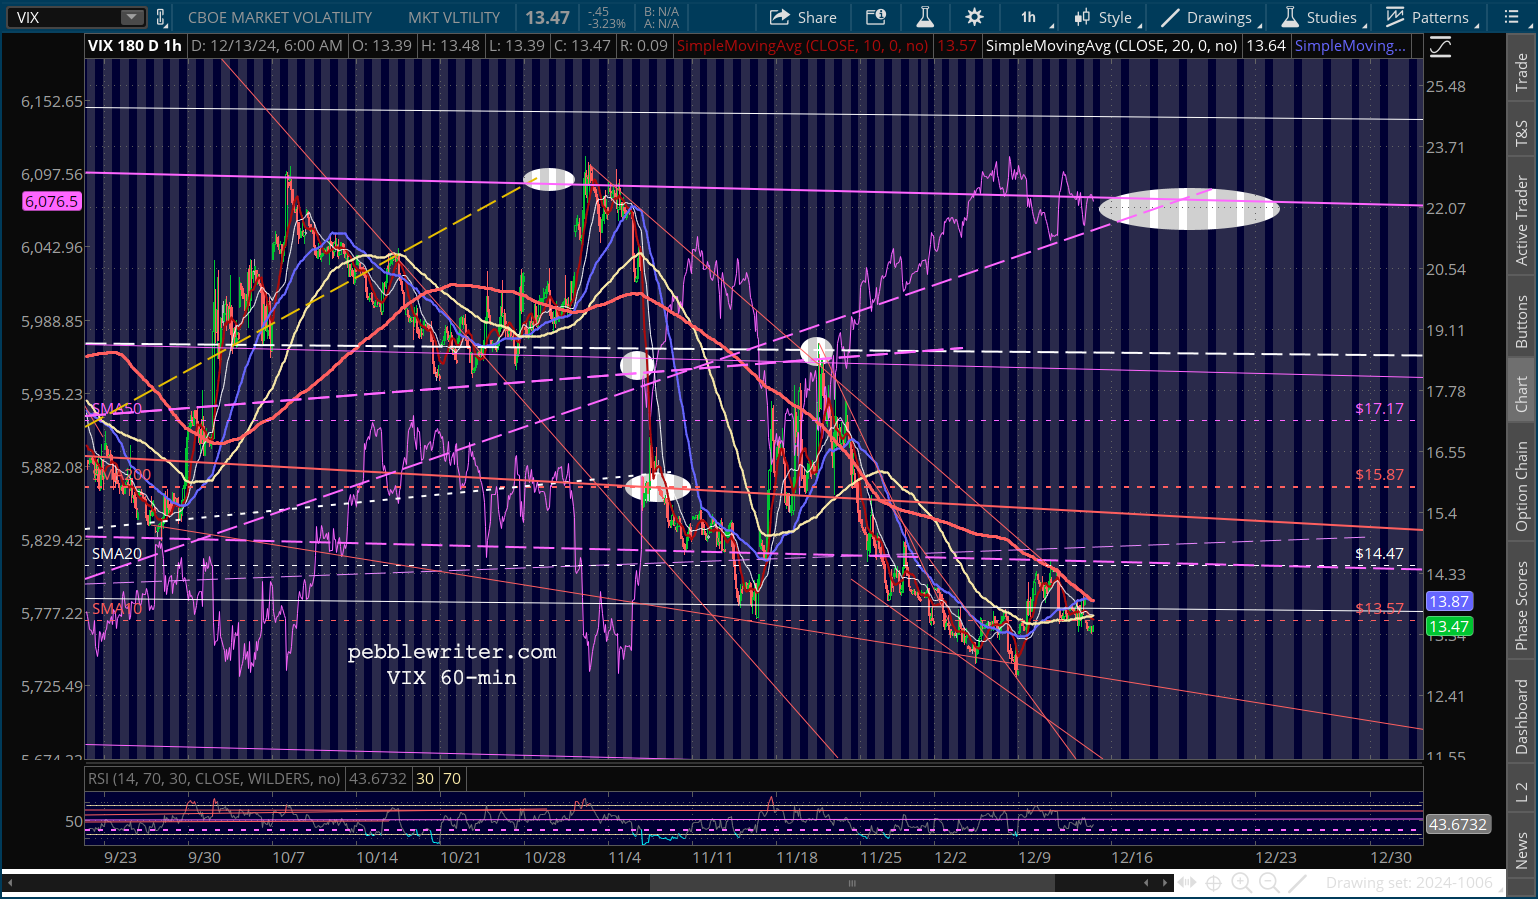
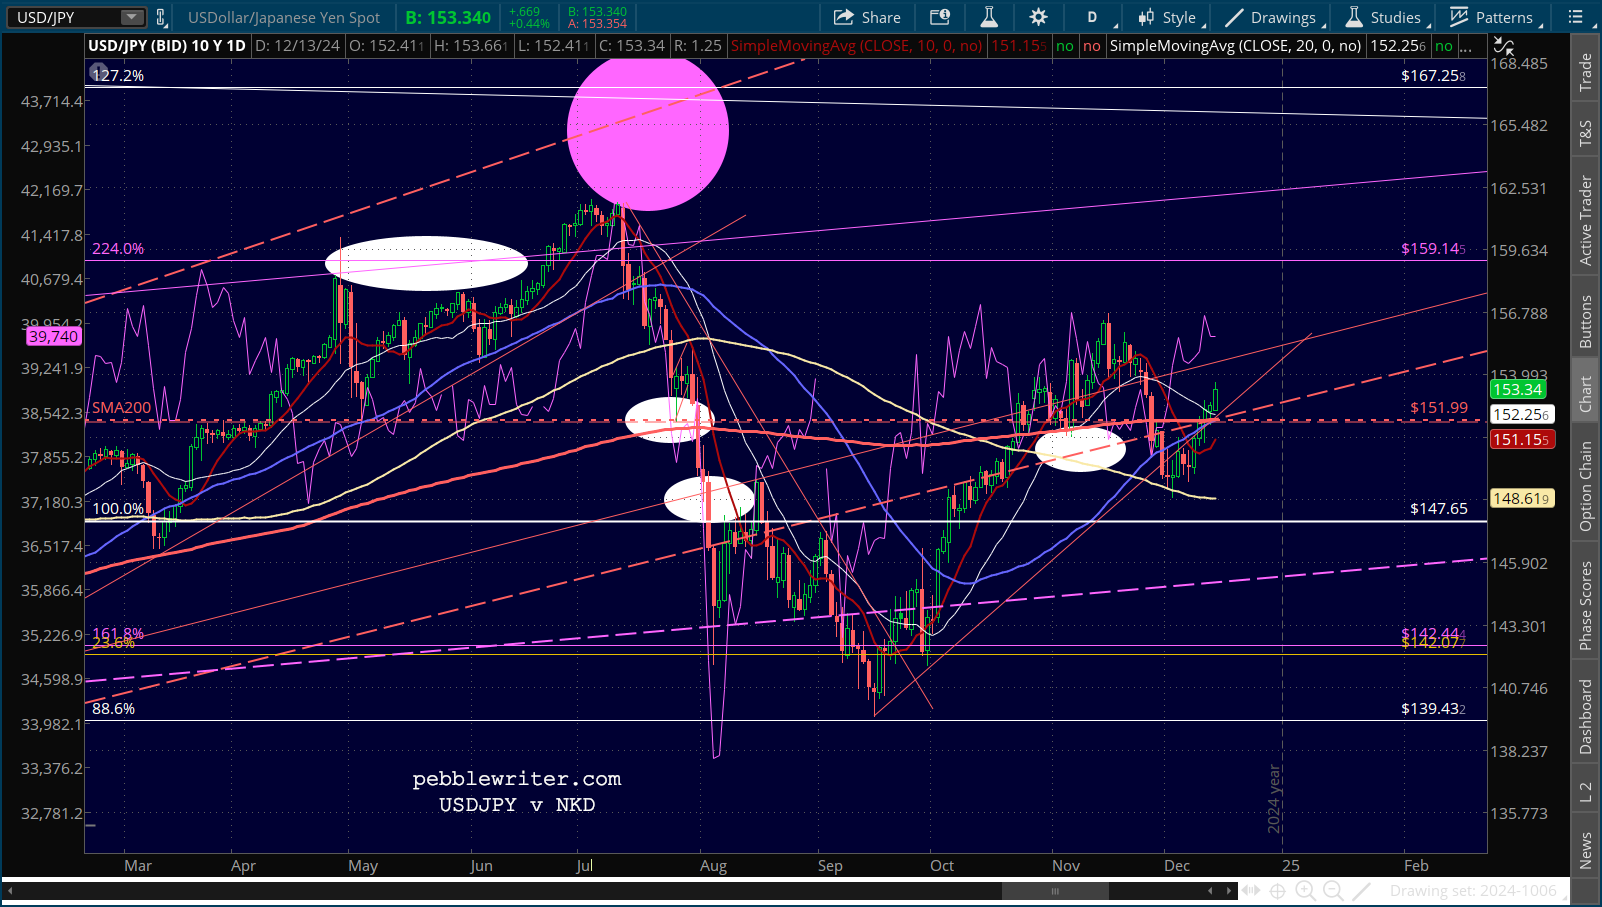
This bump is entirely driven by VIX’s slip back beneath its SMA10 as well as the USDJPY pop.
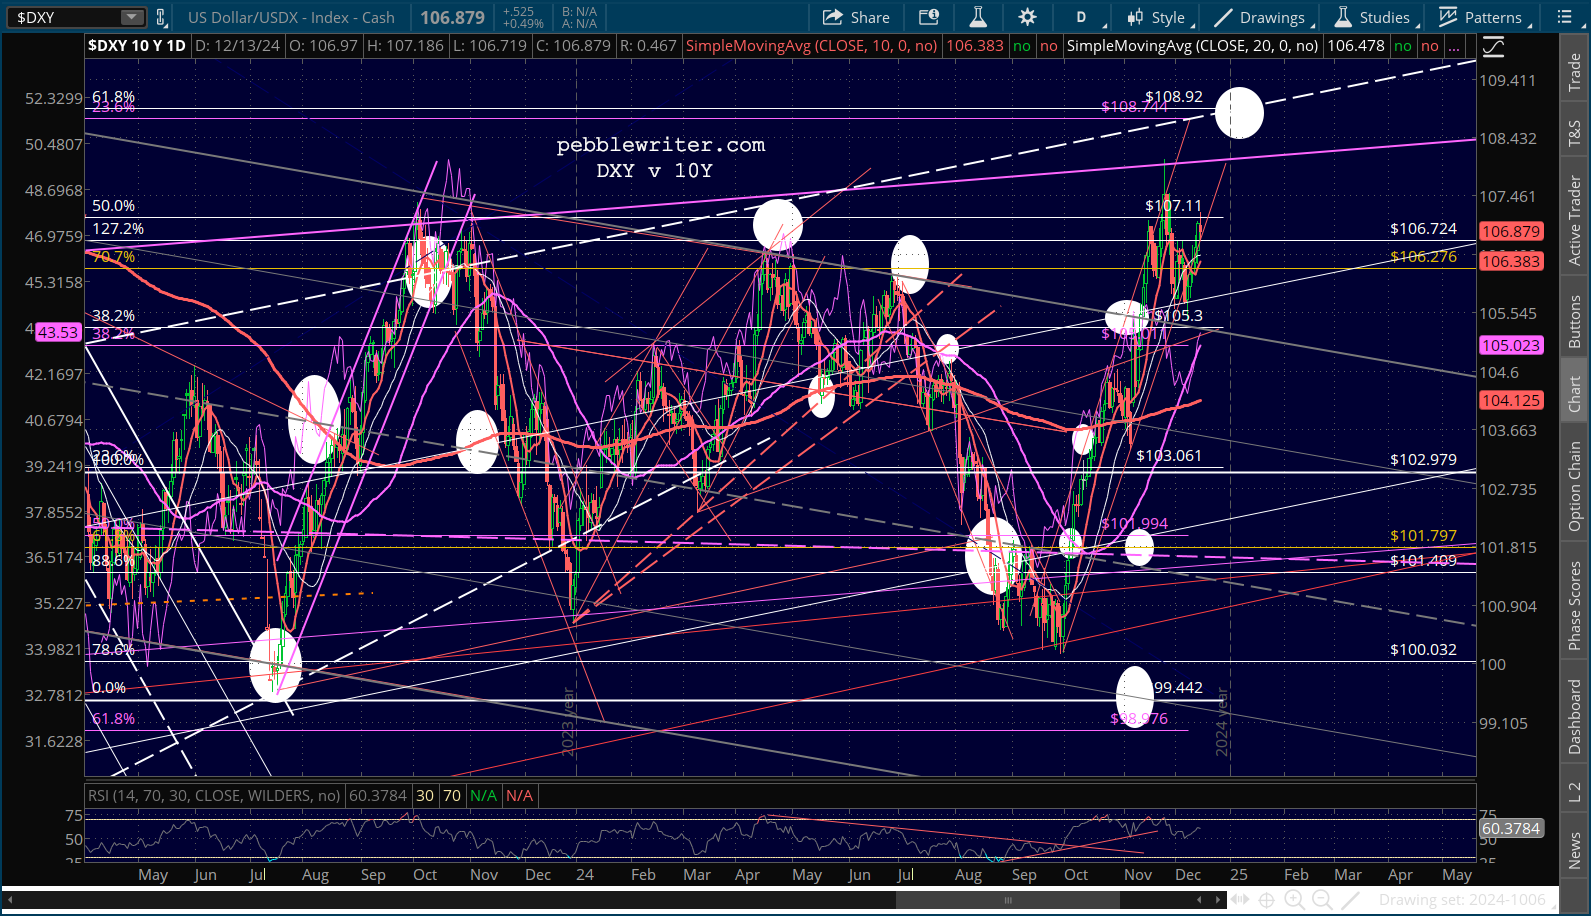
It must be taken with a grain of salt due to the worsening breadth of the S&P 500. The percentage of stocks above the SMA50 and the SMA200 has plunged well below the trend lines from a year ago – in stark contrast with the SPX itself. 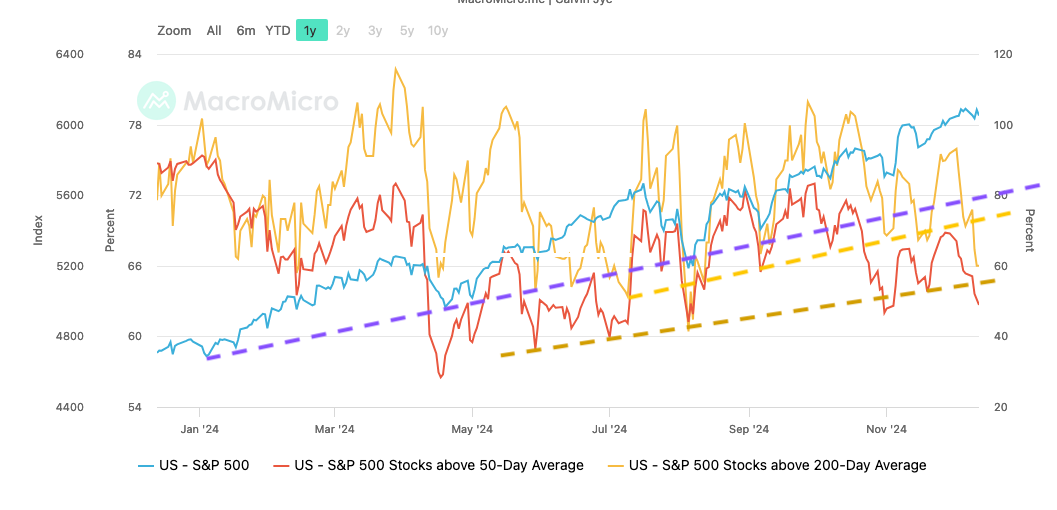 This has happened at the same time as the 10Y’s golden cross and push back above its SMA200.
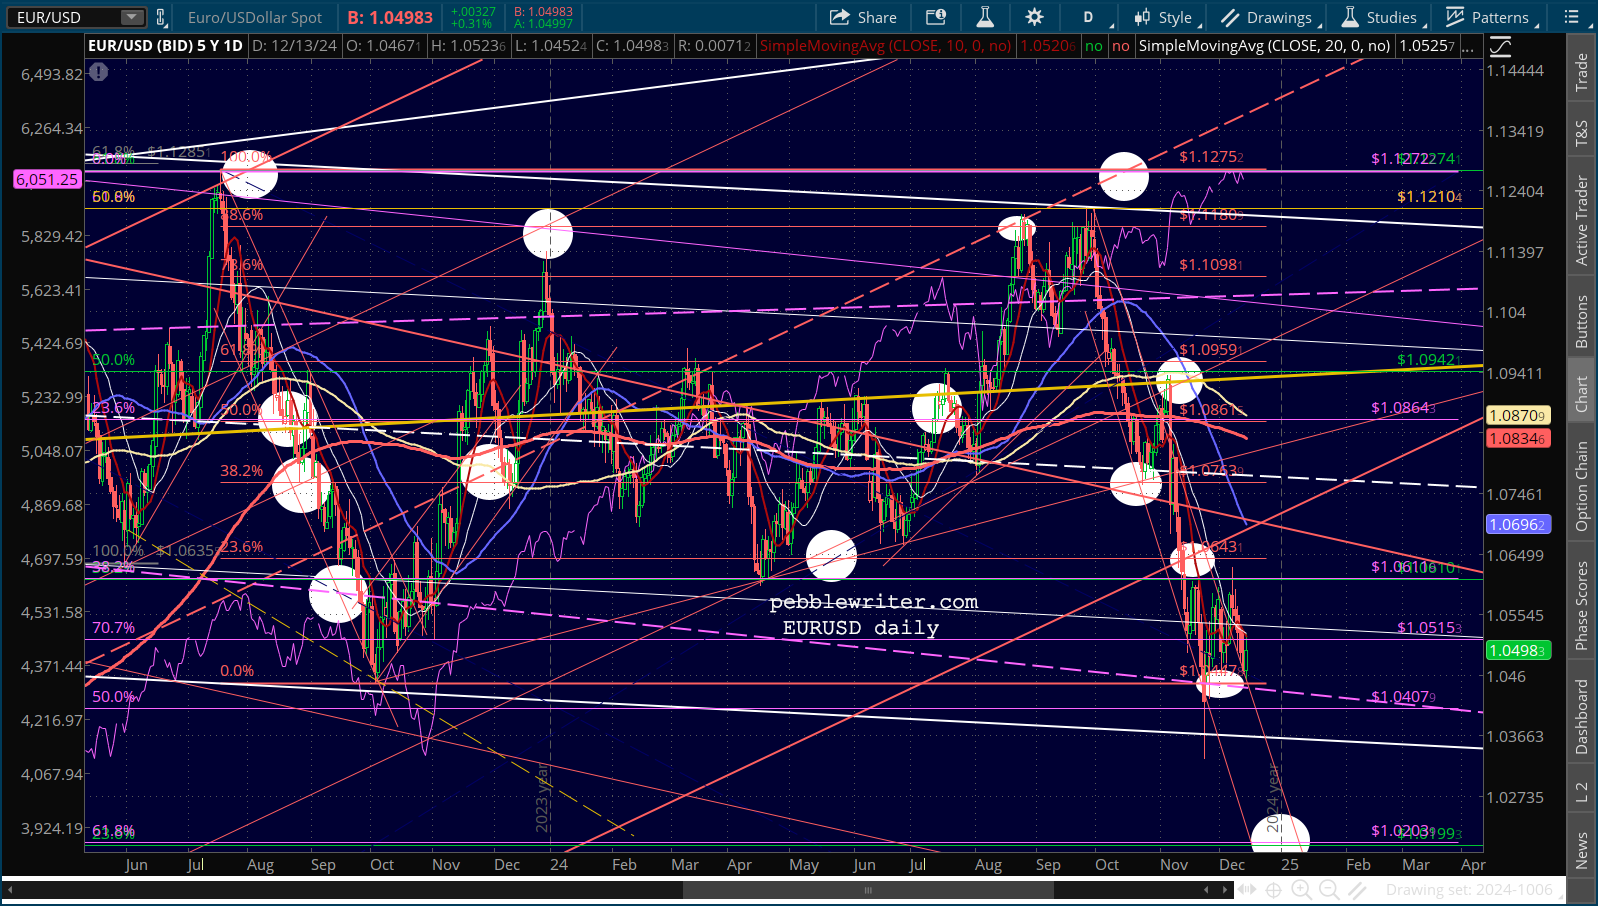
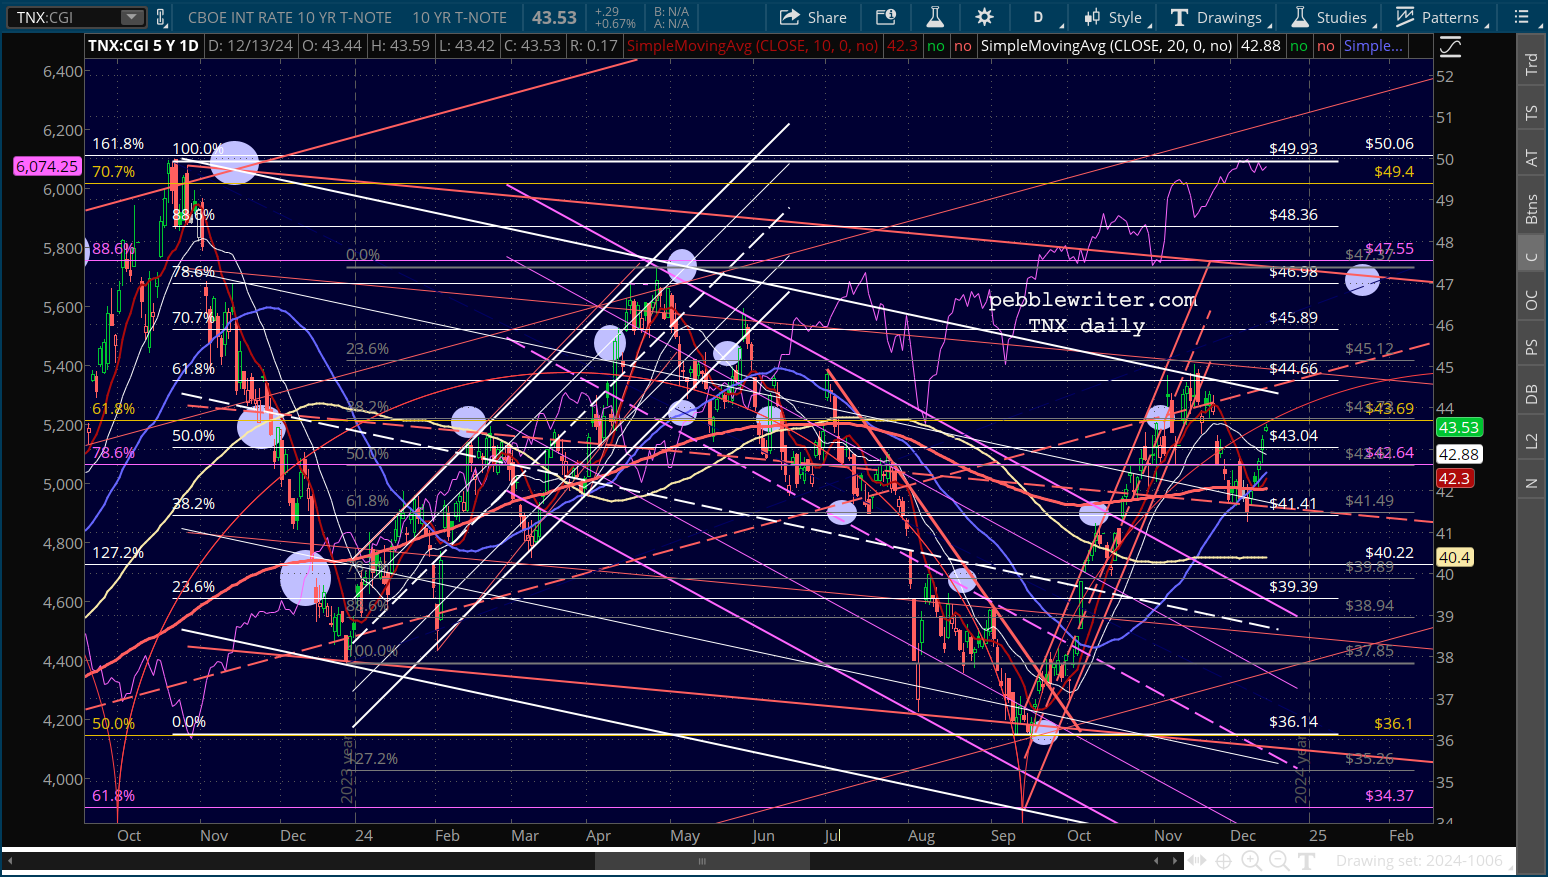 The rest of the equity charts:
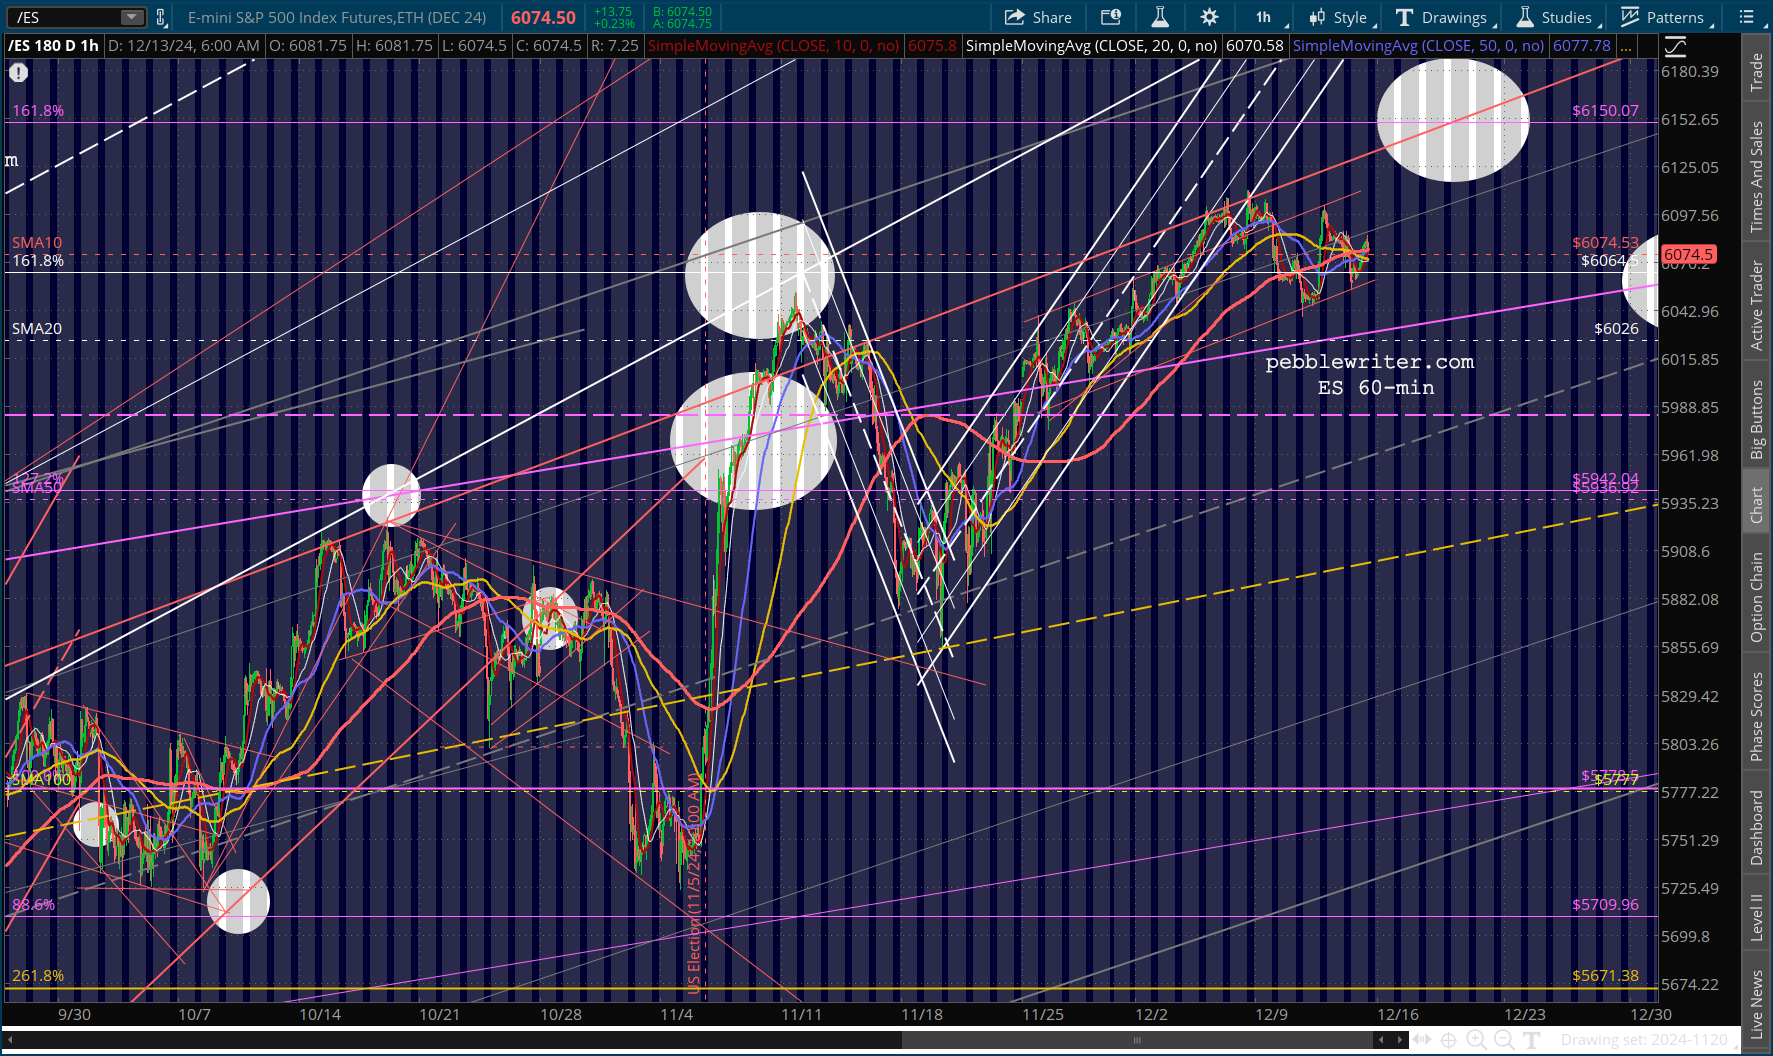
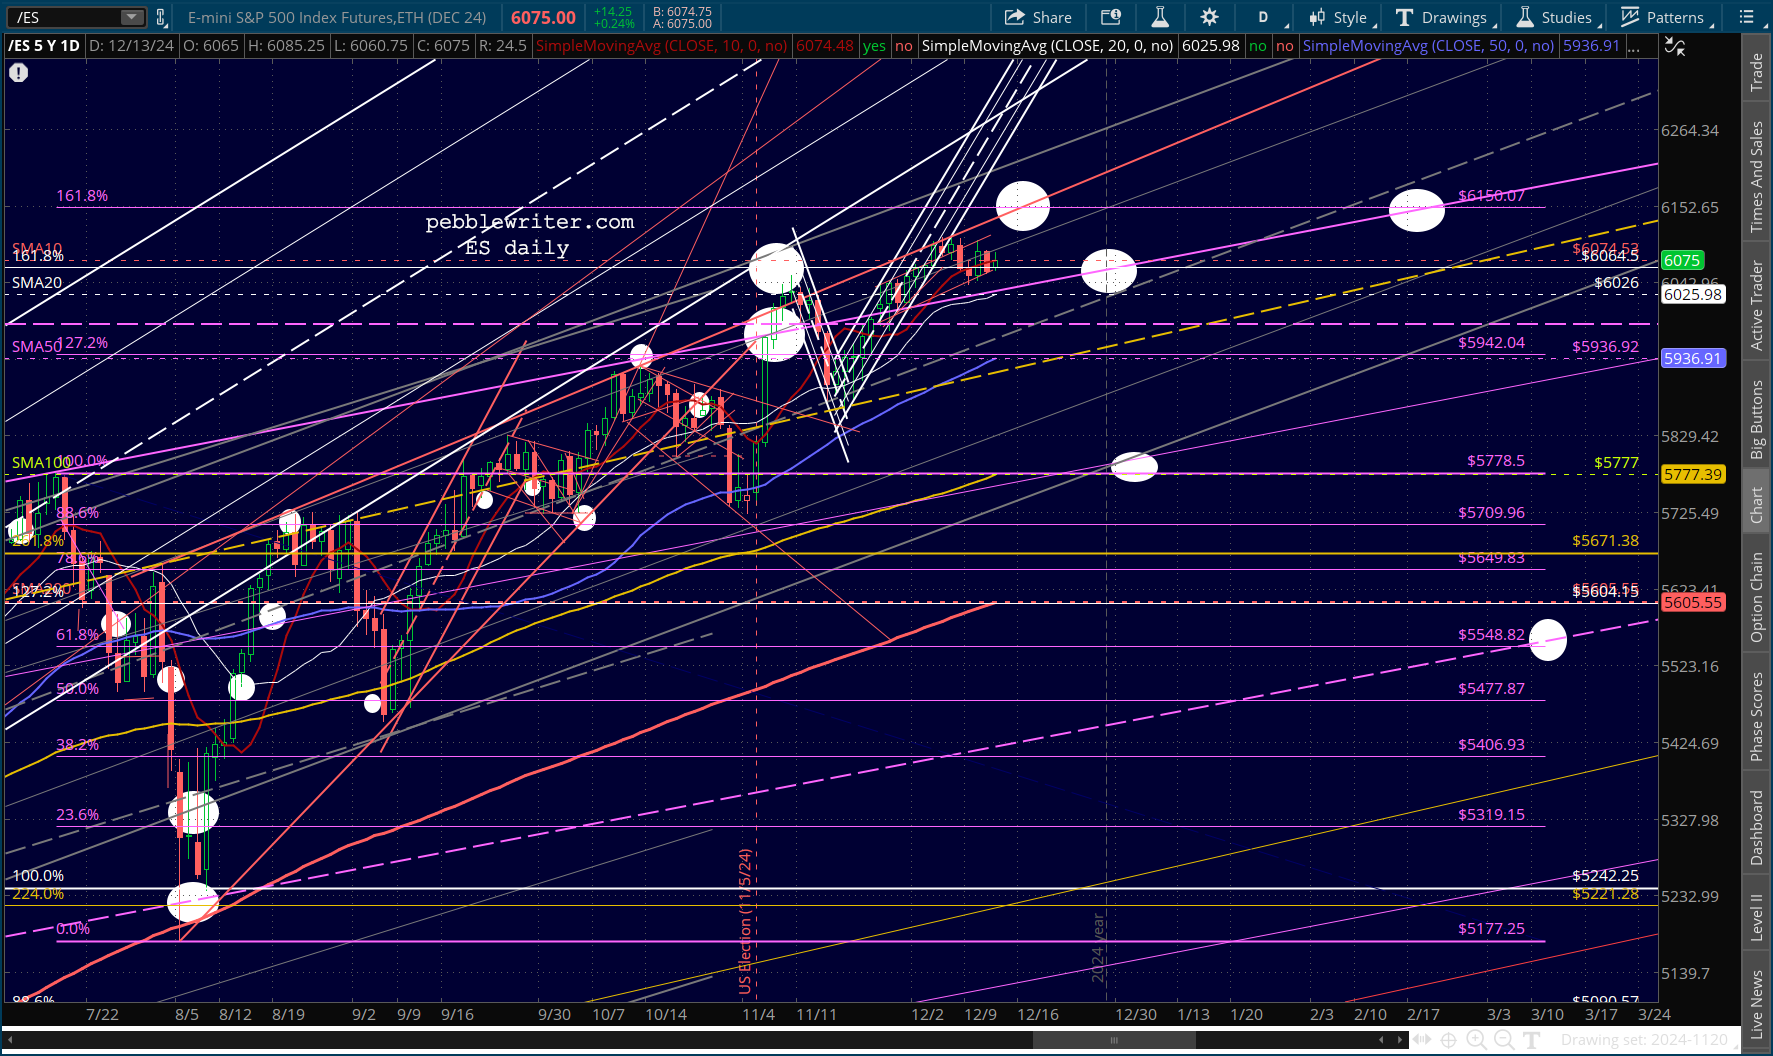
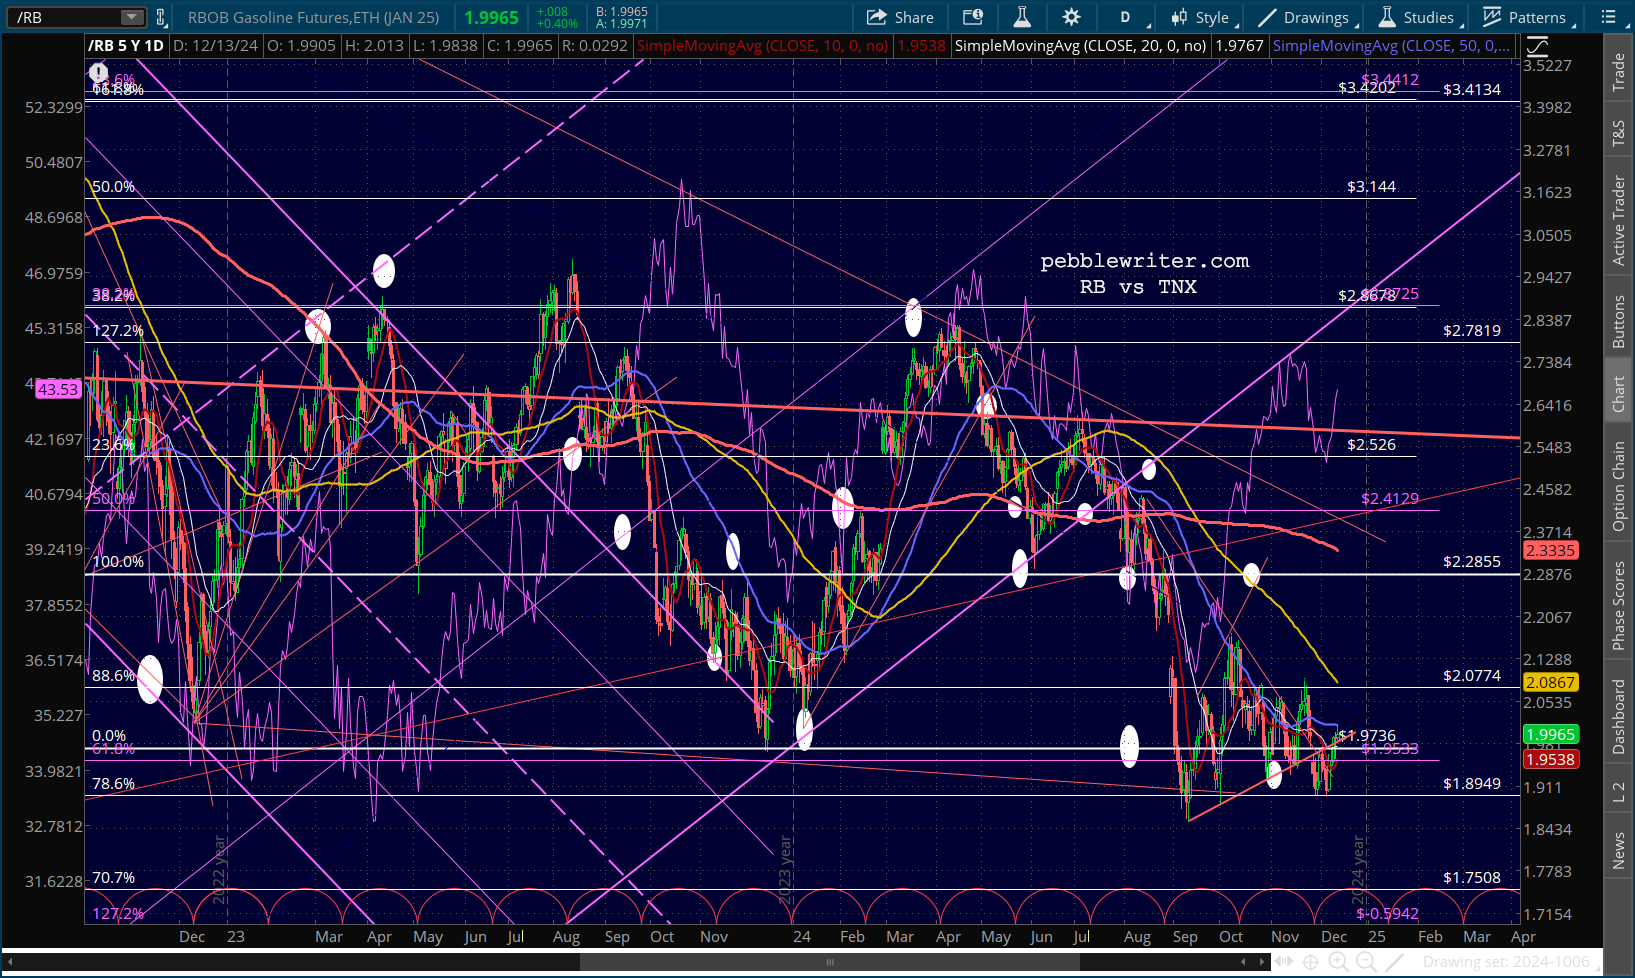
 Note that CL and RB are both putting additional pressure on interest rates.
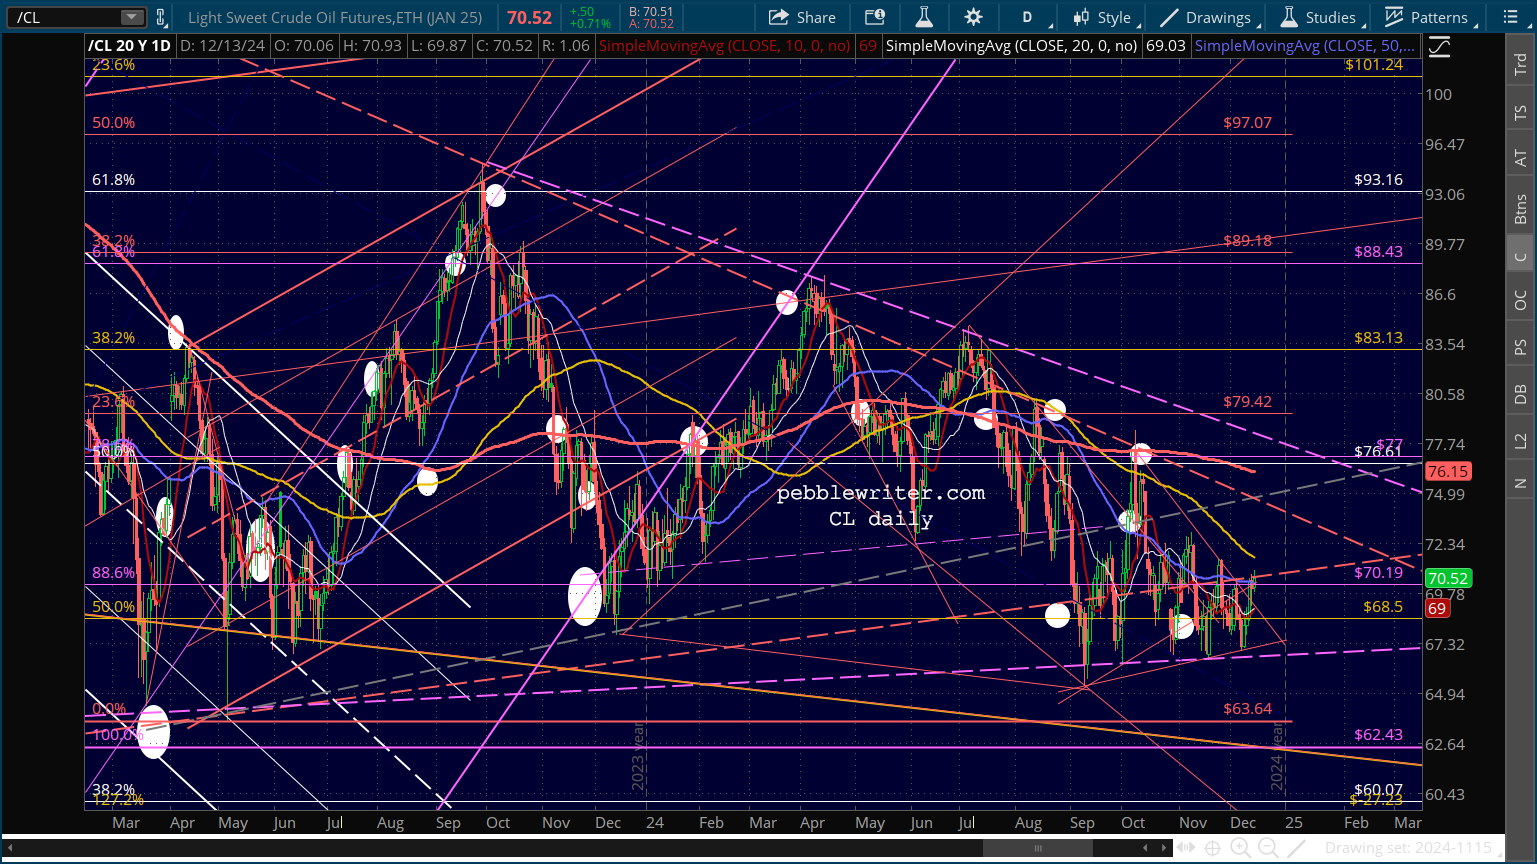
 Bulls are pinning their hopes on a narrowing leadership, primarily the tech sector, and the prospect of Trump doing everything he can to goose the markets. This is reasonable. But, we maintain that the FOMC has every reason in the world not to cut rates next week and that such narrow leadership in equities means a substantial decline could occur in the next few weeks.
Stay frosty.