

Yesterday was a great reminder that no matter what the economic news, the “market” is no longer in touch with reality. Between central banks and the HFT/algos suckerfish that feed off them, true price discovery is a thing of the past.
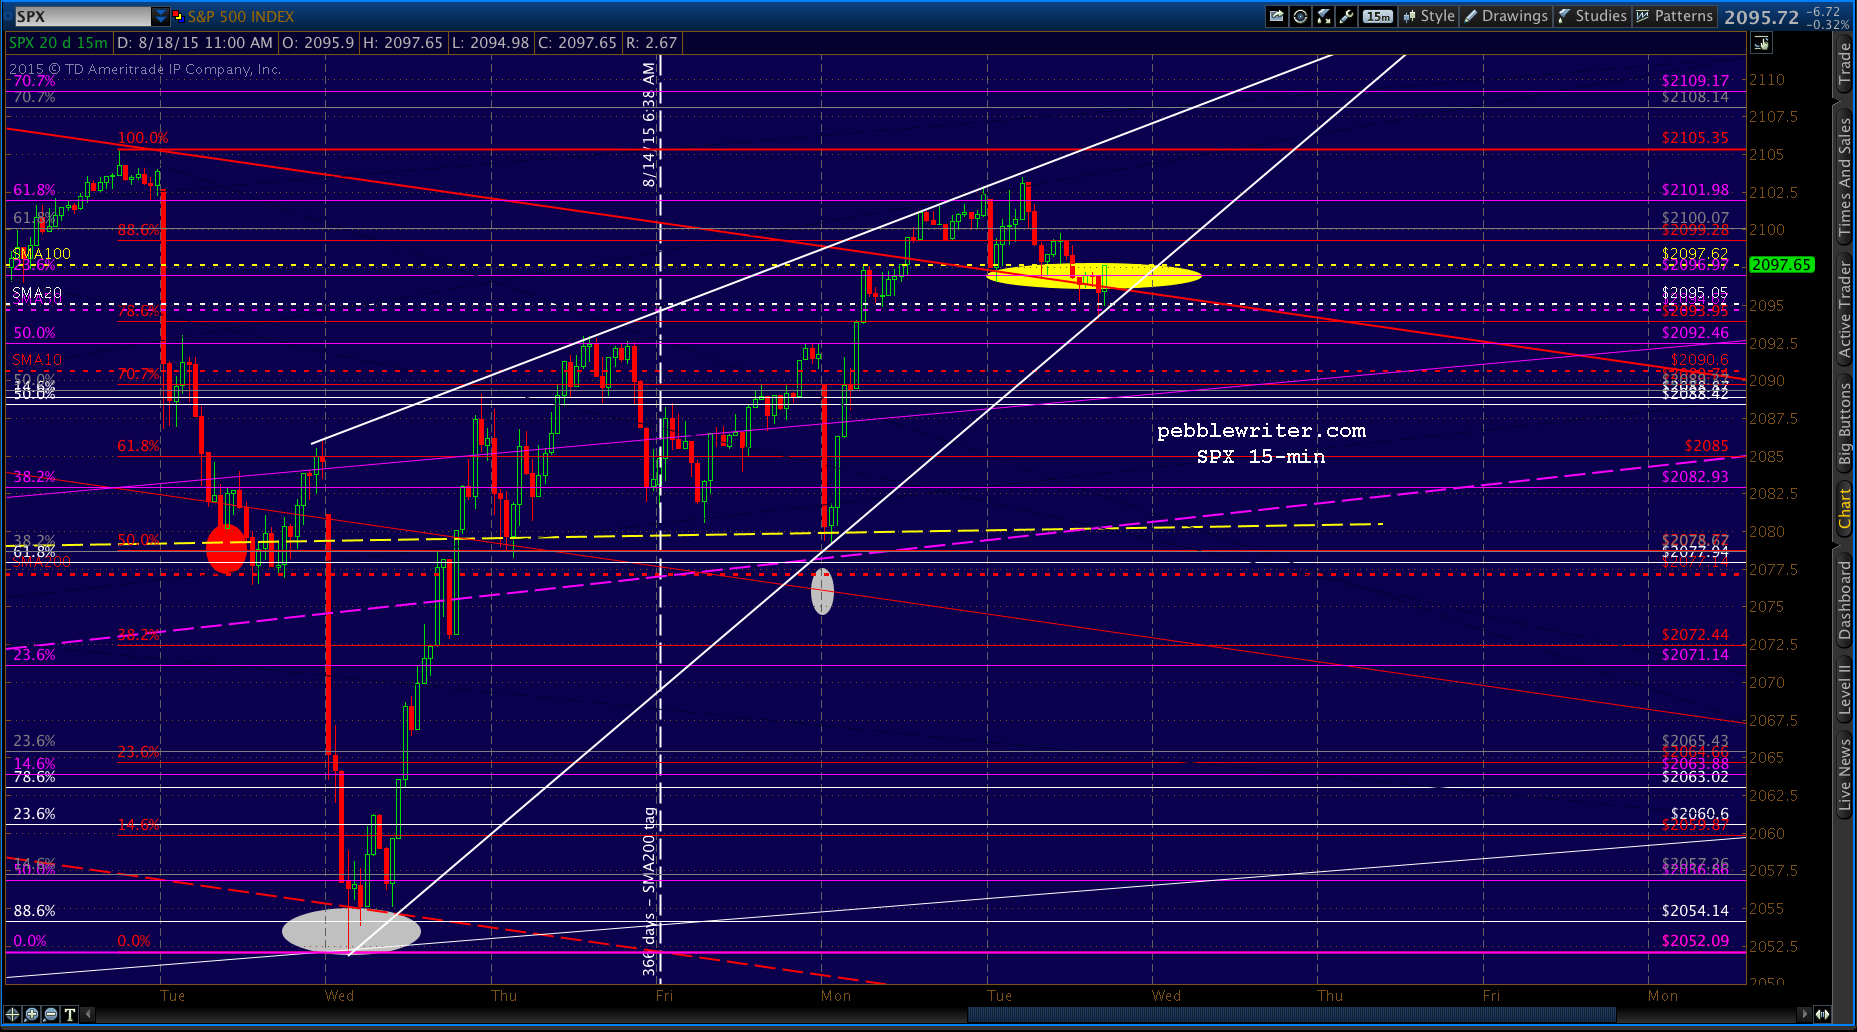
Yesterday’s 24-pt reversal at 2091.51 had nothing to do with the economy, politics, or the Kardashians. The diminutive trend line we pointed out at 9:40 (below, in yellow) connecting the eminis’ last two lows was all it took.
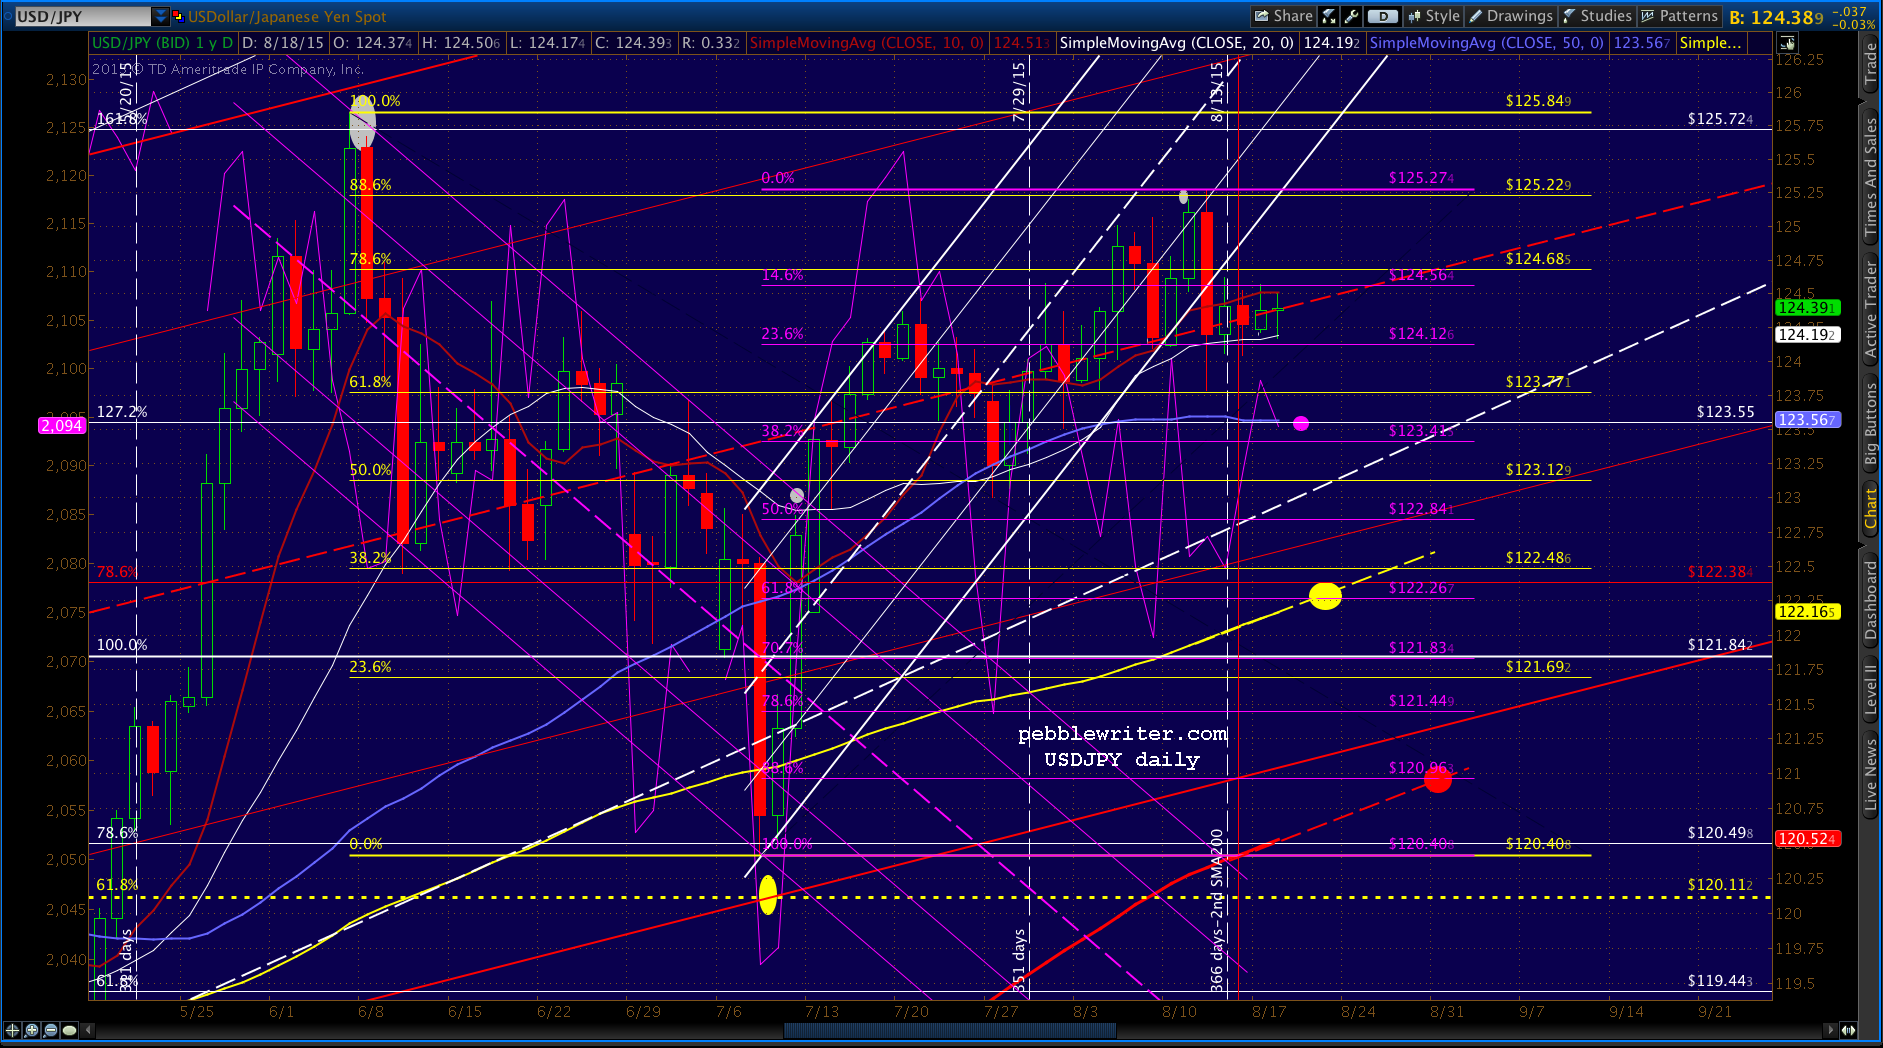
 It’s an apt intro to this morning’s USDJPY chart. Despite having fallen out of the rapidly rising white channel, it has somehow managed to stay just north of the rising red channel midline. In fact, every SPX dip we’ve seen over the past two weeks has prompted a quick retreat to the safety of that bullish refuge.
continued for members…
After completing the Crab Pattern on June 5 up at the white 1.618, USDJPY retreated to the white .786 — a reasonable response. It since rebounded to the yellow .886 with an interim reversal near the .yellow .786 – not quite a Butterfly setup.
Since then, nada. It’s being propped up on the red midline for five sessions in a row. The SMA100 (yellow) and SMA200 (red) are rapidly approaching. So, we’re left to wonder if/when the backtest will occur.
Two good candidates are indicated below (red and yellow dots.) But, at this point, I’d be impressed if it can test the SMA50 at 123.55.
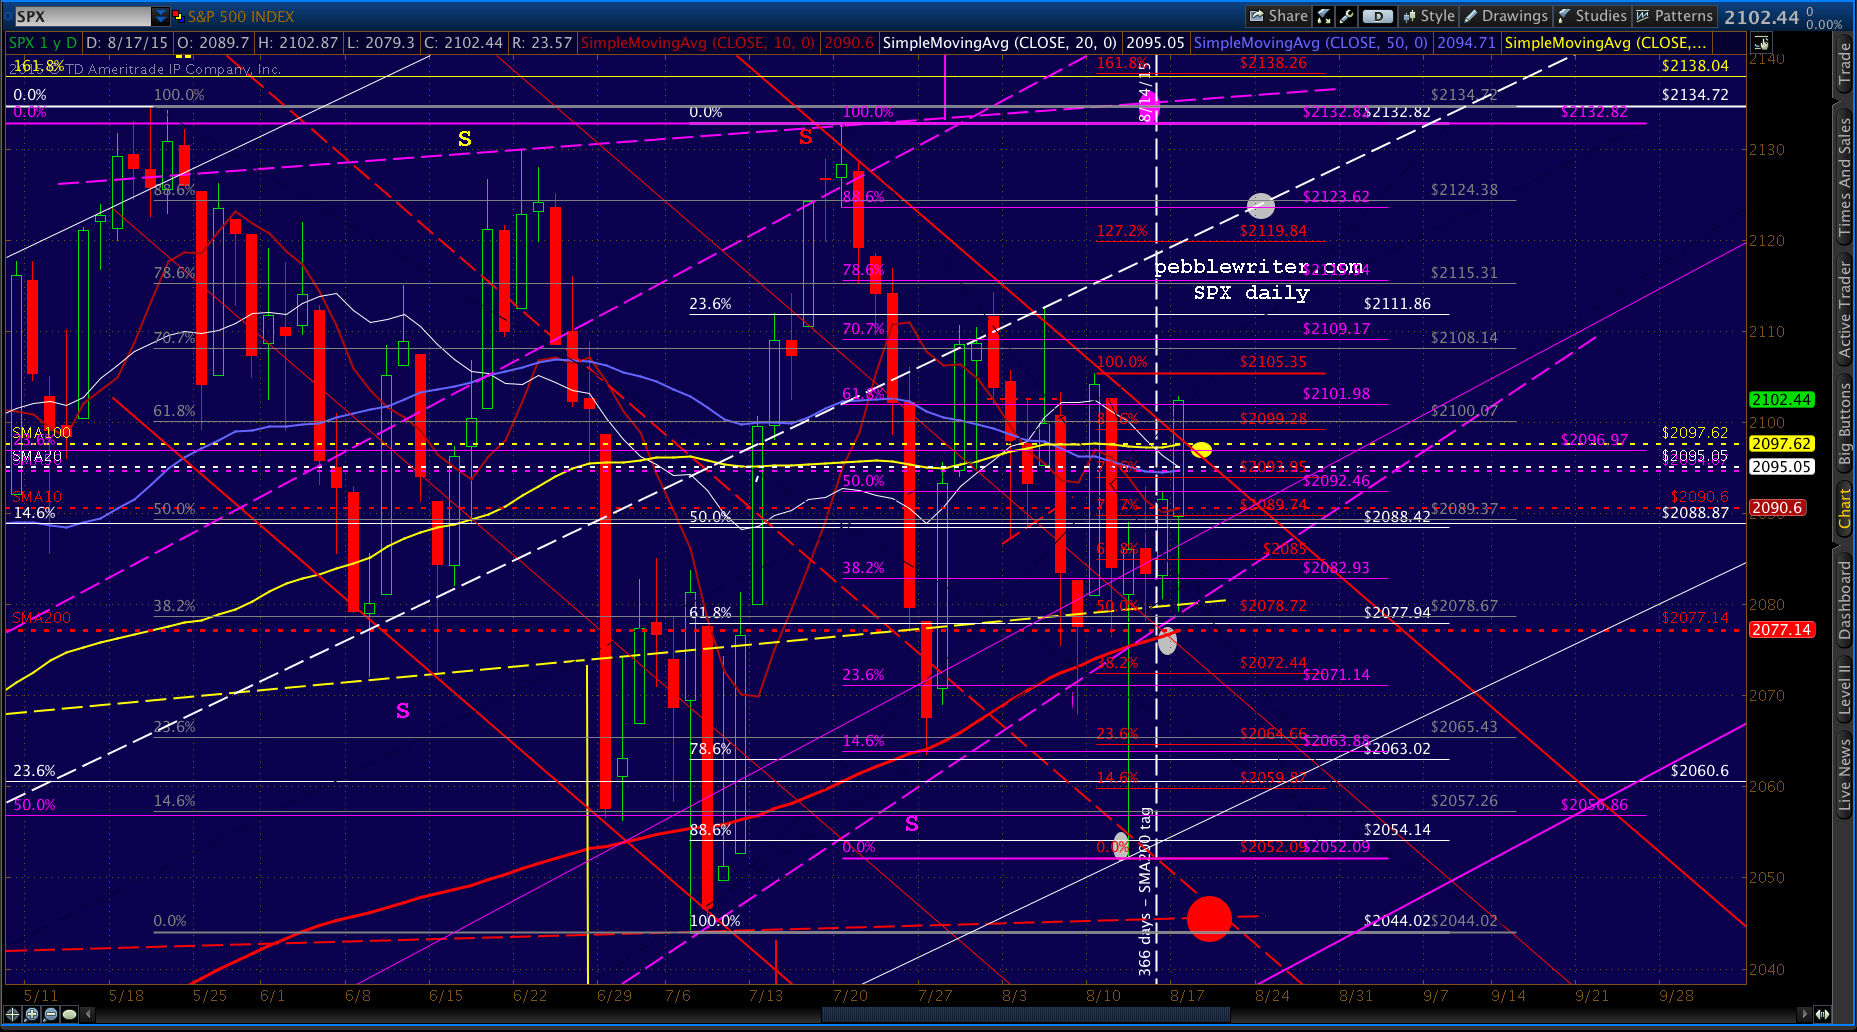
 It’s wavered just enough this morning to allow SPX to complete the backtest we discussed yesterday.
 UPDATE: 9:33 AM
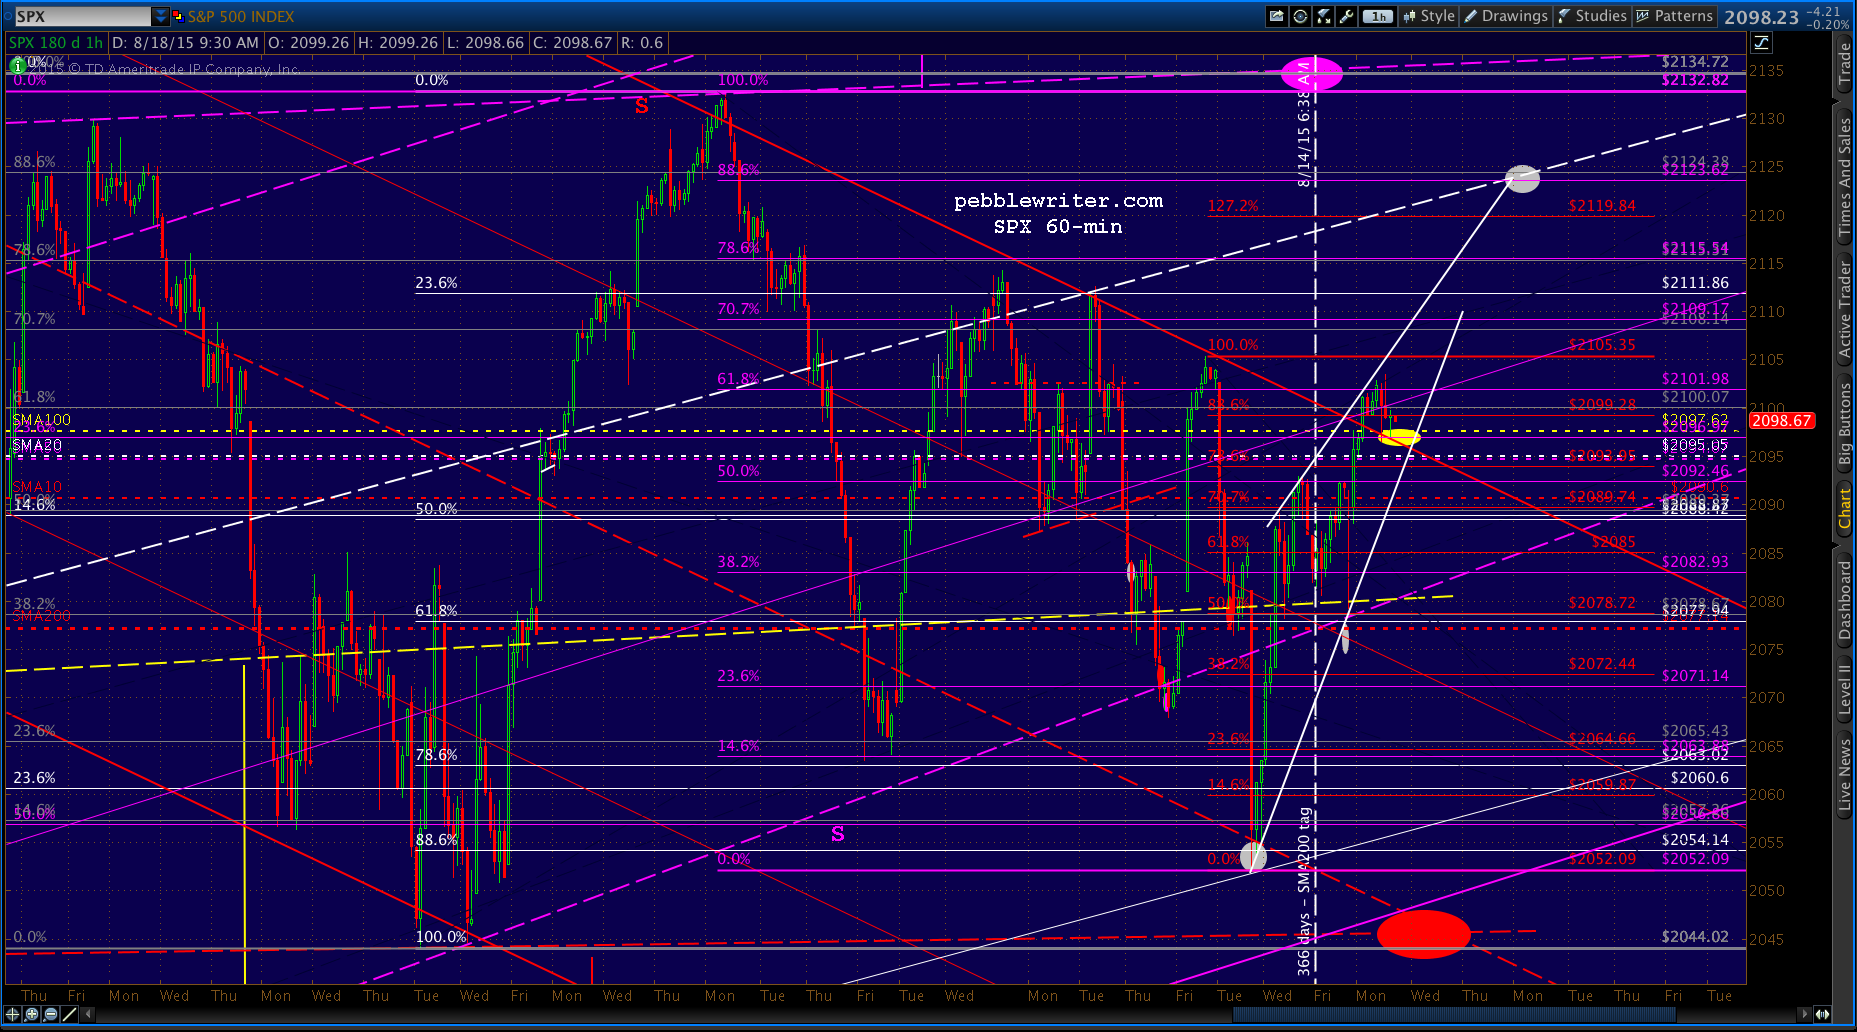
SPX just tagged the SMA100, which will likely complete the backtest of the broken red channel as well. The burden is on the bears now, so best to be long here at 2097.82 with tight stops to protect against a head fake that, itself, could be a headfake.
The SMA20 and 50 are just below at 2095 and represent decent secondary support.
 A reminder: the big red dot down at 2045 isn’t so much a target as it is a reminder of the large H&S Pattern that might have played out — had not the Aug 12 rebound and ramp job occurred.
UPDATE: 12:40 PM
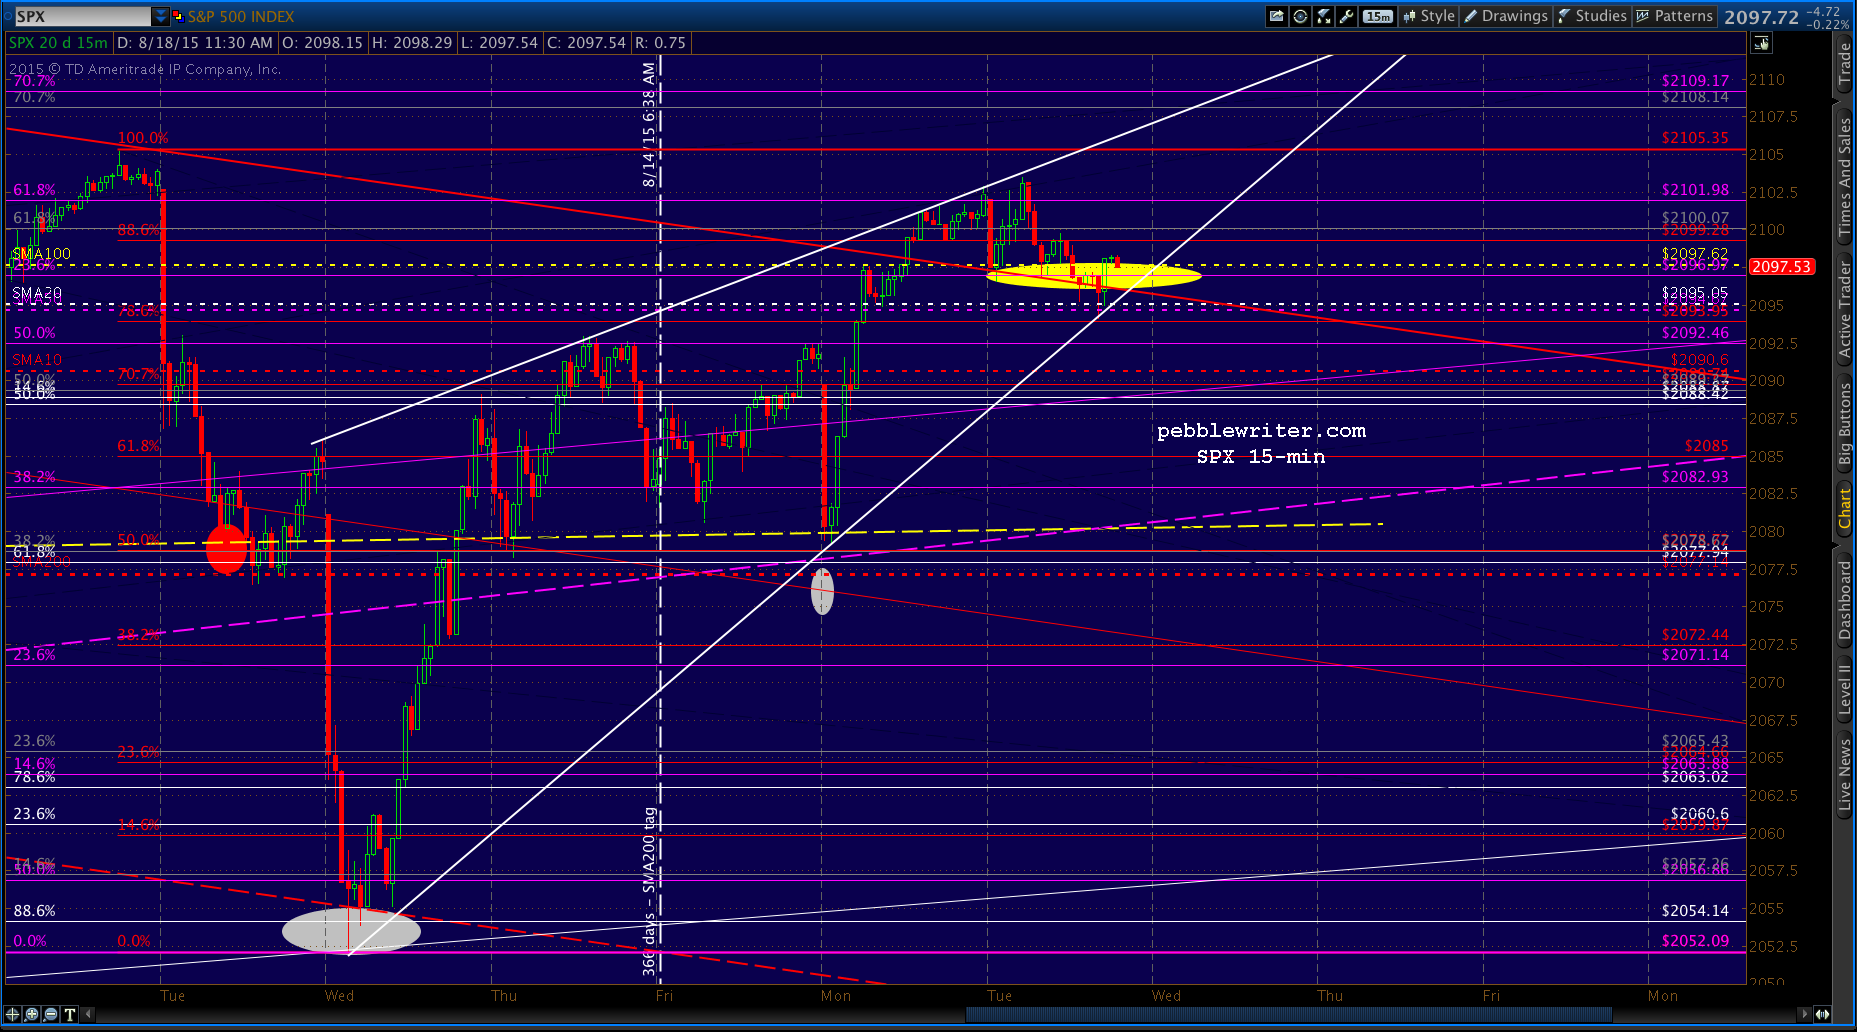
SPX can’t seem to get any momentum going. SMA20/50 looking more likely if the RW plays out.
 UPDATE: 1:00 PM
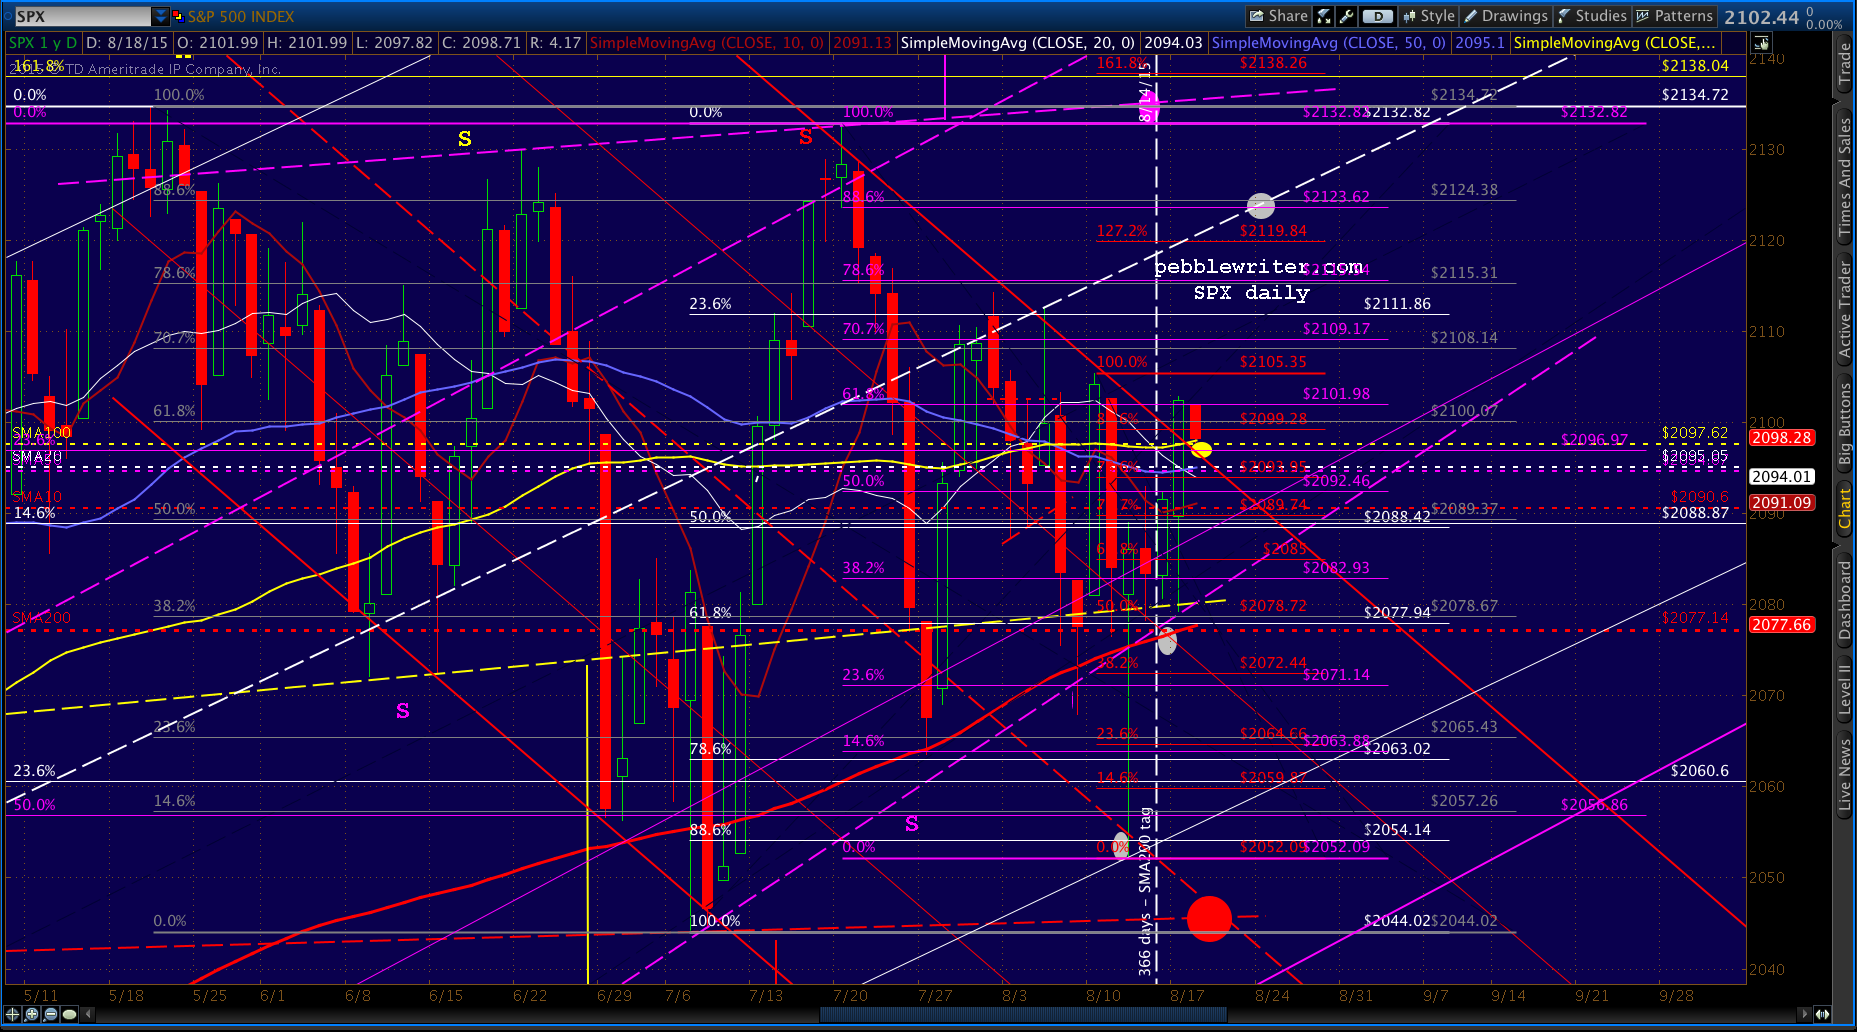
Note that yesterday’s high also marked the purple .618 (the drop from 2132.82.) A drop to the .500 would represent a minimal retracement if SPX breeches the SMA20/50.
It also would help flesh out that rising wedge with apex at the purple .886.
It’s unclear whether there’s more downside potential past 2092.46, but that looks like our next stop. Nimble traders might want to take a crack at a short here at 2097.
 UPDATE: 2:00 PM
Looks like that’s as much as we’re going to get. Back to the long side here at 2097.65.
 What happened to the .500? CL up to its usual tricks…
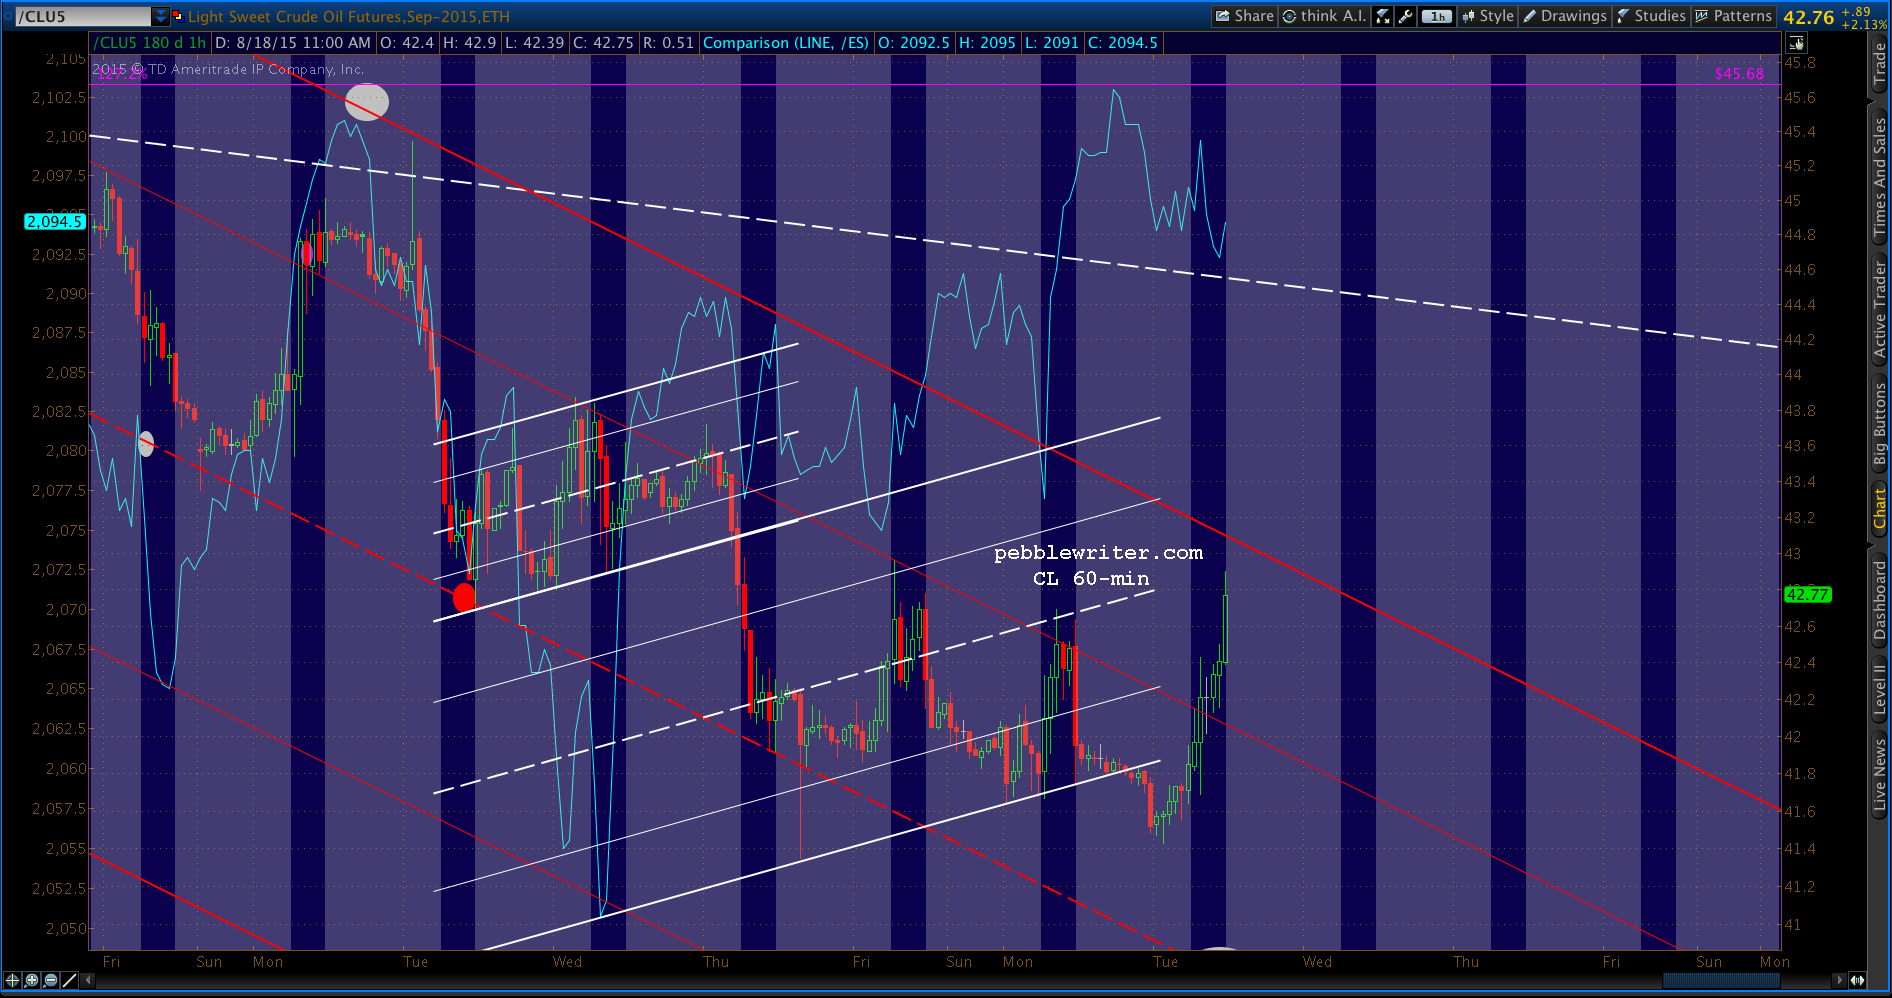 Note, however, that CL has reached the latest white channel midline. In other words, there might not be any more help coming unless CL decides to push through to the red channel top.
UPDATE: 2:34 PM
Might have spoke too soon. CL bailed on its rally in the last 20 minutes into its close. 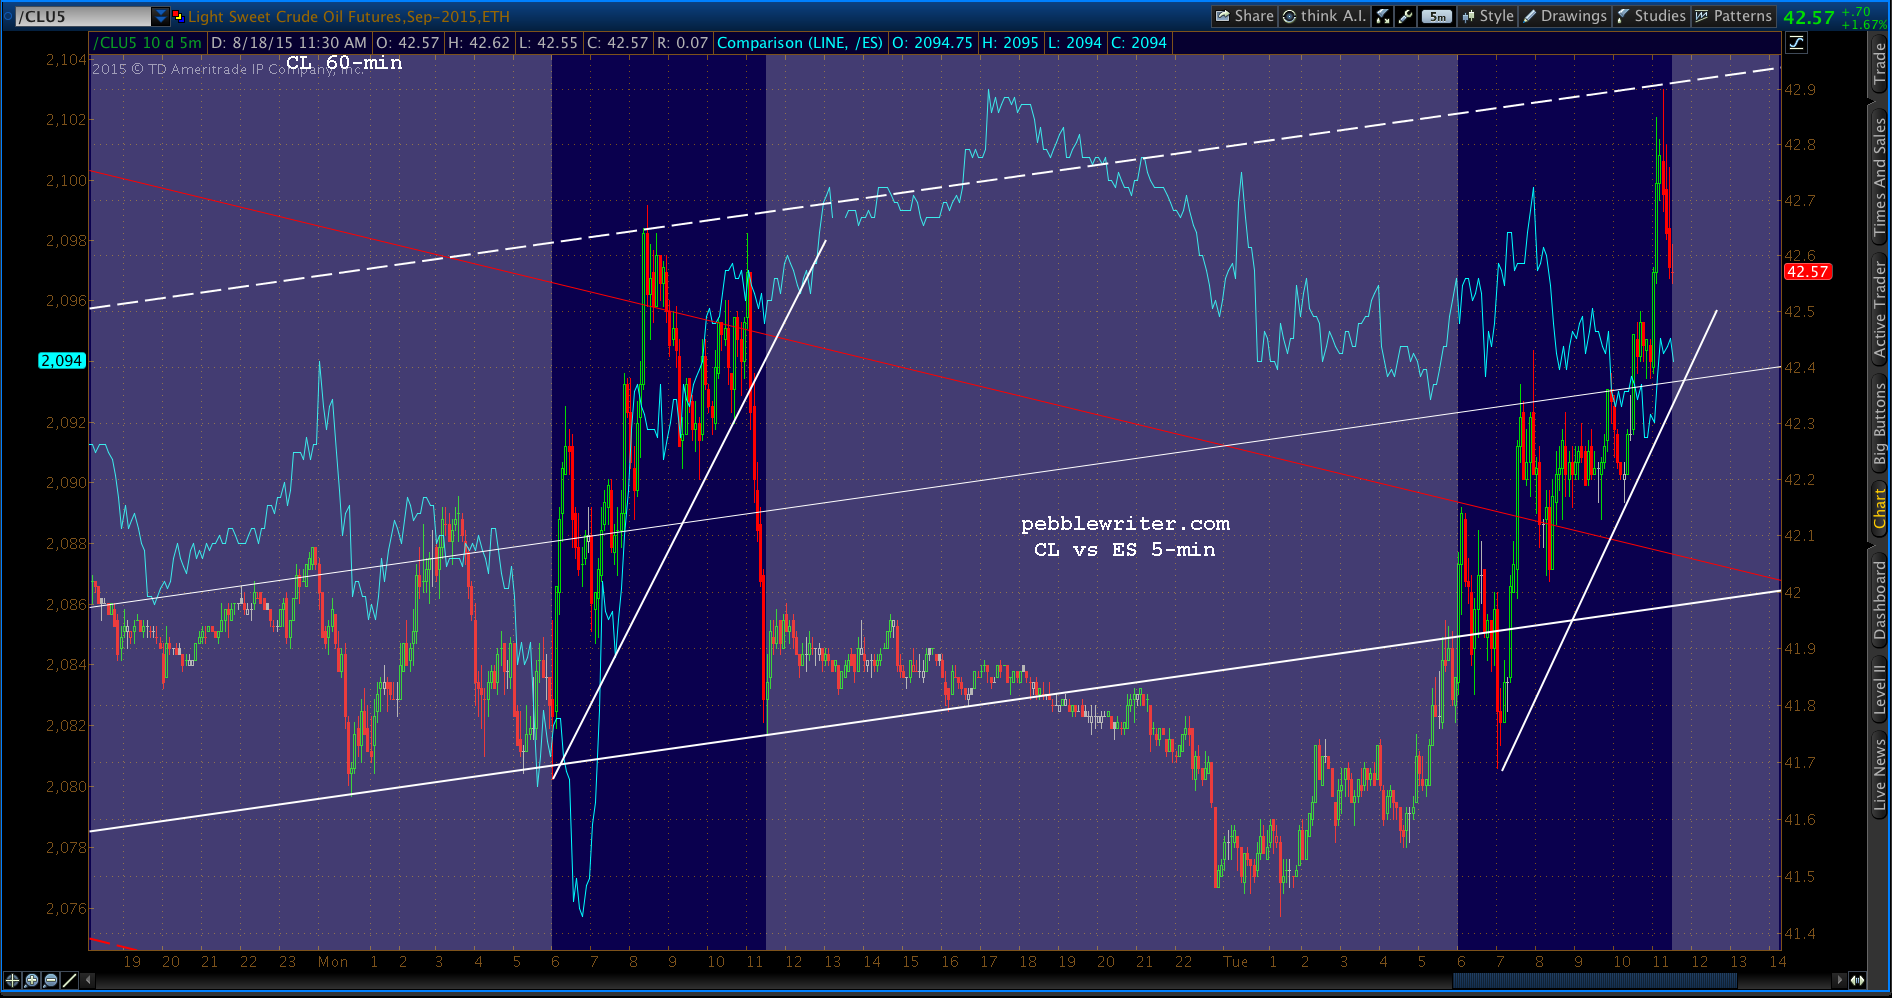 SPX is going to have a hard time not following unless USDJPY revs up. 2092.46 might start looking good if USDJPY doesn’t come to life.
 Days like today…? Probably better off sitting on the sidelines and letting the algos duke it out.