A lot of people get that wrong. They talk about drilling for oil. But, what’s the point, when you can just spoof for it instead?
[If you’ve missed our previous discussions of spoofing, the WSJ recently put out a nice article and video discussing it in some detail.]
Crude light stumbled badly yesterday morning after the news came out that oil inventories had risen at the fastest rate since 2001. It dropped below $50, breaking a little trend line that it’s been climbing since the 27th.
 Stocks were none too happy with this development. SPX promptly fell about 23 points to tag our target from Monday — the 20-day moving average.
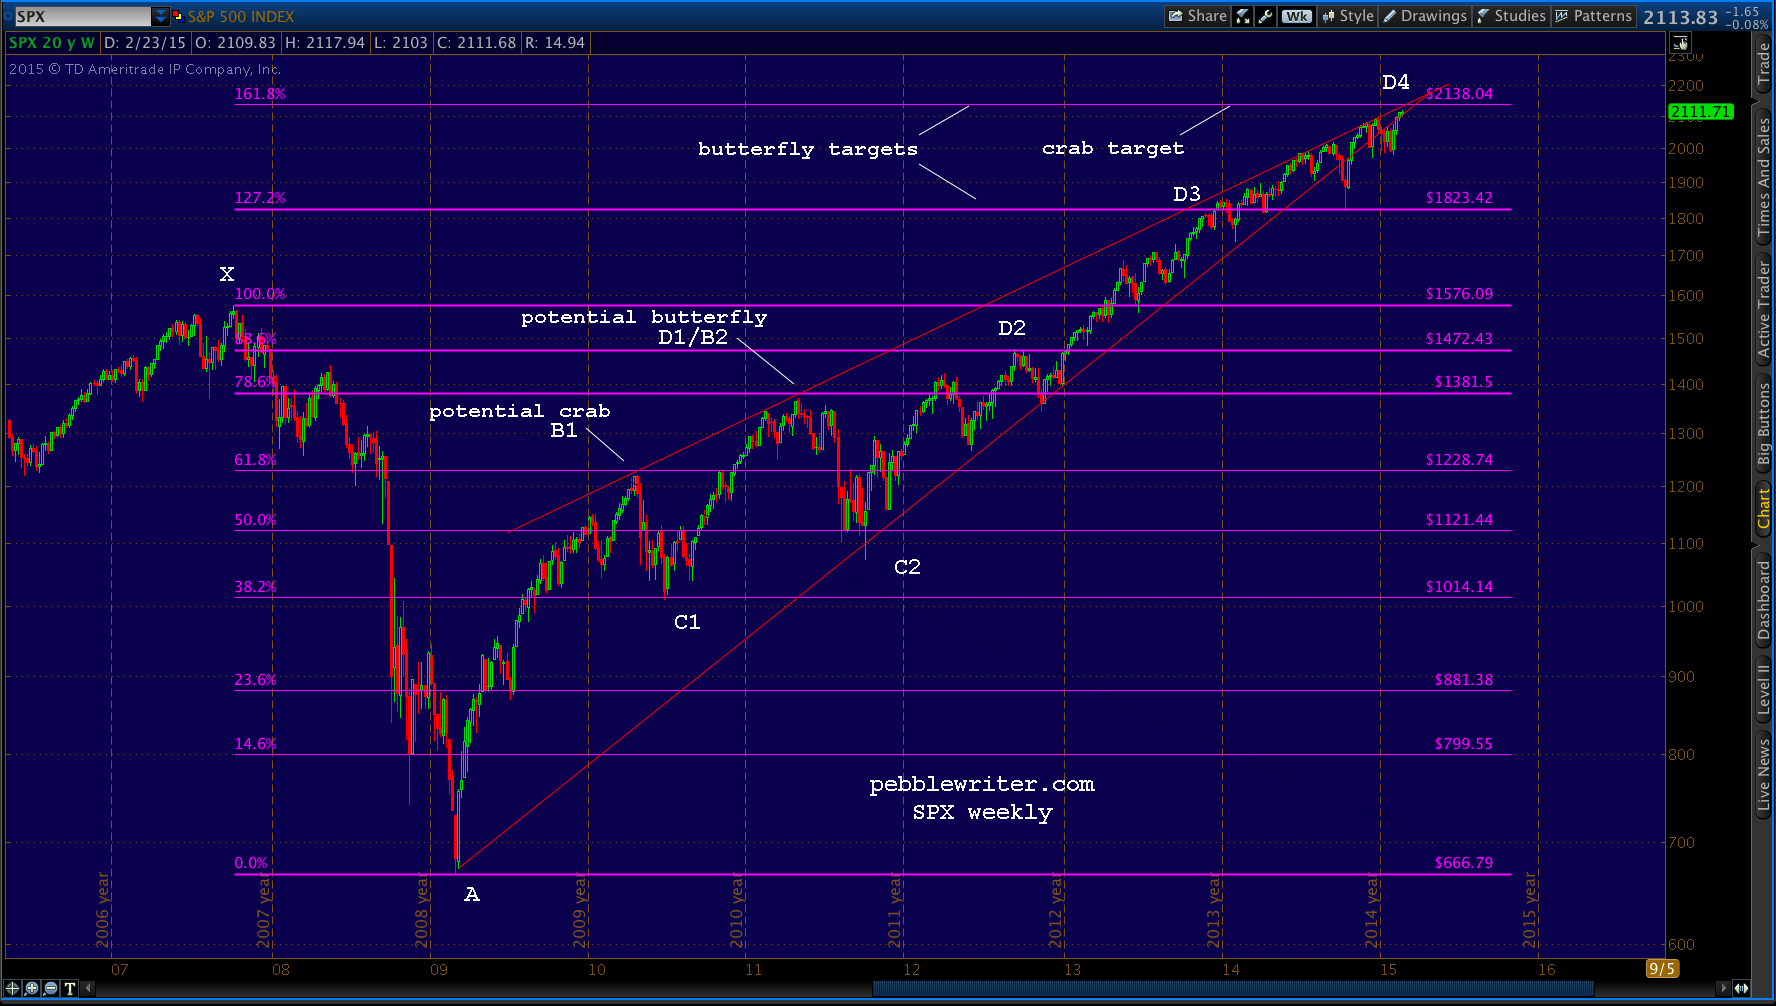
If the past is any indication, SPX isn’t quite ready to make its next major move….l’m looking for SPX to move lower before moving higher, with the likely target being a test of the SMA20.
 Since oil’s drop had caused stocks to also drop, it stands to reason that a recovery in oil would also trigger a recovery in stocks. At least that’s the way algorithms work.
Sure, there is some economic logic baked in there somewhere: rising oil prices eventually contribute to higher profits in the oil complex. But, generating higher profits takes more than a few minutes. And, stocks were getting beat up pretty badly.
Enter the oil-fueled algorithm and its vehicle: the spoof. As Nanex’s Eric Hunsader points out, oil is being kept afloat by orders that are placed by those with no intention of being filled.
Like ES, USDJPY, and other financial instruments/assets, it’s an effective way to temporarily boost prices. Done cumulatively, it’s an effective way to keep prices on an upward track — even in the face of horrid fundamental supply/demand news. CL, having led stocks lower, suddenly spiked 5% on the very worst day of fundamental supply/demand news in 14 years.
  Stocks — or rather the algos that drive stock prices — were only too happy to respond.
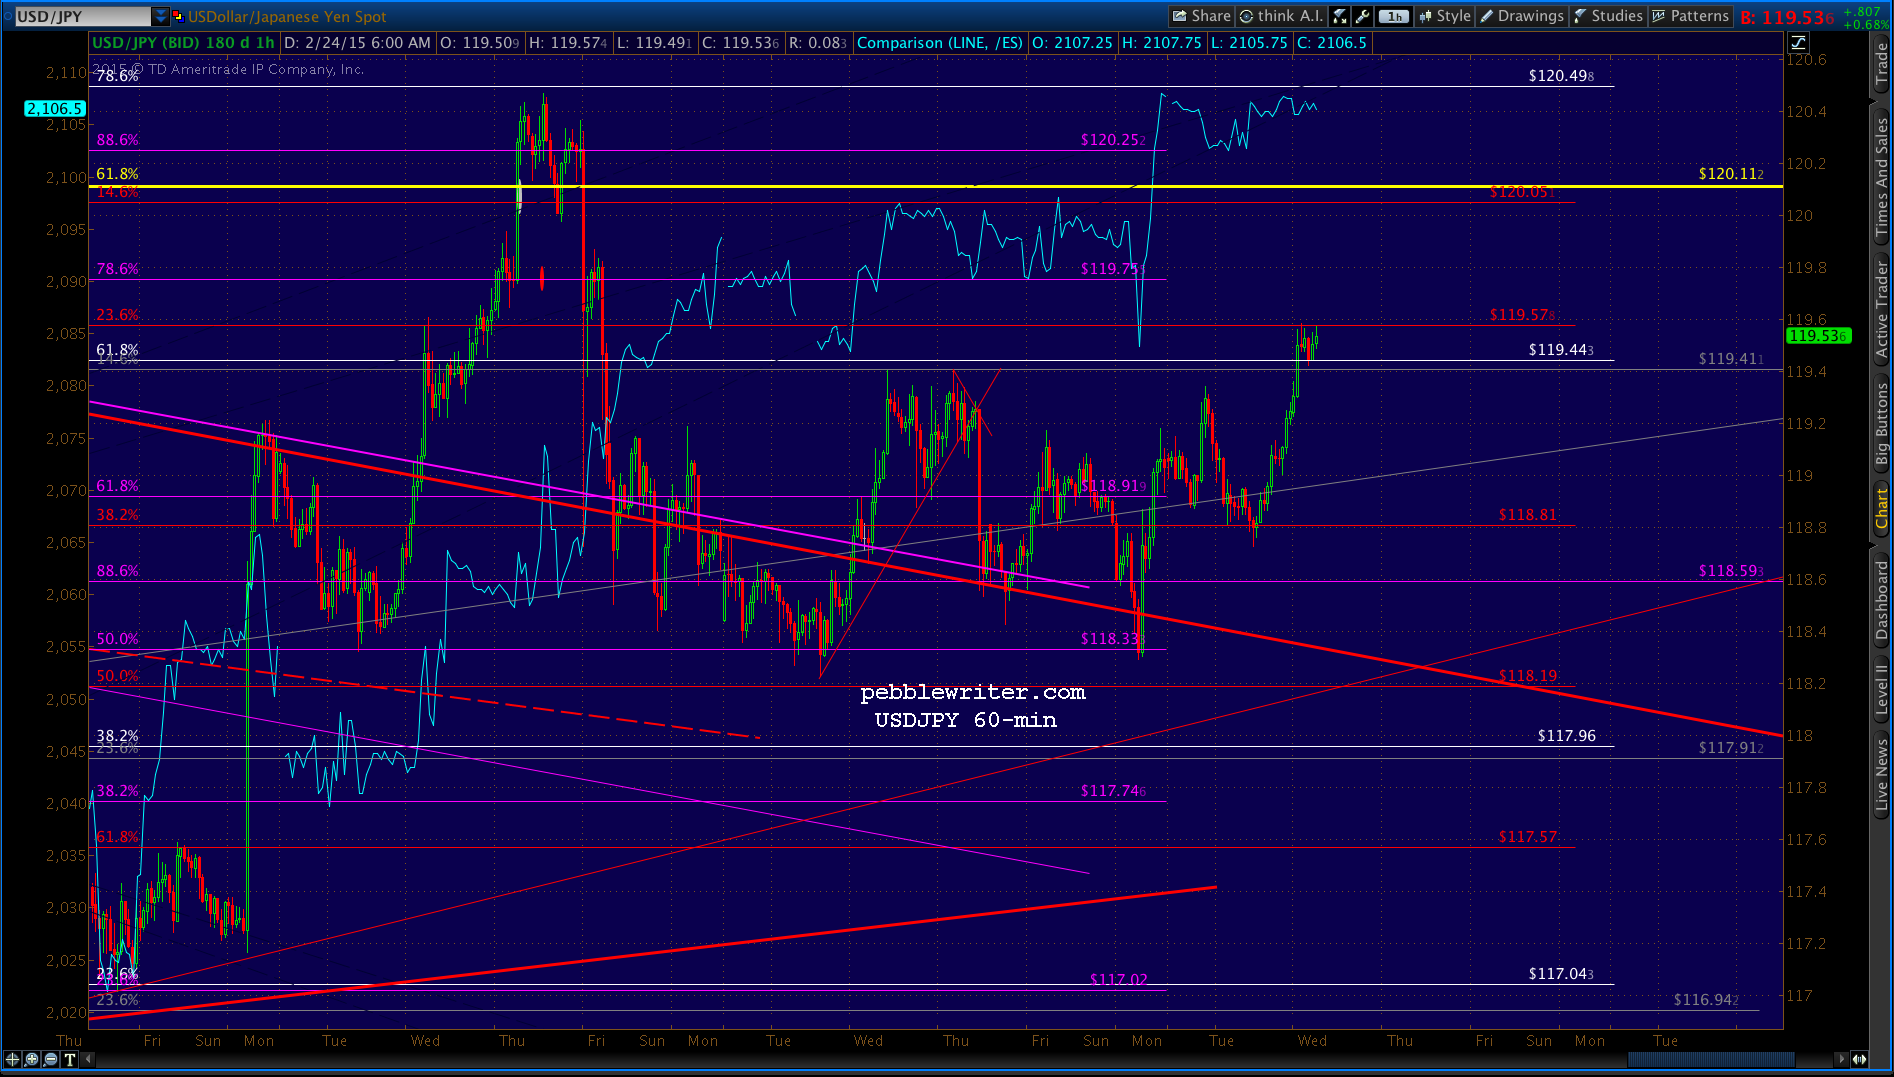
 Oil now yields the floor to USDJPY, which spiked above the .618 at 120.11 this morning in order to save stocks’ bacon today.
 EPILOG: 4:30 PM
To believe any of the above, you’d have to accept that TPTB are taking concrete steps to manipulate oil, currencies and securities prices. It would mean price action that, on its face, is designed to prop up SPX.
Earlier, we talked about the importance of 120.11 for USDJPY (the yellow, dashed trend line.) Don’t look now, but USDJPY not only slipped just past it, but closed slightly above it.
 And, CL, which needed to maintain the rising red trend line from a week ago… Guess what? It could hold, but my money is on the fundamentals mattering this time. In other words, I’d revert to short here for our 41.14-42.41 target range.