

Presented without comment:

NOTE: There is one last $200 rebate left for the already discounted Charter Annual Membership promotion. I’ll leave the page up until 9pm EST for whoever wants it.
Presented without comment:
NOTE: There is one last $200 rebate left for the already discounted Charter Annual Membership promotion. I’ll leave the page up until 9pm EST for whoever wants it.
SPX reached our upside target of 2104.21 yesterday, completing a Bat Pattern at the 88.6% retracement of the drop from 2134 (May 20) to 1867.08 (Aug 24.)
A Bat Pattern produces a reversal at the .886. And, sure enough, the futures were off about 8 points until 90 minutes ago. At that point, USDJPY and CL got busy, working to erase as much of the losses as possible prior to the open.

But, can they?
continued for members…
USDJPY reached the red channel midline again. And, CL reached the SMA100 as well as the neckline (again) of the IH&S Pattern that it doesn’t seem to want to play out. It might be bouncing now, but the prognosis is still negative.
 After all that, the futures are still negative.
 As to SPX, the normal repercussions of a Bat completion would point to at least the .618 or below. Combining the SMAs and channels, I’ve come up with these initial targets. If the .618 doesn’t hold, we could be looking at a corrective wave C that backtests the 1.272 Fib at 1823 all over again.
 However, since CL and USDJPY manipulation have been running strong lately, we should be cautious around the .786 at 2077.45.
And, if they really want to run roughshod over traders, TPTB will ignore the pattern all-together and force prices up to the 2134 highs. The past several weeks have proven that it’s still easily done through ratcheting alone [see: Ratcheting Stocks Higher.]
UPDATE: 9:44 AM
Here’s a close up on USDJPY and CL’s efforts so far…
 UPDATE: 11:38 AM
Well, the algos have won this one. We should get a new high on SPX momentarily. Will they be content with a notch higher or will they go for 2134? Watch your stops. Traders should dump their short positions here, though there’s a good chance it’ll settle back down after the higher high.
UPDATE: 12:05 PM
Hard to pick a target here, as SPX will likely turn soon and backtest 2106.2 (or, even 2104.34) before it gets too far away. But, given the (tiny) retrace at the small scale .886 at 2105, it’s likely targeting 2111.57 after the backtest. If you’re not already long at 2106, should get another shot at the backtest. Maybe the 5-min SMA20 (white) as it approaches.
Naturally, I’d be happier playing the downside after this, an algo-fueled ramp job that has no business being where it is. It’s a testament to the brokenness of the “markets” and the enormous control that the HFT algos possess.
But, seems pretty clear that, having come this far on relative vapor, they’re going to try for 2134.
UPDATE: 12:42 PM
SPX just tagged the SMA20 and 2106.2. This would be the first logical place for a turnaround if it’s going to make higher highs. The alternative would be the .886 at 2104.21 — the .886 of 2134-1867 that completed a Bat Pattern. Note that the 5-min SMA50 is there right now.
USDJPY has dipped below the SMA200, so I’d give it at least a 50:50 shot. UPDATE: 1:41 PM
SPX turned at 2106.18 — pretty close — and, just reached the 1.618. I’d switch back to short with very tight stops. UPDATE: 2:08 PM
I gave it a little leeway because ES hadn’t quite reached its 1.618, but it’s still going strong even after that milestone. Obviously stopped out on the short position.
 UPDATE: 2:37 PM
ES finally reached some resistance — the TL off this morning’s lows. And, USDJPY and CL are dipping below their 5-min SMAs. Would hazard a short here at 2115.70 — again, with tight stops. I’d dump it very quickly, however, if ES can’t dip below the white SMA20 and SPX gets propped up at the red SMA10.

 UPDATE: 3:40 PM
With CL silliness apparently over for the day, and USDJPY back below the SMA200, SPX is falling pretty sharply. We stand a pretty decent chance of getting back to 2104.
 UPDATE: 3:54 PM
Apparently I spoke too soon. CL just came back to life, putting the brakes on SPX’s decline. Touch and go, now. But, I’d stay short into the close.

In April 2012, I calculated the size of banks’ derivatives positions relative to their capital to show how small an upset it would take in the derivatives market to wipe out banks’ Tier 1 capital.
The results were pretty alarming. It would take only a 0.18% decline in the value of their collective $240 trillion derivatives portfolio to wipe out their Tier 1 capital.
 S&P’s announcement this evening that it had placed big US banks on Ratings Downgrade Watch got me to thinking. Have banks improved their financial stability, or are they still positioned on the eve of destruction?
First, it should be noted that it isn’t that easy to find Tier 1 capital anymore. The OCC now reports Total Risk-Based Capital, which includes Tier 2 items such as subordinated debt, asset revaluation reserves, undisclosed reserves and hybrid (debt/equity) capital instruments.
The upshot is that Total Risk-Based Capital is bigger than Tier 1 alone (from 5-18% bigger.) Regardless of whether or not the padding is warranted, we’ll ignore it for comparison purposes.
The 2015Q2 results can be seen in the chart below. Things have improved, but only slightly. JP Morgan and Bank of America significantly decreased the size of their reported (nominal) derivatives portfolios. And, each has roughly doubled their Wipeout Ratio.
Citibank and Goldman Sachs, on the other hand, barely decreased the size of their derivatives portfolios. And, their Tier 1 Capital increased only slightly. So, their Wipeout Ratios improved marginally.
The fact remains that, seven years after the financial crisis, the four largest banks are still extremely vulnerable to a fluctuation in the value of their derivatives. Theoretically, a 1/4 of 1% decline in the value of their derivatives would wipe out their capital.
Fortunately for them and their shareholders, the regulators don’t require them to mark derivatives to market anymore. They’re also able to net out (supposedly) offsetting positions without providing much, if any, proof that such offsetting is appropriate. From JP Morgan’s financial statements:
U.S. GAAP permits entities to present derivative receivables and derivative payables with the same counterparty and the related cash collateral receivables and payables on a net basis on the balance sheet when a legally enforceable master netting agreement exists.
In other words, if you have an agreement with the next Bear Stearns, AIG or Lehman wherein you promise to make each other whole when TSHTF, there’s no need to burden us with all the details. It’s enough to say that there’s no net exposure.
If any of these deceptions helps you sleep at night, God bless. The banks will gladly hold even more of your money and pay you next to nothing. Or, maybe they’ll start charging you for the privilege, as in parts of the eurozone.
Bottom line, S&P is probably making a big deal out of nothing. Though global derivatives still exceed $1 quadrillion (that’s 1,000 trillion or $1,000,000,000,000,000) and the capital of the biggest, strongest banks in the world are 0.25% away from being wiped out, there’s really nothing to worry about.*
* until there is
* * * * *
Announcing a $200 rebate for the first 5 new
Charter Annual Subscribers
who sign up by 6pm Tuesday.
Details and sign-up at: SIGN ME UP!
Announcing a $200 rebate for the first 5 new
Charter Annual Subscribers
who sign up by noon Tuesday.
Details and sign-up at: SIGN ME UP!
* * * * *
 I can still remember my first encounter, as a boy, with the ratchet wrench. Back then, things were still held together by nuts and bolts. These days, of course, we don’t bother to fix broken things. We toss ’em or, if we’re especially enviro-conscious, load them in the Yukon and drive them to the recycling center.
The ratchet wrench was cool. You could quickly take apart and reassemble your bicycle, your sister’s roller skates, even a 1970 Camaro. Instead of bruising your knuckles with an angle or combination wrench — with the constant removing and refitting of the wrench over the nut — you slipped a socket over the nut just once and cranked it back and forth.
Despite the fact that you were moving it back and forth, both clockwise and counterclockwise, it would only tighten or loosen — whichever you wanted it to do.
The ratchet was invented way back in 1913 by Robert Owen Jr. in Shawnee, Ohio. It must have been a godsend to manufacturers back then. I’m willing to bet that Mr. Owen never dreamed that, 102 years later, it would be used to prop up the stock “market.”
* * * * *
Regular readers of this site know that the USDJPY is the most commonly-used tool to keep stocks on the rise. [see: What Really Drives Stocks?] But, what happens when USDJPY levels out? It stands to reason that stocks would, too.
 USDJPY, like a ratchet, can be used to force stocks in only one direction (up, obviously), even while it’s swinging back and forth. The trick is to bring it back down in the low-volume hours after the “market” closes, when the futures are much more easily manipulated. The past two weeks offer a great example.
SPX had rebounded to the top of the channel which originally guided prices lower (white arrow, below.) It was also approaching its 100-day and 200-day moving averages — serious overhead resistance. TPTB needed a way to get it up past all that resistance in order to have a shot at new highs. The USDJPD has been extremely helpful in this regard. But, for whatever reason, the BoJ hasn’t seen fit to expand QQE. It has been stuck going sideways for over 10 months. This is where the ratchet comes in.
USDJPY is ramped higher in the 30-60 minutes before the cash “market” opens, and continues to rise until the cash close. This, of course, drives SPX higher during the hours in which it’s quoted.
Then, as soon as the books are closed on another gain for SPX (or, big losses are averted) USDJPY is reset lower where it can repeat the whole exercise again the following day. Rinse and repeat.
The cash hours are highlighted in the USDJPY chart below, making it easy to see that SPX (in white) benefits from USDJPY’s gains, but never suffers from its overnight retrenchments.
 When USDJPY can’t perform, for whatever reason, CL is only too glad to do levitating duty. Just this morning, it rose from a low of 45.56 to a high of 46.73 in four distinct periods, each of which lines up with ES/SPX’s need to avert a reversal at or leap over a point of natural resistance.
A 1.17 gain may not seem all that much, but it’s a 2.57% move — the equivalent of 54 points on SPX. And, the entire move happened in about 2-1/2 hours — for no particular reason, of course, just that it was necessary in order to prop up stocks.
Ratcheting worked pretty well today. Between USDJPY and CL, SPX got all the way back to 2104 — the 88.6% retracement of the drop from 2134 last May to 1867 in late August. This is quite a feat. It would be all the more impressive if it didn’t tank, now that it has completed a Bat Pattern.
Stay tuned…
Announcing a $200 rebate for the next 5 new
Charter Annual Subscribers
who sign up by noon tomorrow.
Details and sign-up at: SIGN ME UP!
* * * * *
Yesterday’s 8-point decline in ES was elevated to a 4-point gain overnight as ECB’s Ewald Nowotny talked up the need for more QE.  ES had clearly broken trend.
 It was also enough to prompt a rebound in USDJPY, which had also broken trend.
  When all else fails, overnight ramp jobs are a very effective way of forcing “markets” higher. But, it doesn’t change the fact that an important event occurred last week.
continued for members… (more…)
MEMBERSHIP SPECIAL
$200 REBATE FOR FIRST 5 NEW
CHARTER ANNUAL MEMBERS.
ONLY $999 FOR YOUR FIRST YEAR*
Following our recent results, several members (as well as a few lurkers) have inquired about another annual membership promotion. We got a great response to the last one, so we’ll give it another go.
With this promotion, we’re offering Charter Annual Memberships at $1,199. And, for a limited time, we’re rebating $200 on your first year. That works out to only $999, less than $3/day. You probably spend more on your morning coffee.
It’s $751 off a regular annual subscription, and a whopping $1,401 off a monthly subscription at the current rate of $200/month.
Best of all, your rate will never increase for the life of the site for as long as you remain a member. As members who are still paying $500/year would tell you, this aspect alone makes this a great offer.
Annual memberships have increased about $100 every month, and are slated to increase to between $2,000-2,500 by early 2016. Lock in your subscription cost now!
Note: If you’re already a monthly/quarterly/semi-annual member, we’ll add your new year to your existing membership. Your annual price will still be locked for life.
We are also increasing referral incentives during this promotion. Send a friend our way, and we’ll credit you $300 when they subscribe to an annual membership.
If you’re a new member, ask a friend to join too and split the savings. There’s no limit, so if you have at least a few friends you could end up with a free membership.
* subsequent years are at the discounted rate of $1,199. This offer good through 12pm EST on Nov 3!
Last Halloween, the BoJ treated the “markets” with an enormous increase in QQE that sent USDJPY soaring 15% over the next few months. Thanks to the magic of the yen carry trade, it stopped the October meltdown dead in its tracks and enabled stocks to reach new all-time highs. Last night, with most pundits expecting a repeat performance, Kuroda & Co balked. No increase in purchases. No expansion of allowable investments. No new fuel for the carry trade fire. Nothing.
USDJPY, predictably, fell back below the SMA200.  Just as importantly, DX fell back within its falling channel.
 About the only thing propping up stocks this morning is good old-fashioned currency manipulation. That’s right. The BoJ didn’t discontinue that!
While QQE certainly supports a cheaper yen, and the BoJ’s direct purchases of stocks (which will continue as before) obviously prop up the “markets,” it’s the act of manipulating the USDJPY higher that has enabled the yen carry trade’s success.
It has, can, and will continue to be utilized to push stocks higher and prevent dips whenever they see fit. The only question is whether the rest of the carry trade investing world will stay the course given last night’s inaction by the BoJ.
We’re talking trillions of dollars around the world that are directly and indirectly tied to a ever-cheaper yen. Right now, some of those investors are quaking in their shoes. The risk is a tsunami that even the highest seawall can’t contain.
continued for members… (more…)
![]() Sometimes USDJPY isn’t up to the task of levitating the “market” all by itself. Take yesterday, for example. It had already ramped as high as it could in order to convince muppets that, by maintaining ZIRP, Yellen & Co. weren’t at all nervous about the recovery. In fact, they are really, really confident that things are improving.
Sometimes USDJPY isn’t up to the task of levitating the “market” all by itself. Take yesterday, for example. It had already ramped as high as it could in order to convince muppets that, by maintaining ZIRP, Yellen & Co. weren’t at all nervous about the recovery. In fact, they are really, really confident that things are improving.
So, this morning, with USDJPY already pegged at the top of the speedometer, it was up to CL to do the ramping. With the futures off 12 points, CL started climbing off the 45.25 floor at which it had been propped up overnight.
Between 8:25 and 9:00am, CL spiked nearly 3% — the equivalent of 60 points on the S&P500 or 500 on the Dow. There was no news in the oil market, just a slight miss in initial claims and GDP. It was enough to reduce the ES’ loss to about 7 points.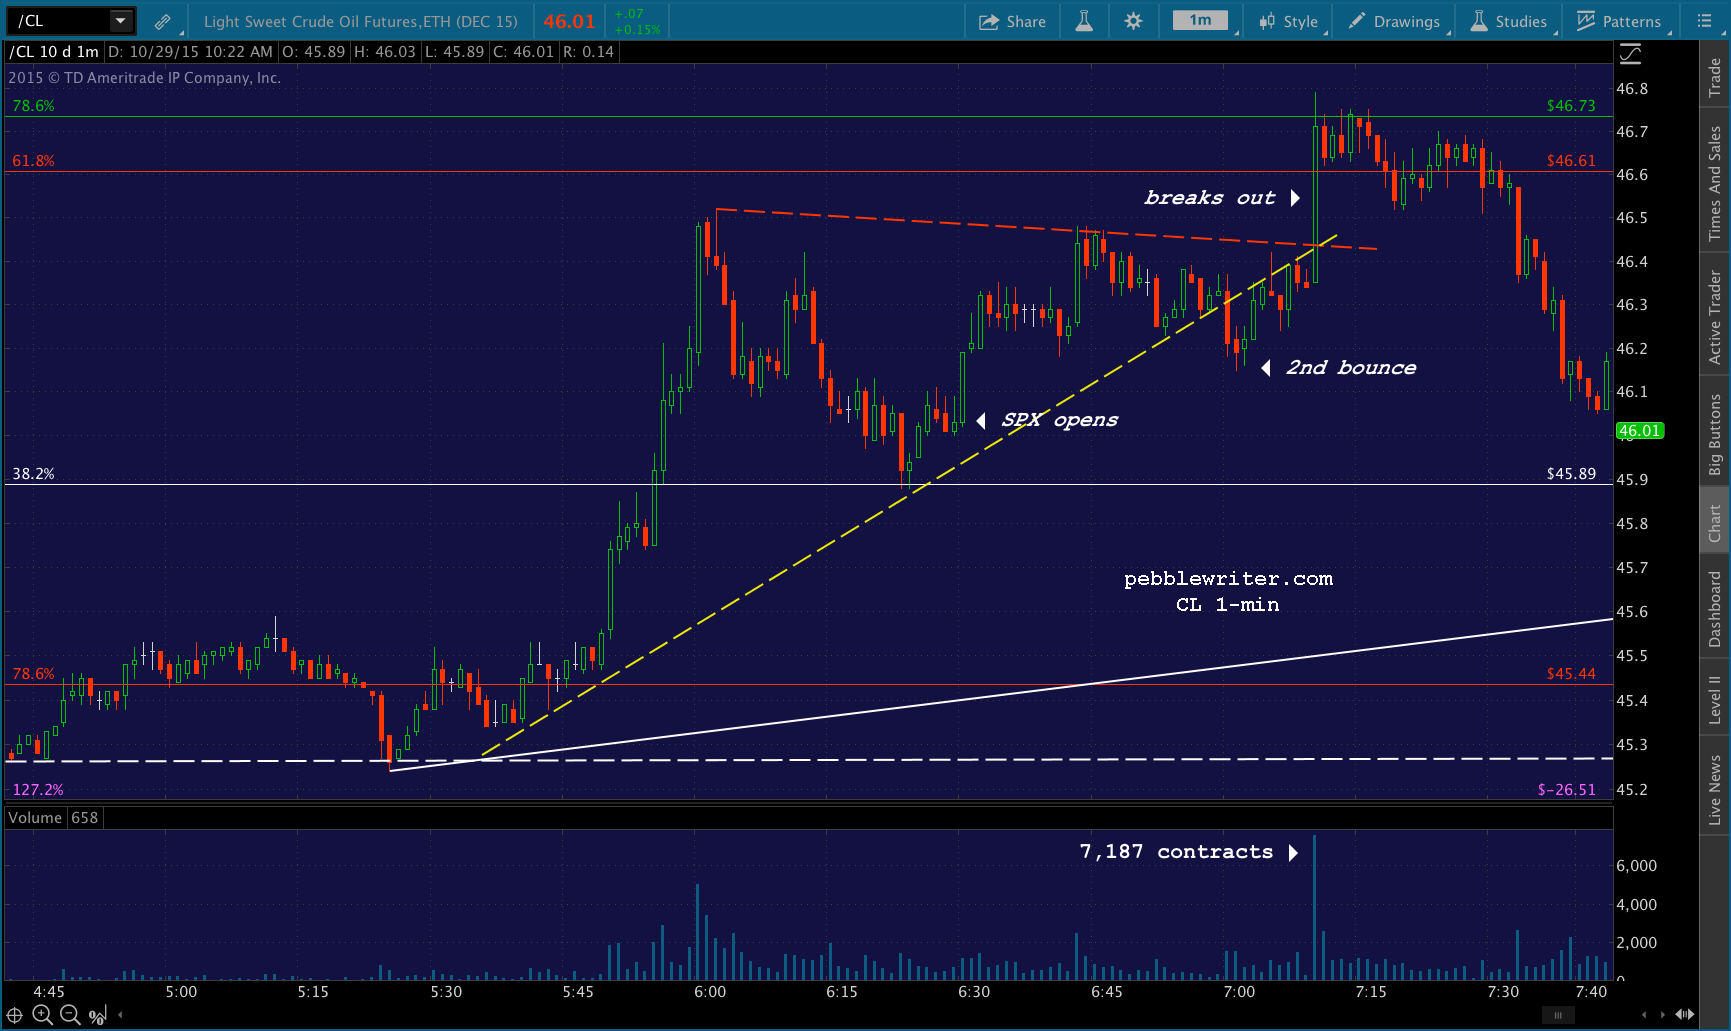 Apparently, that was enough. Because CL was allowed to settle back down over the next 30 minutes, until the “market” opened. At that point, it was off to the races again — only 2% this time.
The effect was to limit SPX’s initial decline on the open: a drop of only 6 points to 2084.12. From there, it bounced a bit, then resumed falling for the obvious target — a backtest of the .786 Fib it had topped the day before. This drop was supported by CL, which had broken down below the trend line off the morning’s lows (yellow, dashed in the chart above.)
But, a funny thing happened when SPX reached 2084.14 — 2 pennies above the initial low. CL suddenly reversed. In fact, it reversed back through the broken red TL, back through the red TL, and all the way up to the highs of the day.
Naturally, SPX stopped falling, and bounced back to test the previous day’s highs. It was the last 1-min candle that caught my attention.  The 1-min bar at 10:10 spiked a sudden 1.07 points — the equivalent of .0512%. It’s not all that much, but it nearly resulted in new highs for SPX. And, in dollar terms, it represented a $8.7 billion increase in the market cap of the S&P 500.
I got to wondering, what was it that suddenly boosted the value of the S&P 500 by $8.7 billion?
The answer is in the CL chart above. In that one, single minute at 10:10 AM, CL suddenly shot higher by 0.45.
Not to wear out the analogy, but that’s the equivalent of 20 SPX points or 170 Dow points. That’s a pretty big move in one minute. How was it accomplished?
At 10:10, the total volume of CL traded on NYMEX was 7,187 contracts. If, say, 80% of that volume was in service of driving prices higher, that works out to about $27 million in margin. I’m probably being generous, as the 24X increase from 292 contracts traded at 8:29 was no doubt much more than was needed to overwhelm the “market” for CL.
Bottom line: for a $27 million (probably much less) investment, someone created $8.7 billion in “value” in the S&P 500. Once the tide was turned, the game was much easier.
I just snapped a picture of time and sales for CL, and it’s startling how such minuscule volume can keep prices on the rise.
 These are 1-2 contracts trading at a time, typically adding up to 2-300 per minute during the day.
The next time one of the talking heads holds forth on investor confidence or some such rubbish, remember that it’s probably a lousy $10-20 million in USDJPY or crude futures that’s really responsible.
Sigh…
If the “market” is driven higher by blatant manipulation, in clear defiance of the fundamental laws of economics, does it still count as a rally?
Yesterday, the FOMC delivered a near carbon copy of its Sep 17 missive — the one that precipitated a 148-pt ( 7.3%) decline in SPX. Sure enough, SPX fell immediately after the press release. But, this time, central bankers were better prepared.
They started by pushing CL up and out of a well-defined falling channel. It would go on to rise 8.5% in less than 24 hours, and is up 9.2% as we go to press. Also within minutes, USDJPY was ramped (out of its well-defined falling channel) up to and over its 200-day moving average.
 Needless to say, SPX reversed its initial 21-pt sell-off and spent the rest of the day playing Follow the Algos. It finished well above its .786 Fib — the first one since the September lows that showed any promised of providing at least a modest retracement.
But, consider the chart below — which shows USDJPY’s 5 previous tags of the dashed, red trend line. ES – the thin purple line – didn’t react all that kindly in the past. Is there any reason to expect it will this time?
 continued for members… (more…)
Two of the most bearish things that can happen to an index are when either a rising channel or a rising wedge break down. For COMP, both happened on August 21. After having already lost 7% since its July highs, it plunged another 12% over the next two sessions. Things were looking rather bleak.
 In our September 15 update, I noted that it had climbed back up to reach important resistance:
Exacerbating the situation is the fact that the bounce since Aug 24 has reached, just today, the .618 retracement of the drop from the Jul 20 highs. What’s more, it has backtested an important internal TL (yellow, dashed) connecting many key highs and lows since last November.
It’s a precarious situation for COMP. Any of those features could, alone, be responsible for a downturn here. If, on the other hand, the FOMC bails on the idea of higher interest rates in a couple of days, we could easily see all that resistance melt away.
I put an upside target at the red TL (the white circle above) and waited to see what happened.
Two days later, the FOMC decided that interest rates were just fine where they were for the time being, and COMP shot directly to our target — only to promptly reverse and plunge nearly 10%. continued for members… (more…)