Month: August 2026

  • No Jobs

    The jobs print came in at a stunning 23K drop (versus a consensus +86K gain.)
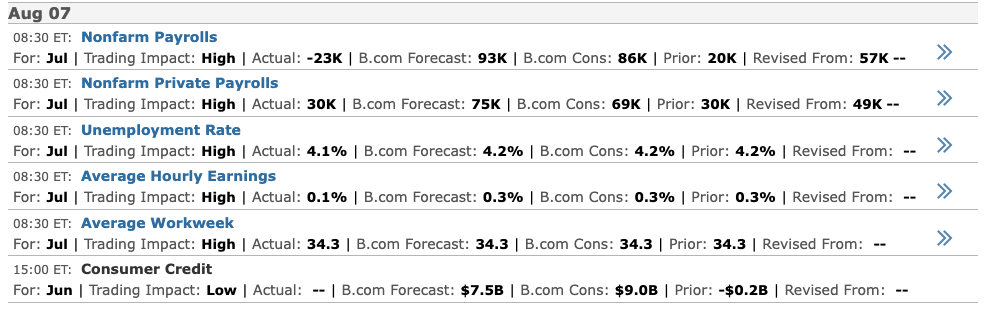
    It was stunning because it potentially represents a change in strategy by the White House. Are they finally willing to admit a less than stellar job market in order to force interest rates lower and stock prices higher?
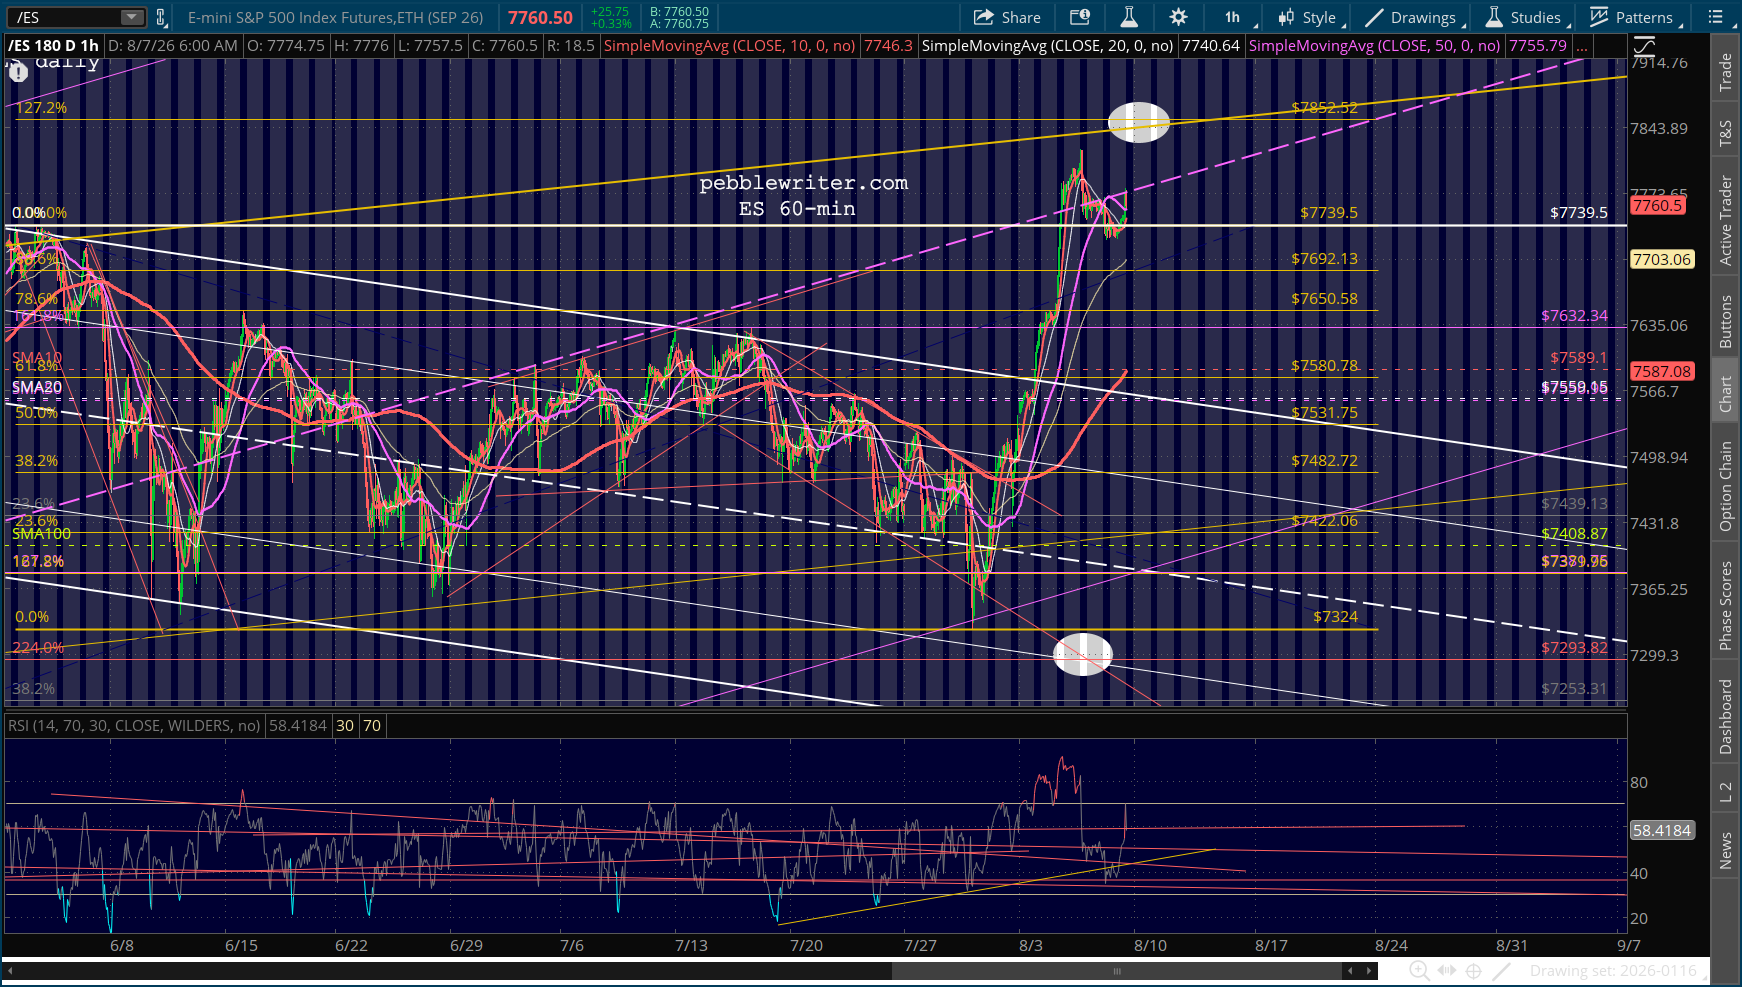
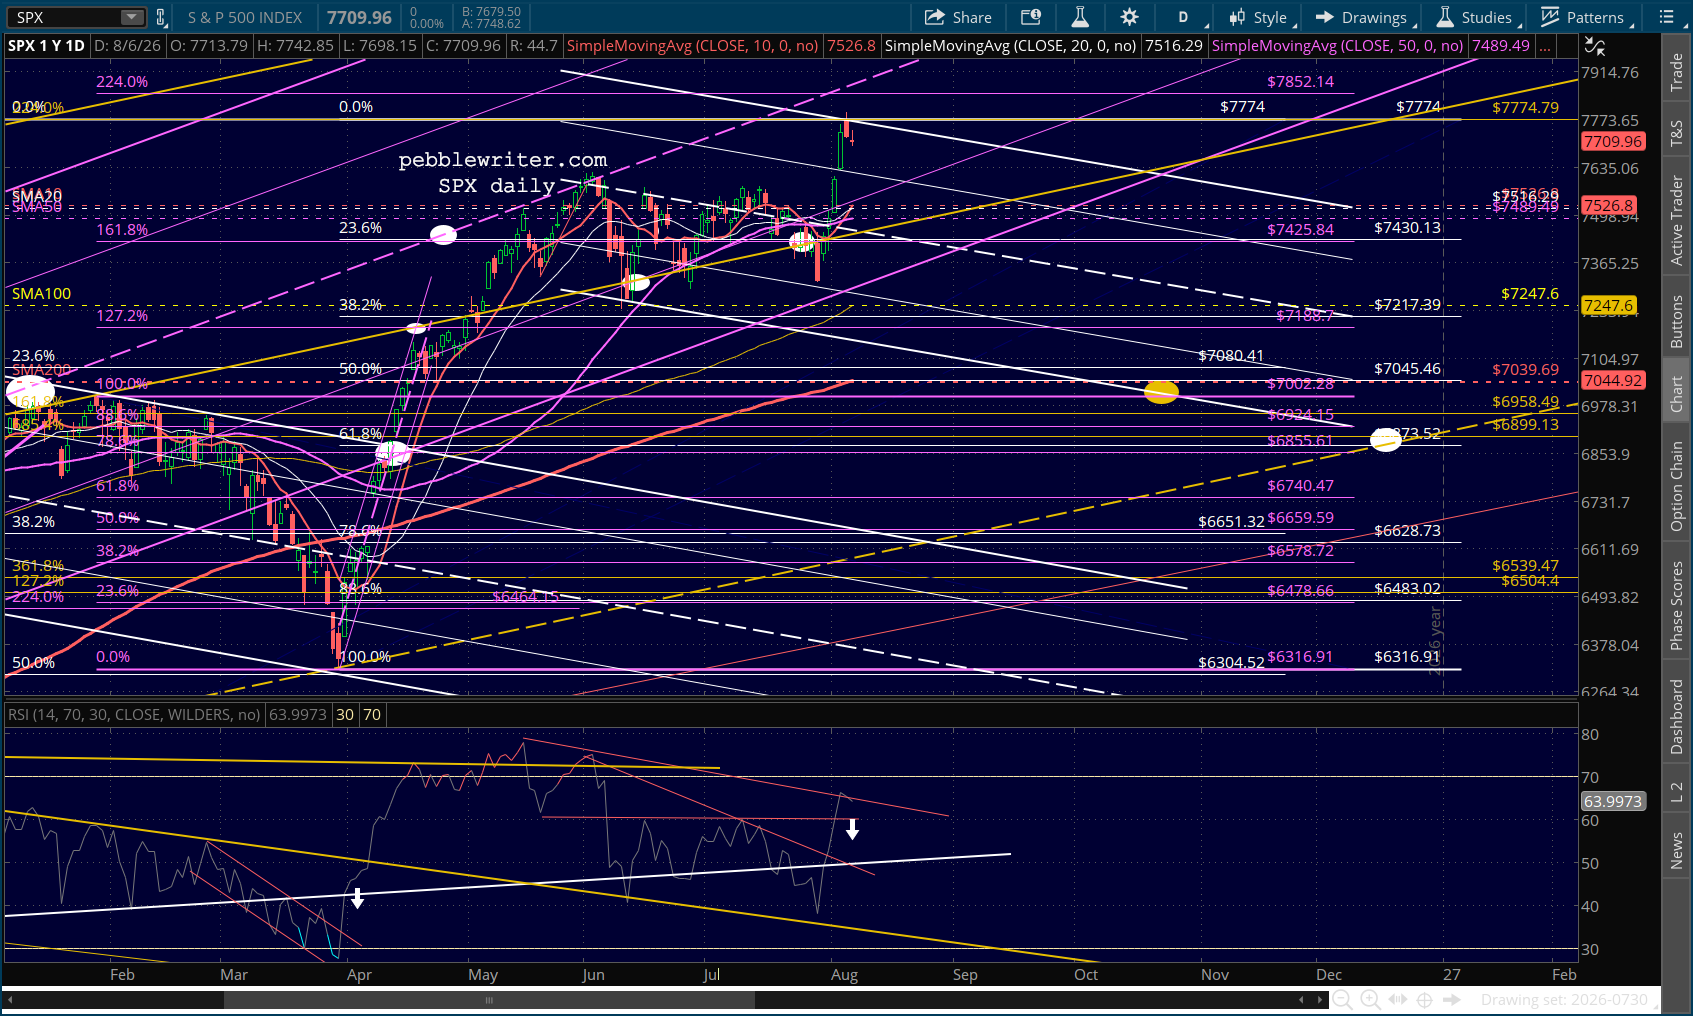
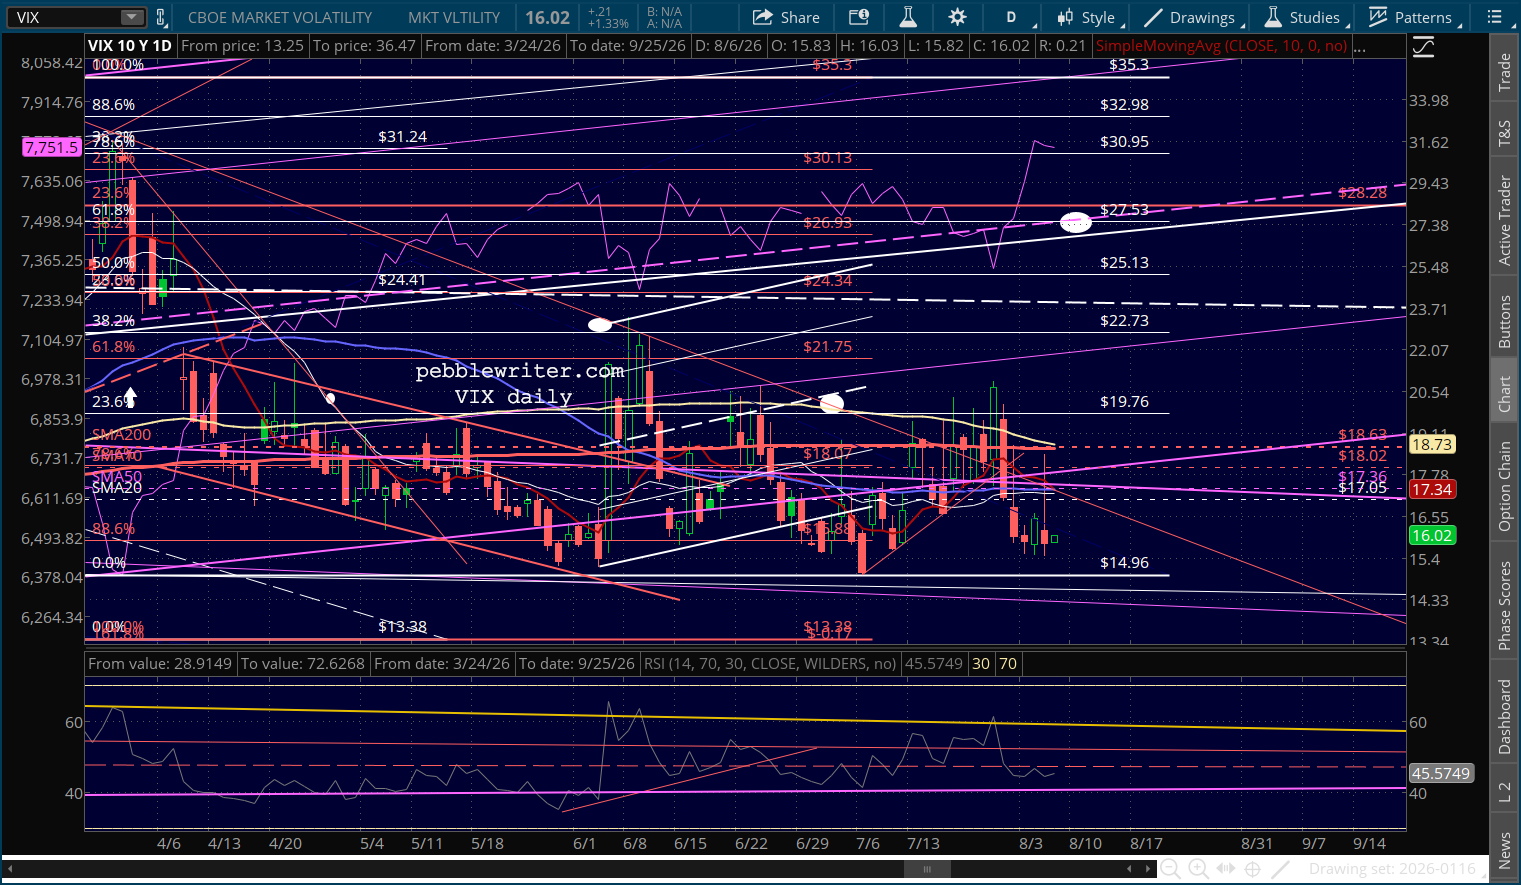
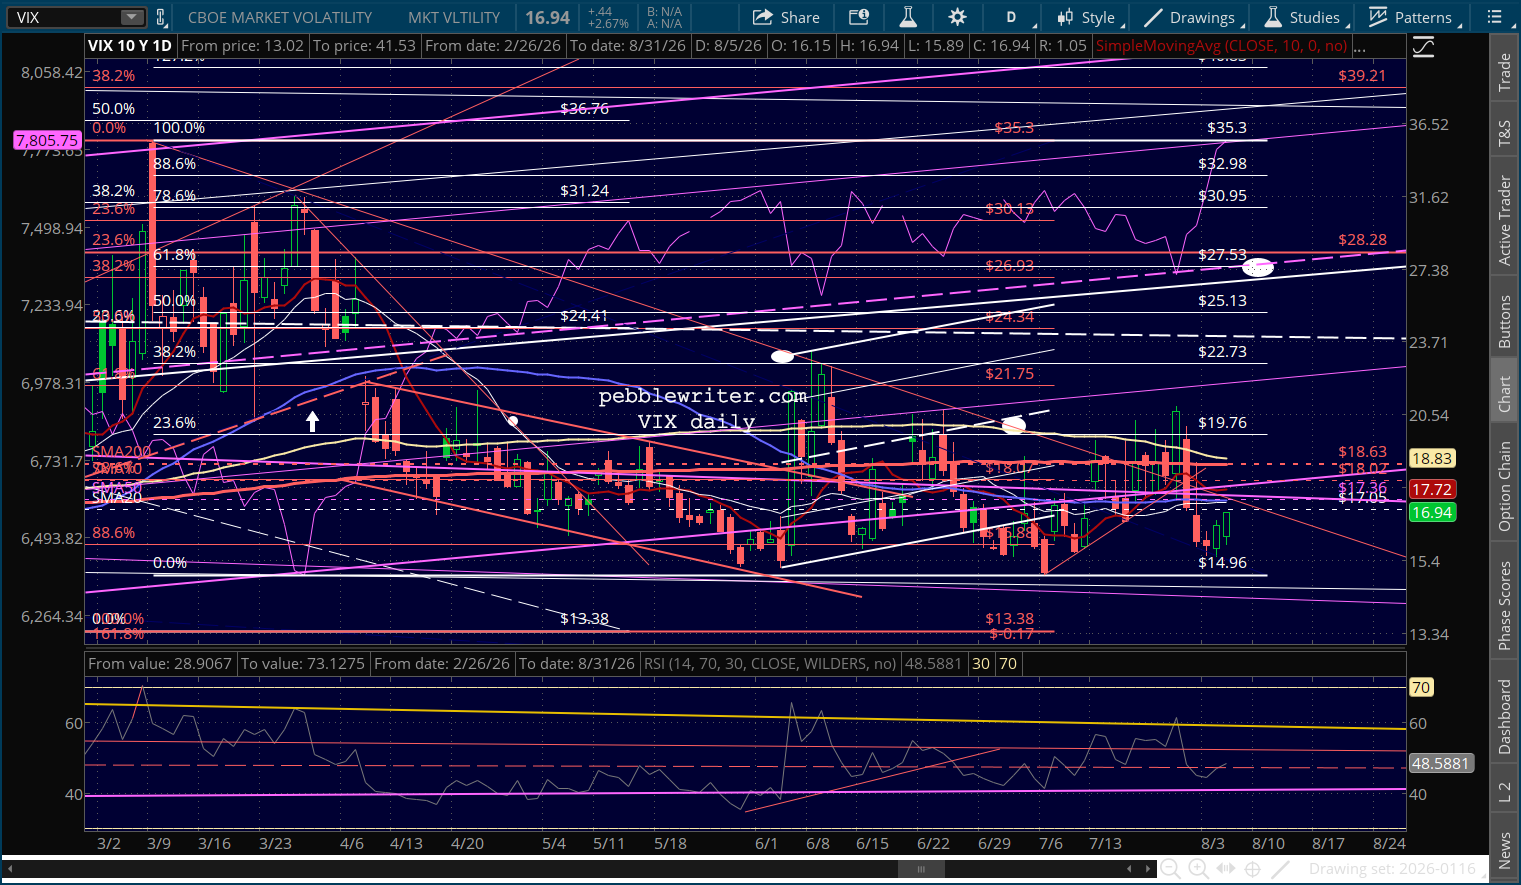
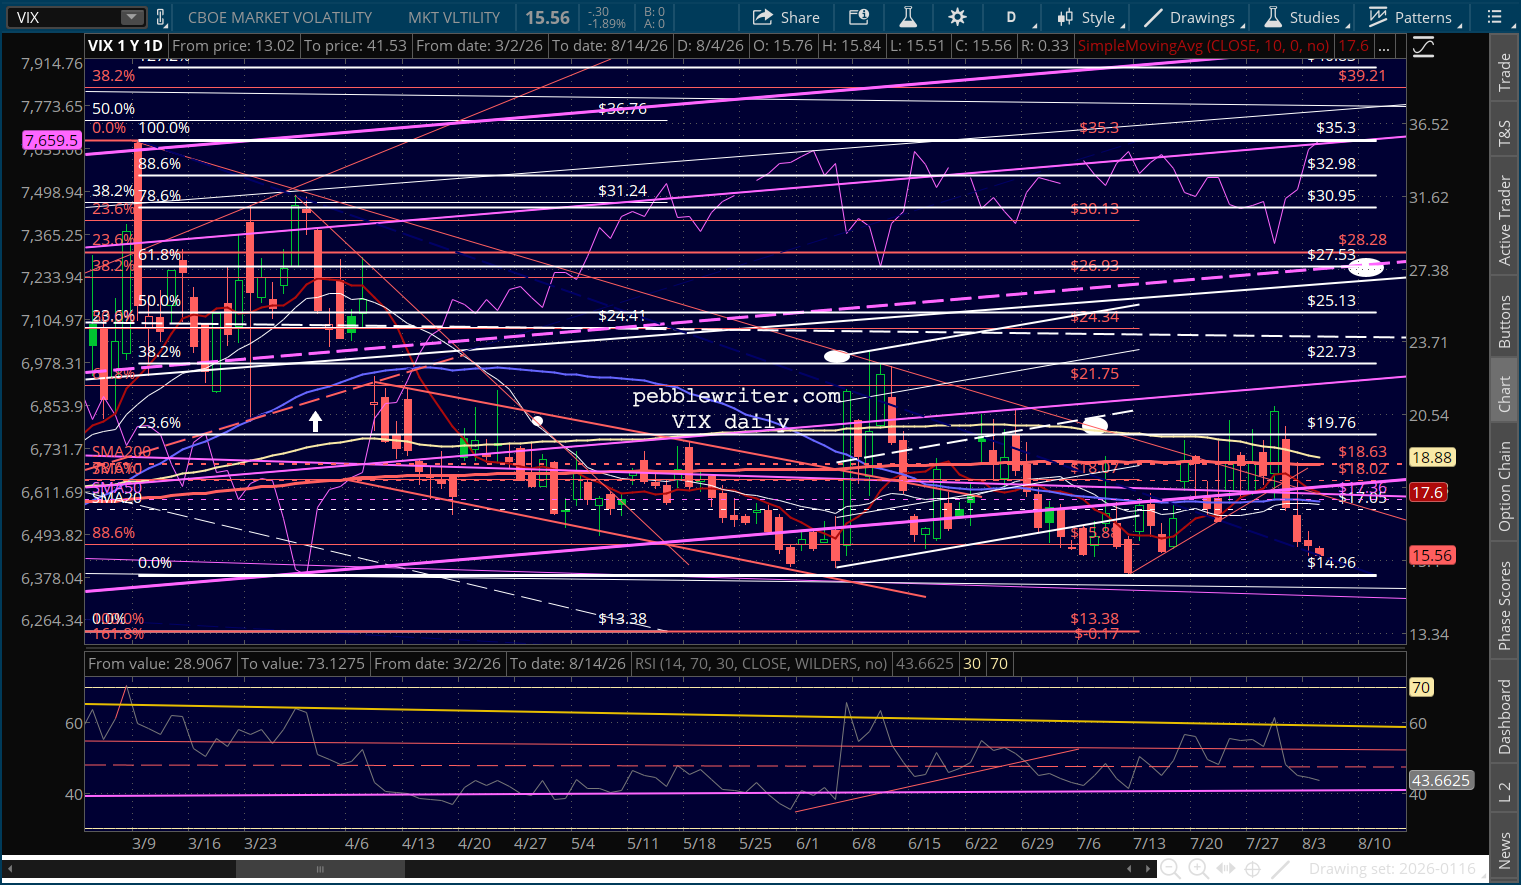
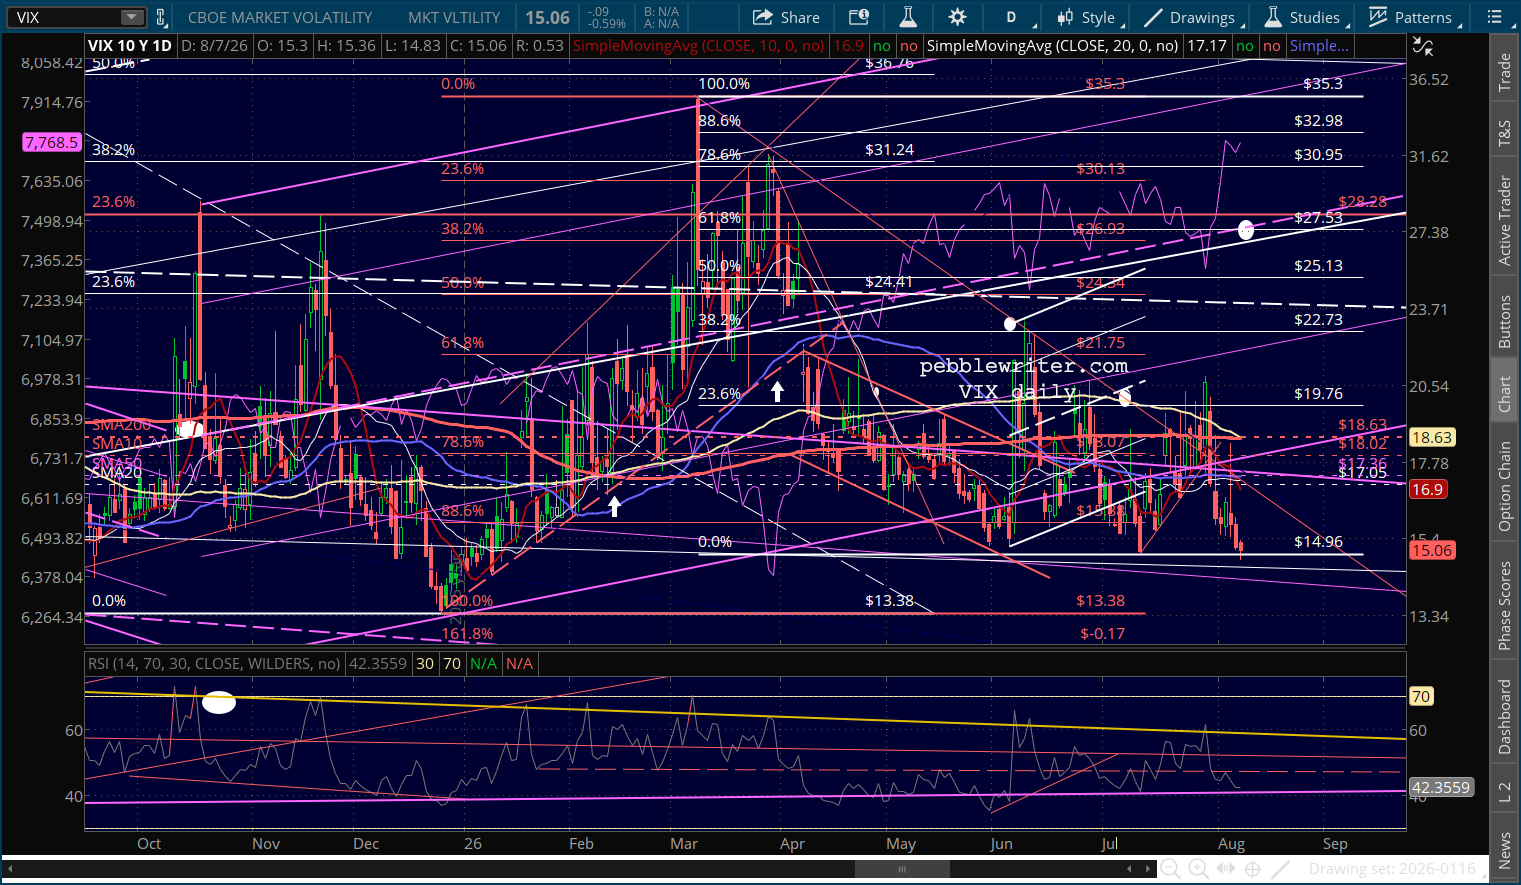
    It helped to force VIX to the lowest value since early January.  From the 18.43 backtest of the SMA200 two sessions ago to new lows? Yeah, okay. Why not?
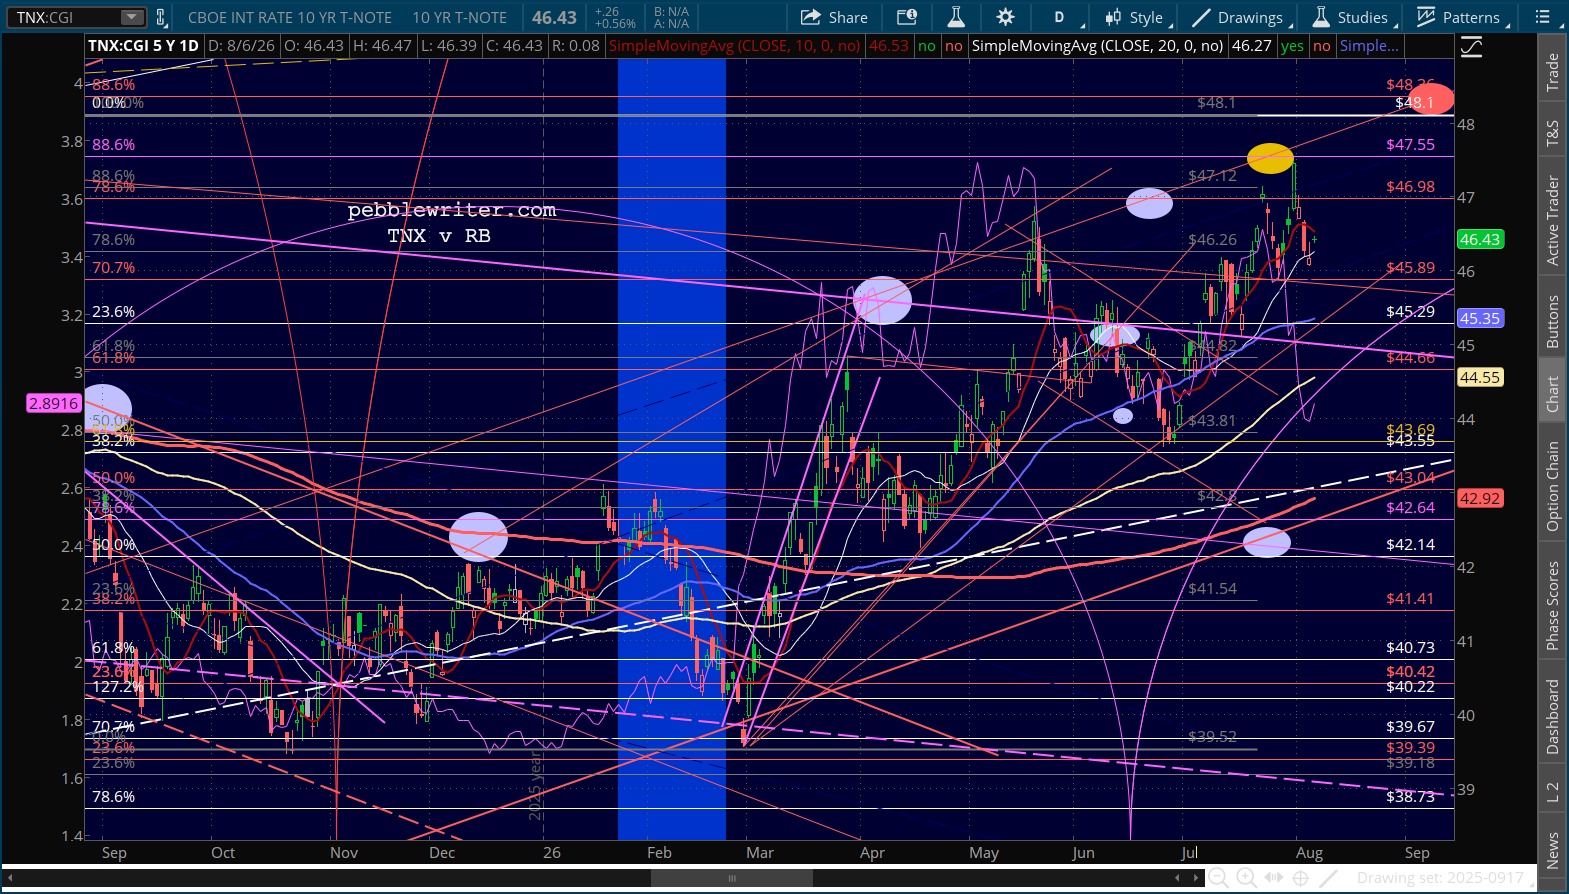
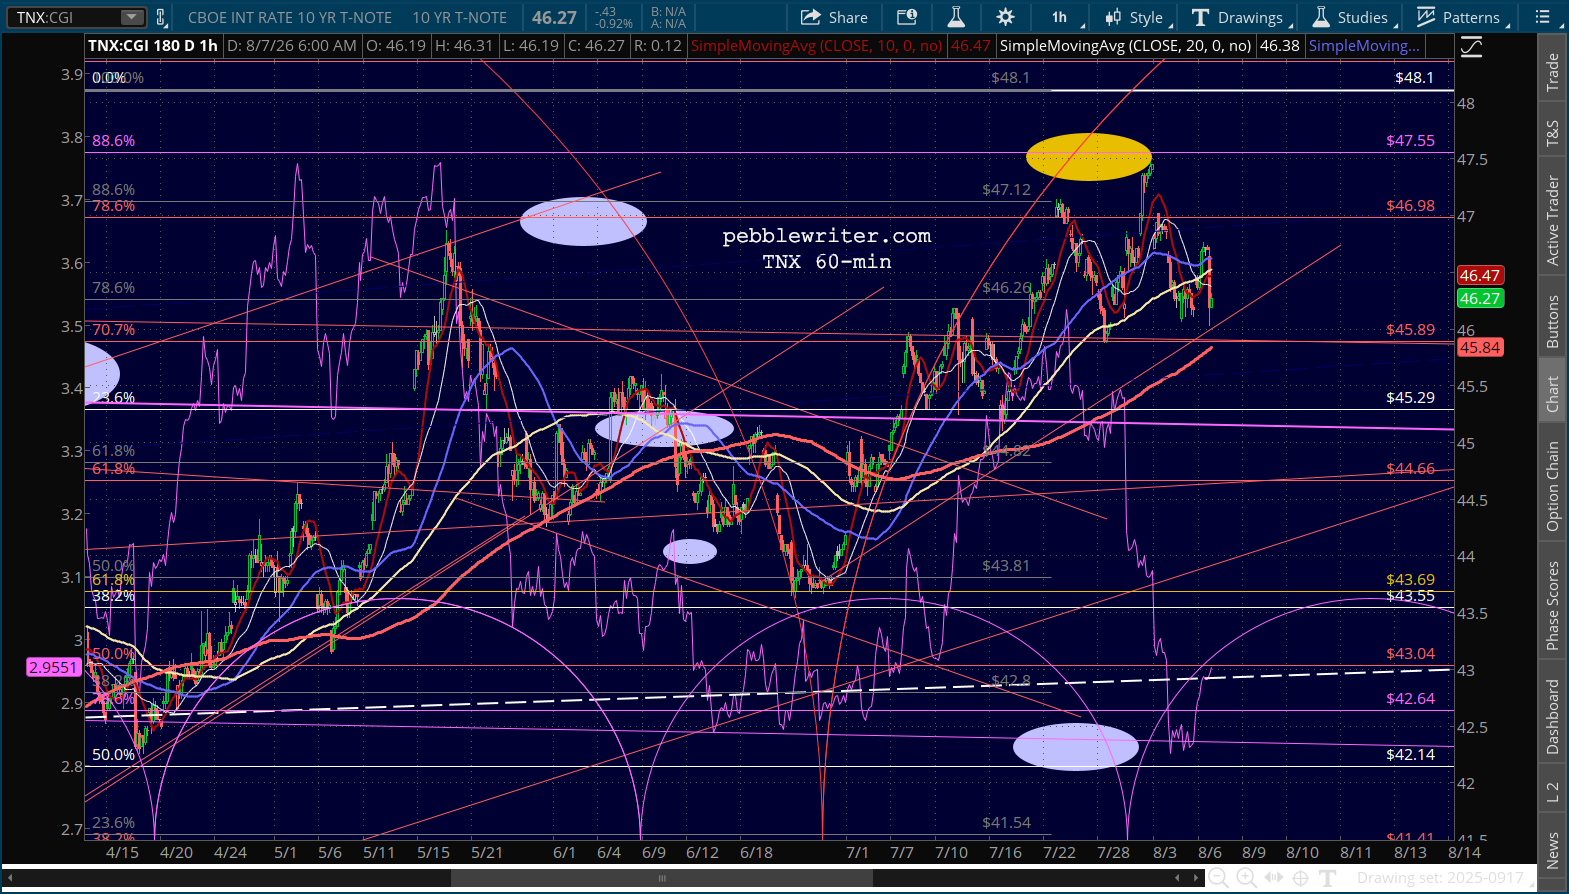
    Even though the 10Y cratered on the print, it didn’t break down below the TL from mid-June.  Remember, the cycle high was 4.75% at the end of July. So, 4.60 is a nice move. But, even if the trend line fails, we still have the SMA200 support just below at 4.58%.
    This being Friday, it wouldn’t be surprising to see some truth about the lack of a deal in Iran sneak out…followed, of course, by a social media post before the market opens on Monday that we are ever so close to a great deal.
  • Charts I’m Watching: Aug 6, 2026

    Futures are flat again in advance of tomorrow’s jobs report.

  • Charts I’m Watching: Aug 5, 2026

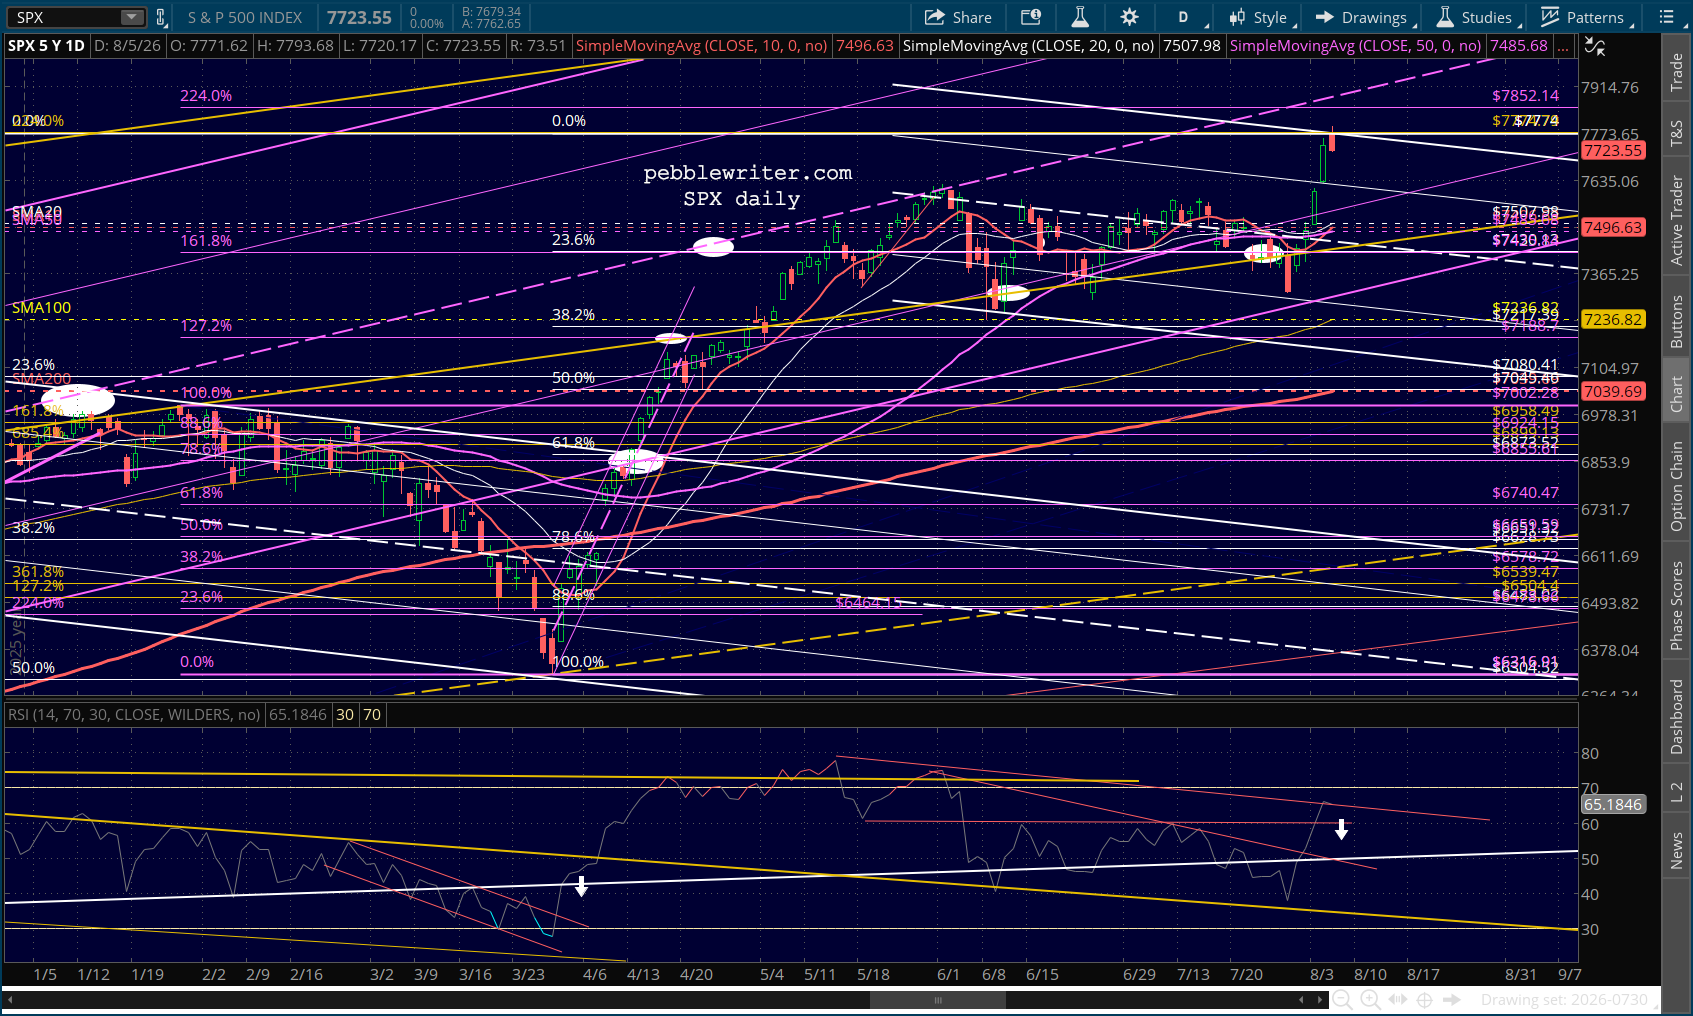
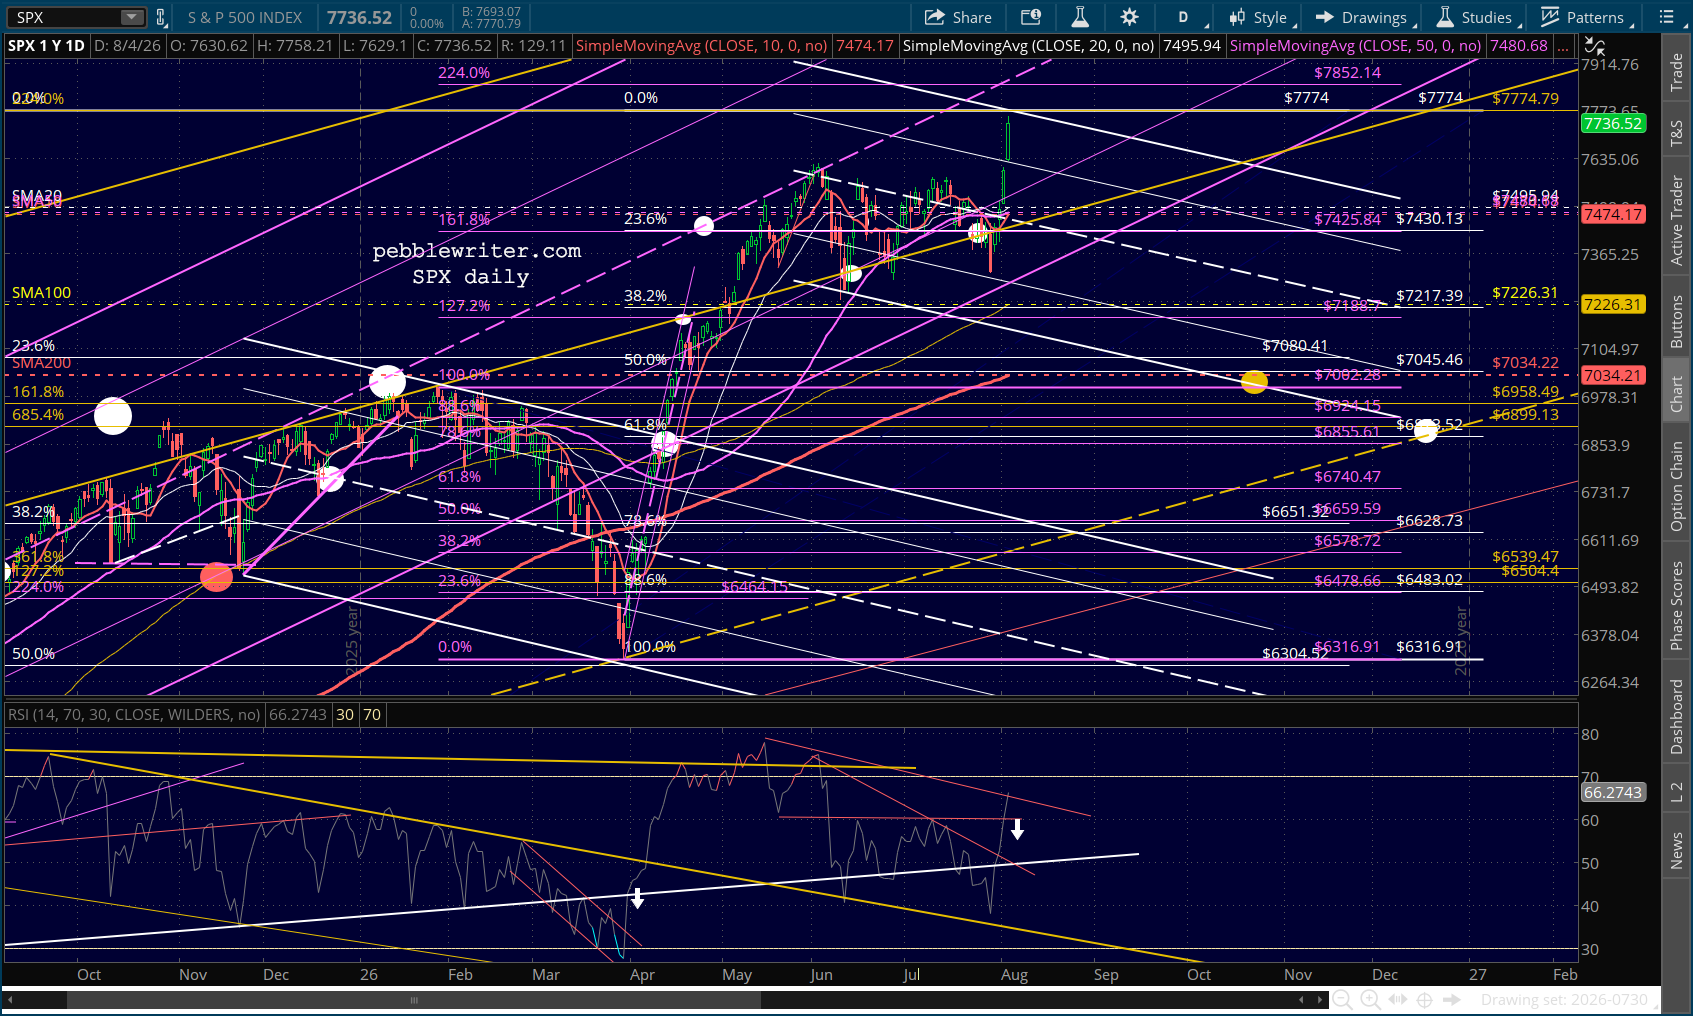
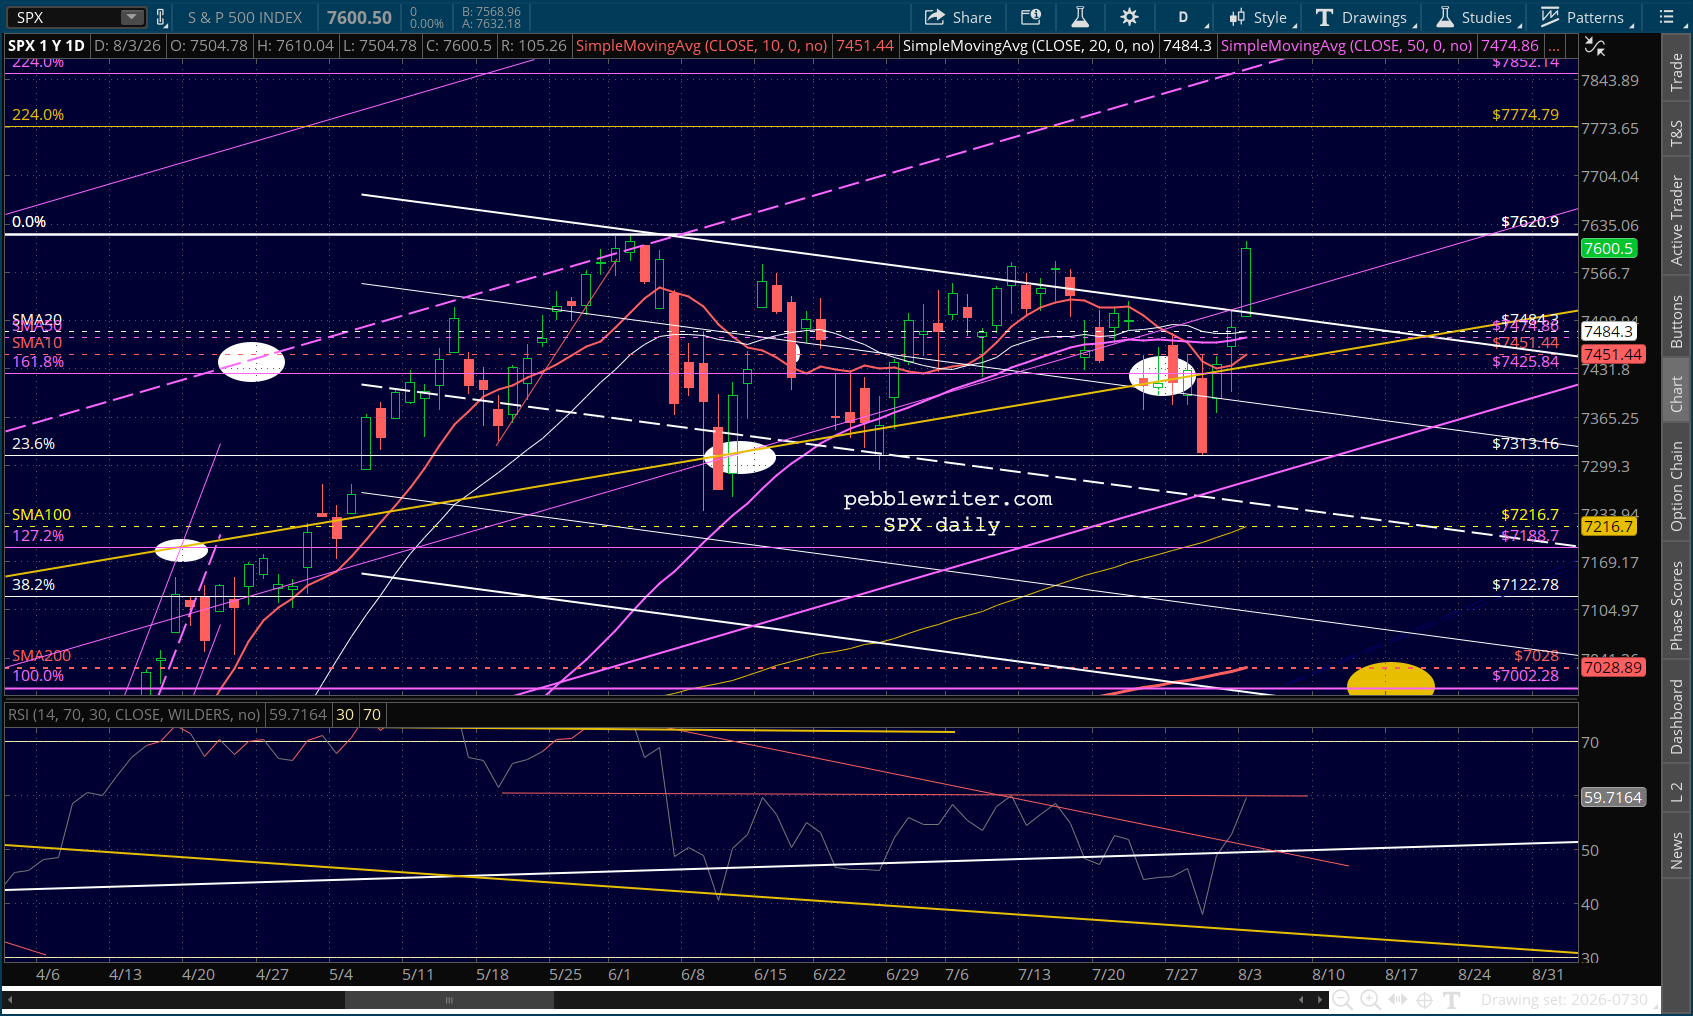
    SPX broke out yesterday, driven by a sharp decline in oil prices and in VIX. It landed just shy of the 2.24 Fib extension while exhibiting pretty striking negative divergence. As a result, any disappointment re the supposed “deal” with Iran could result in a sharp pullback.

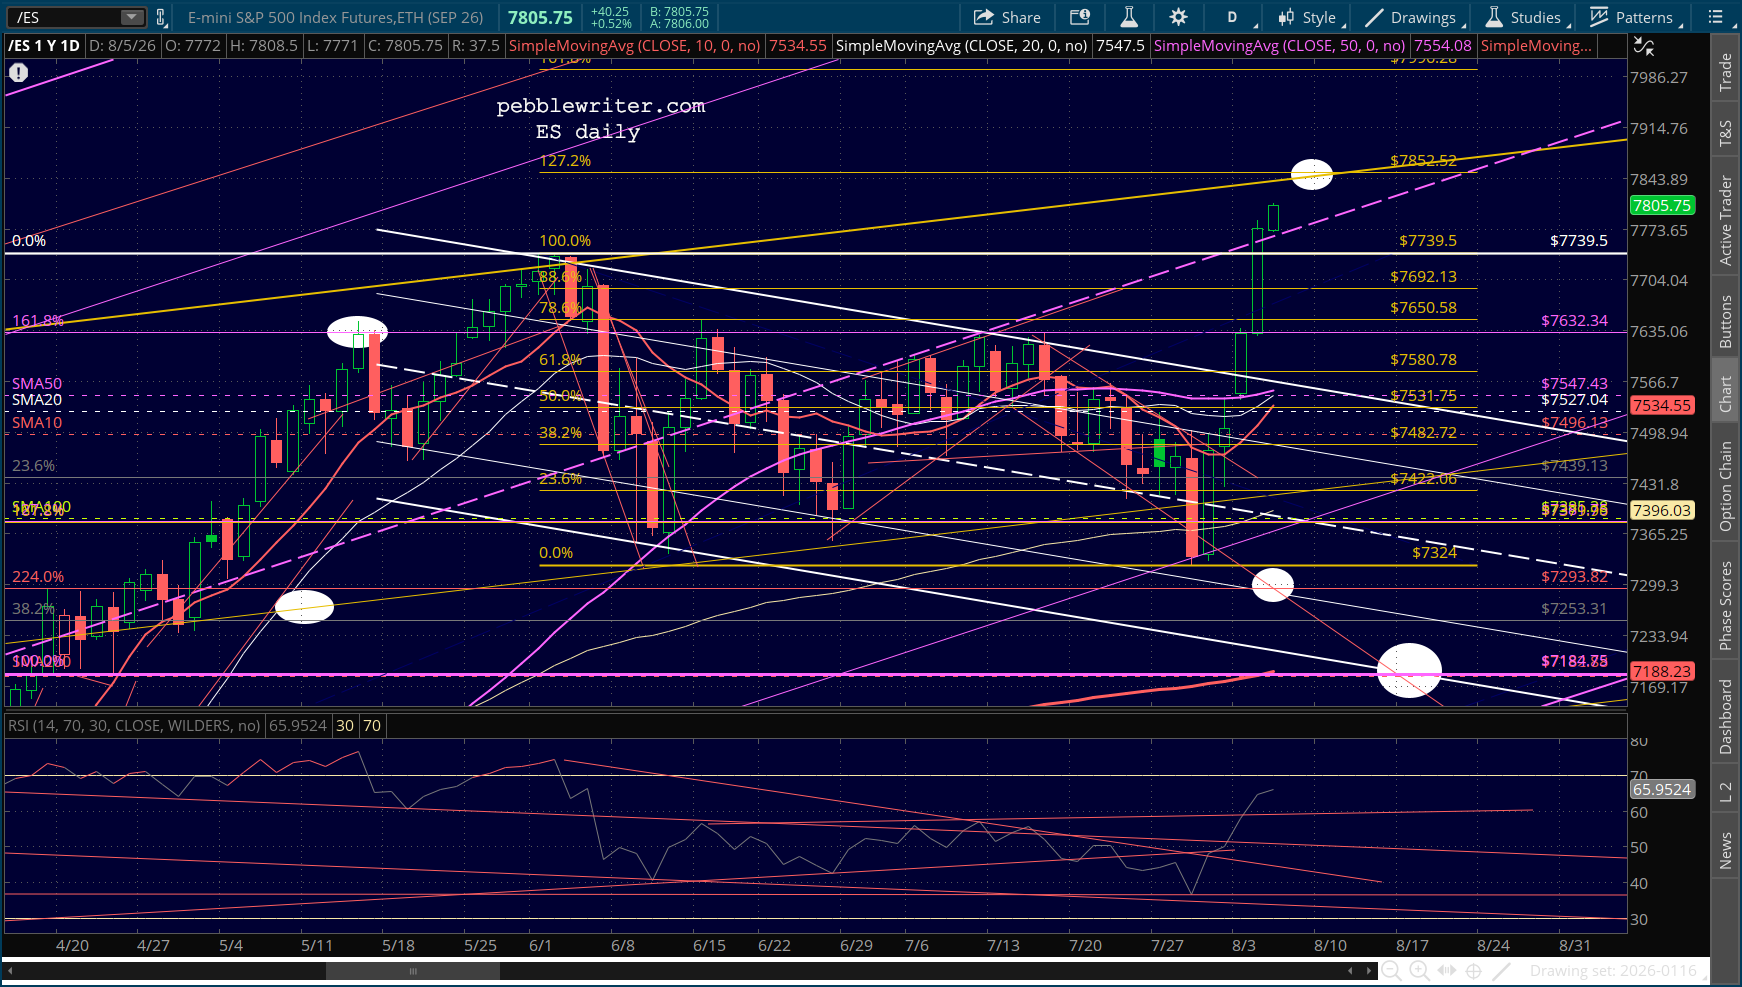
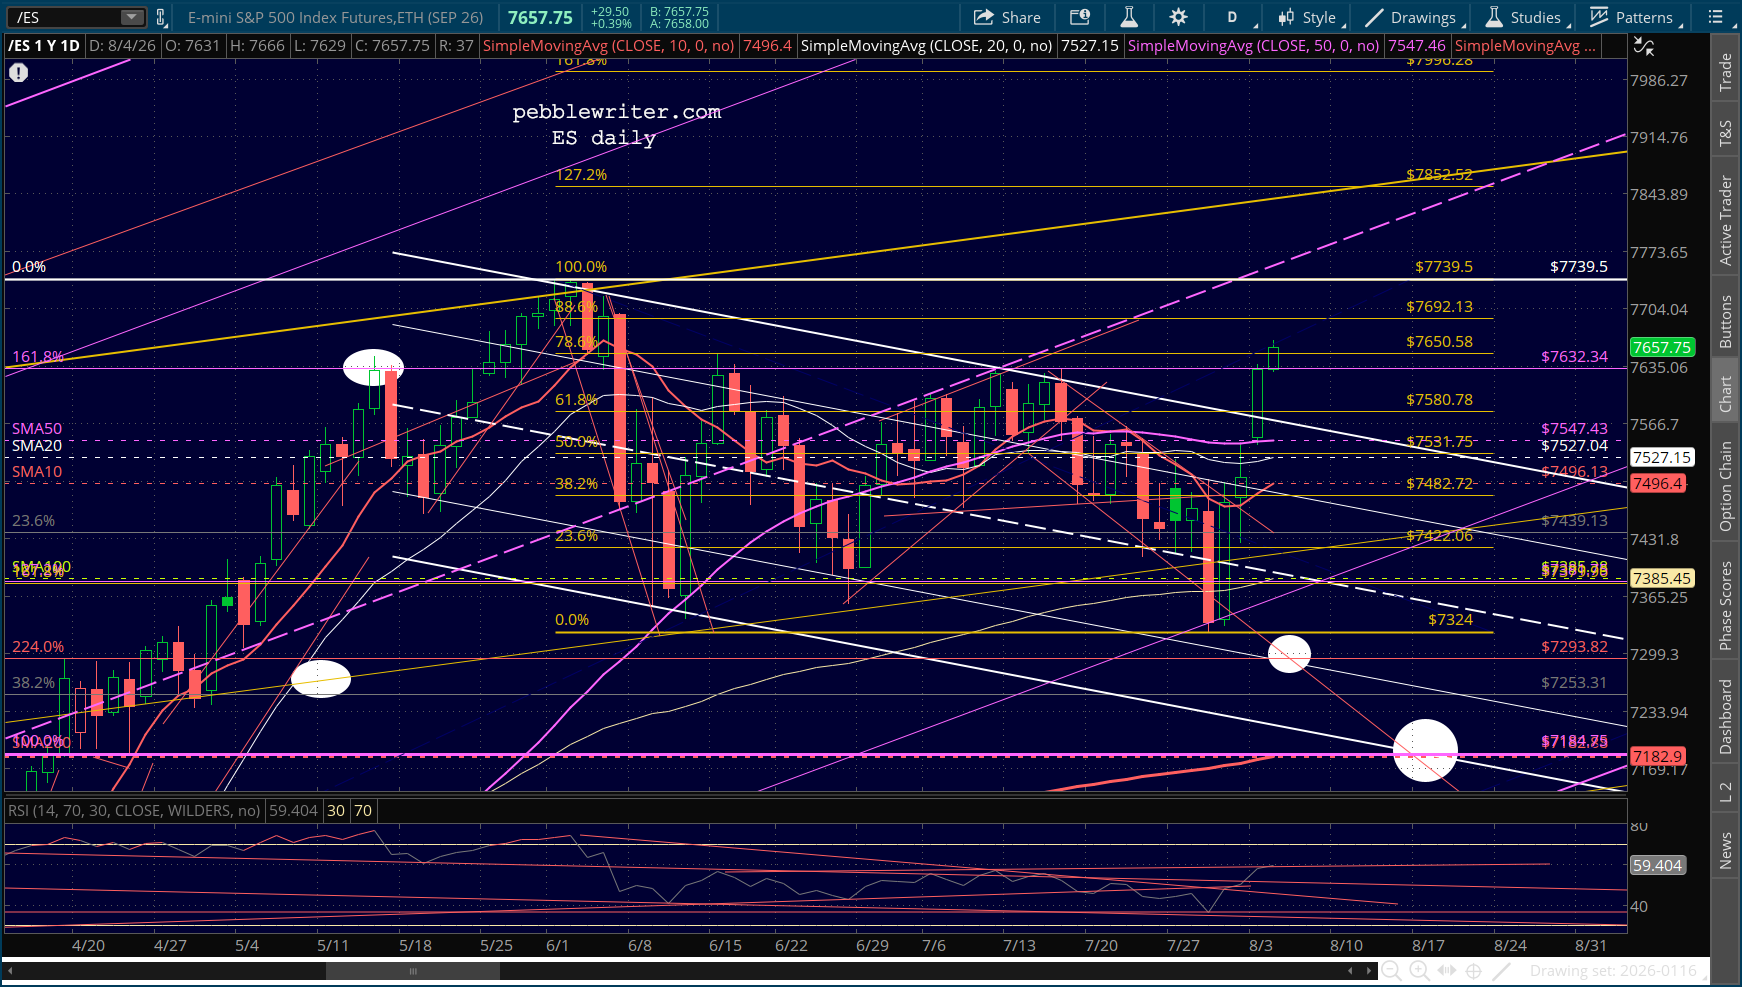
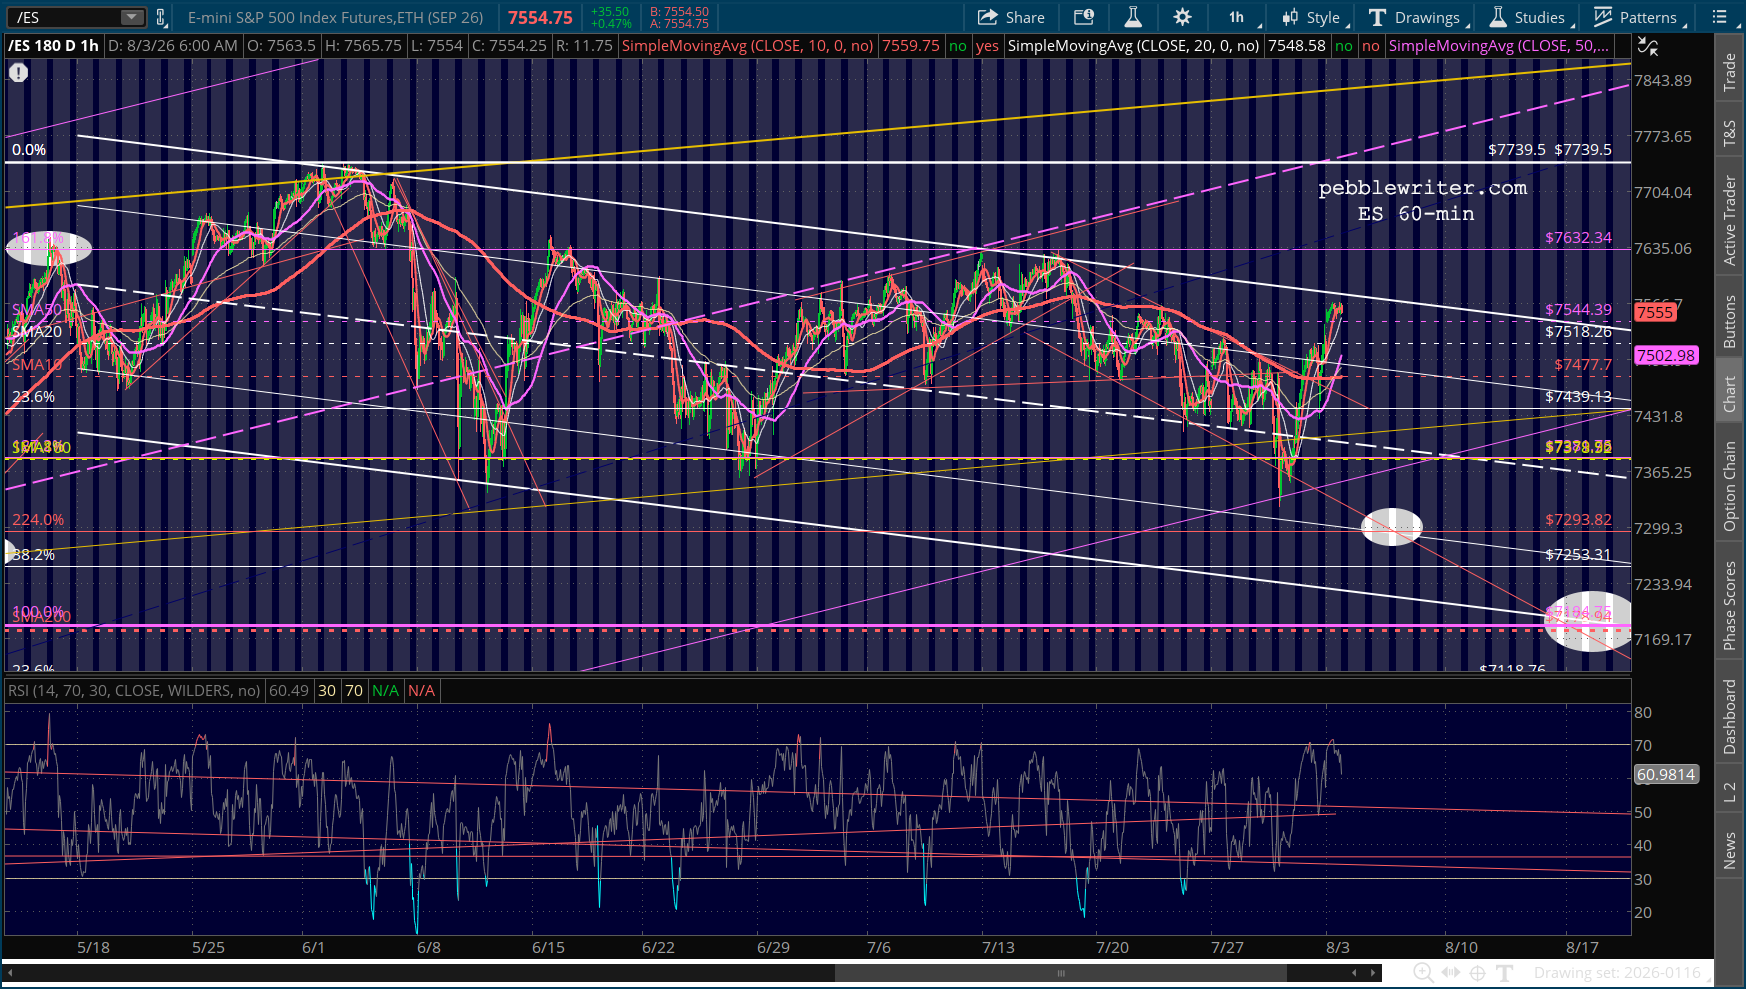
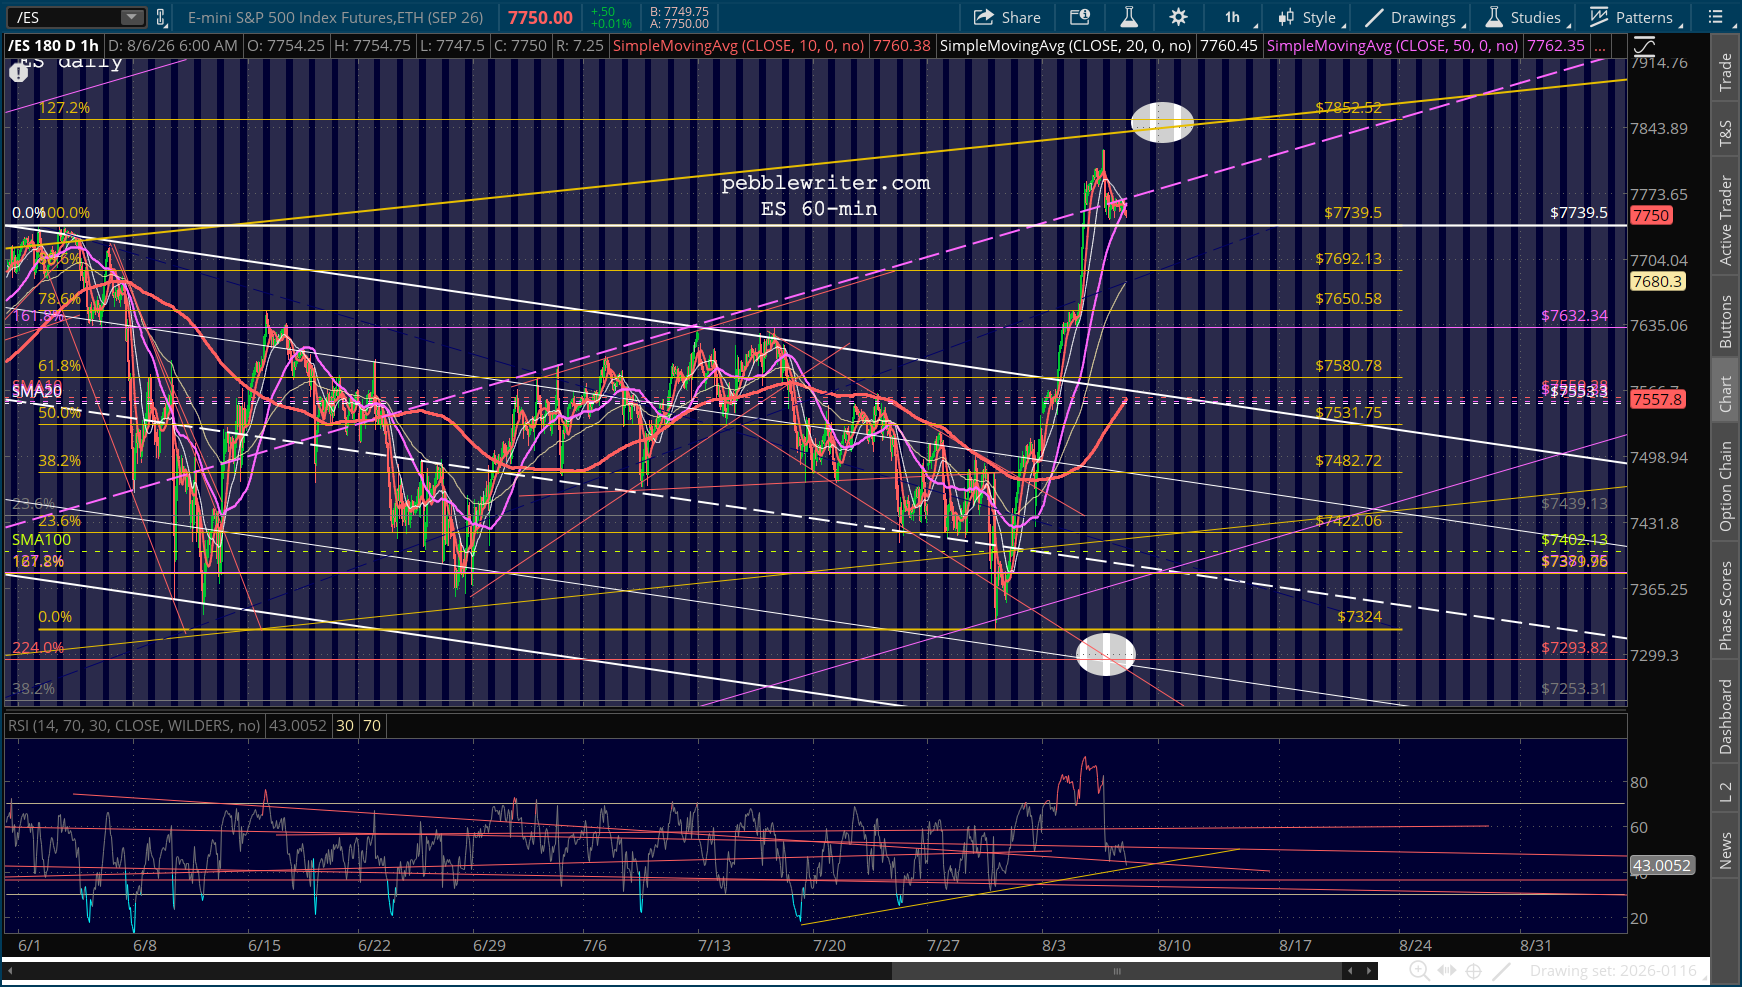
    ES, on the other hand, has a ways to go before reaching obvious resistance. Though it is also showing strong negative divergence.

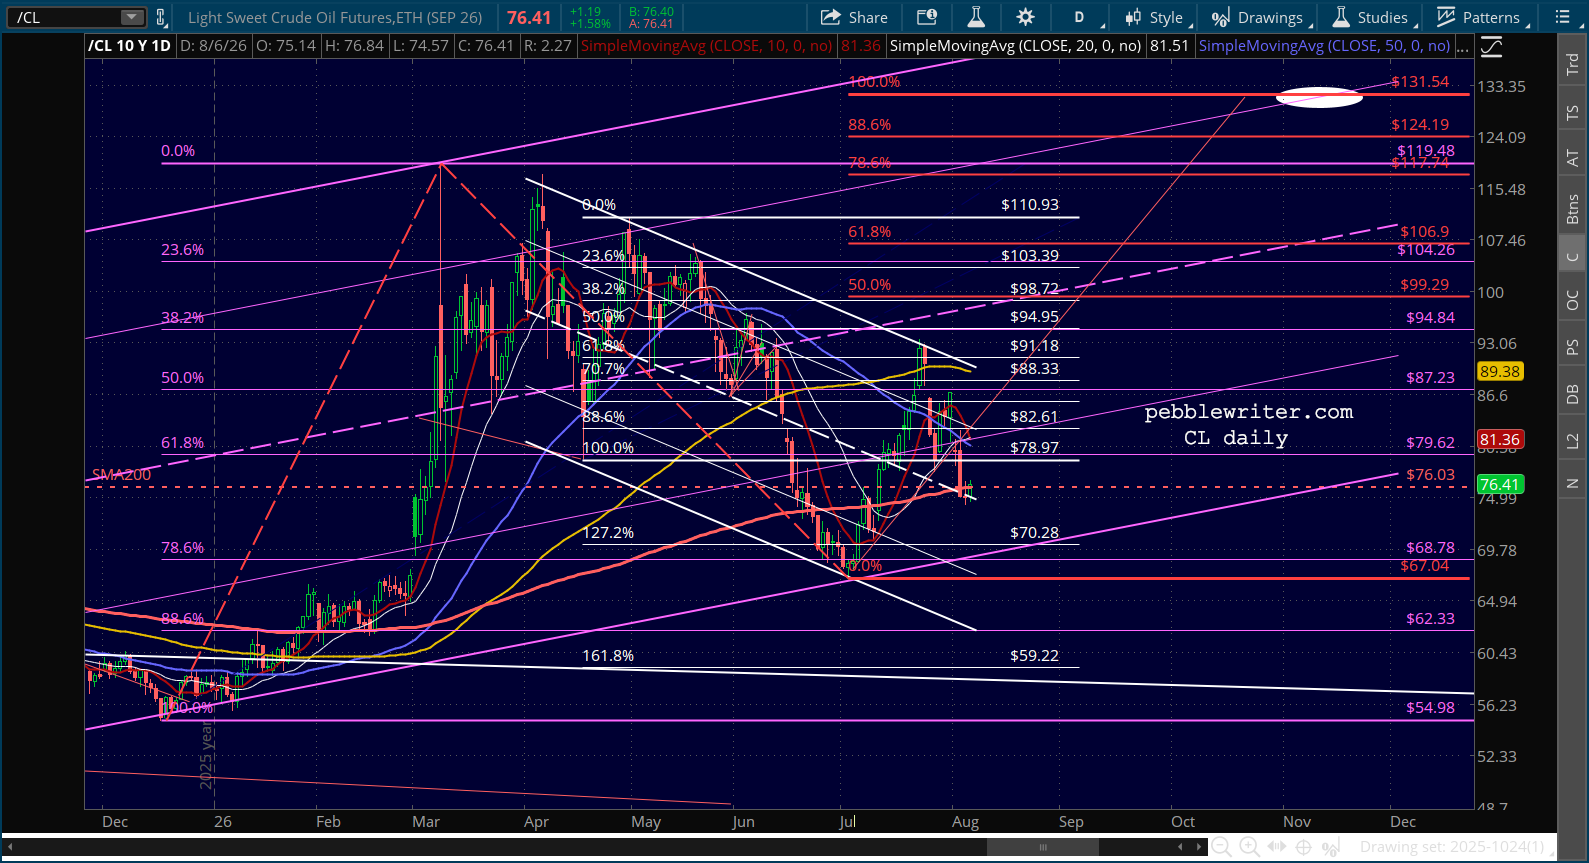
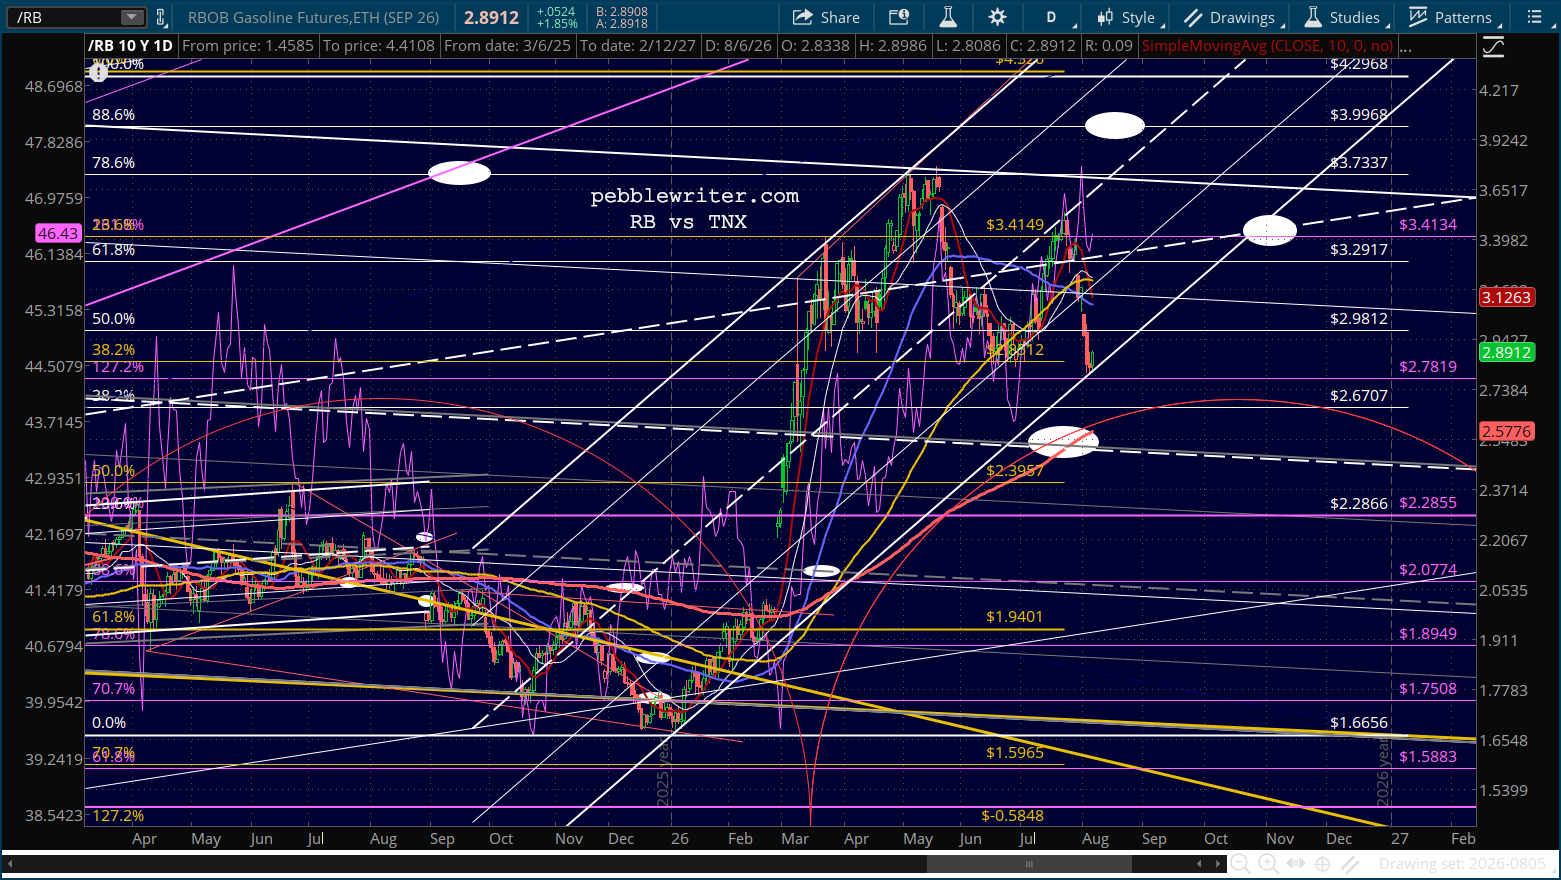
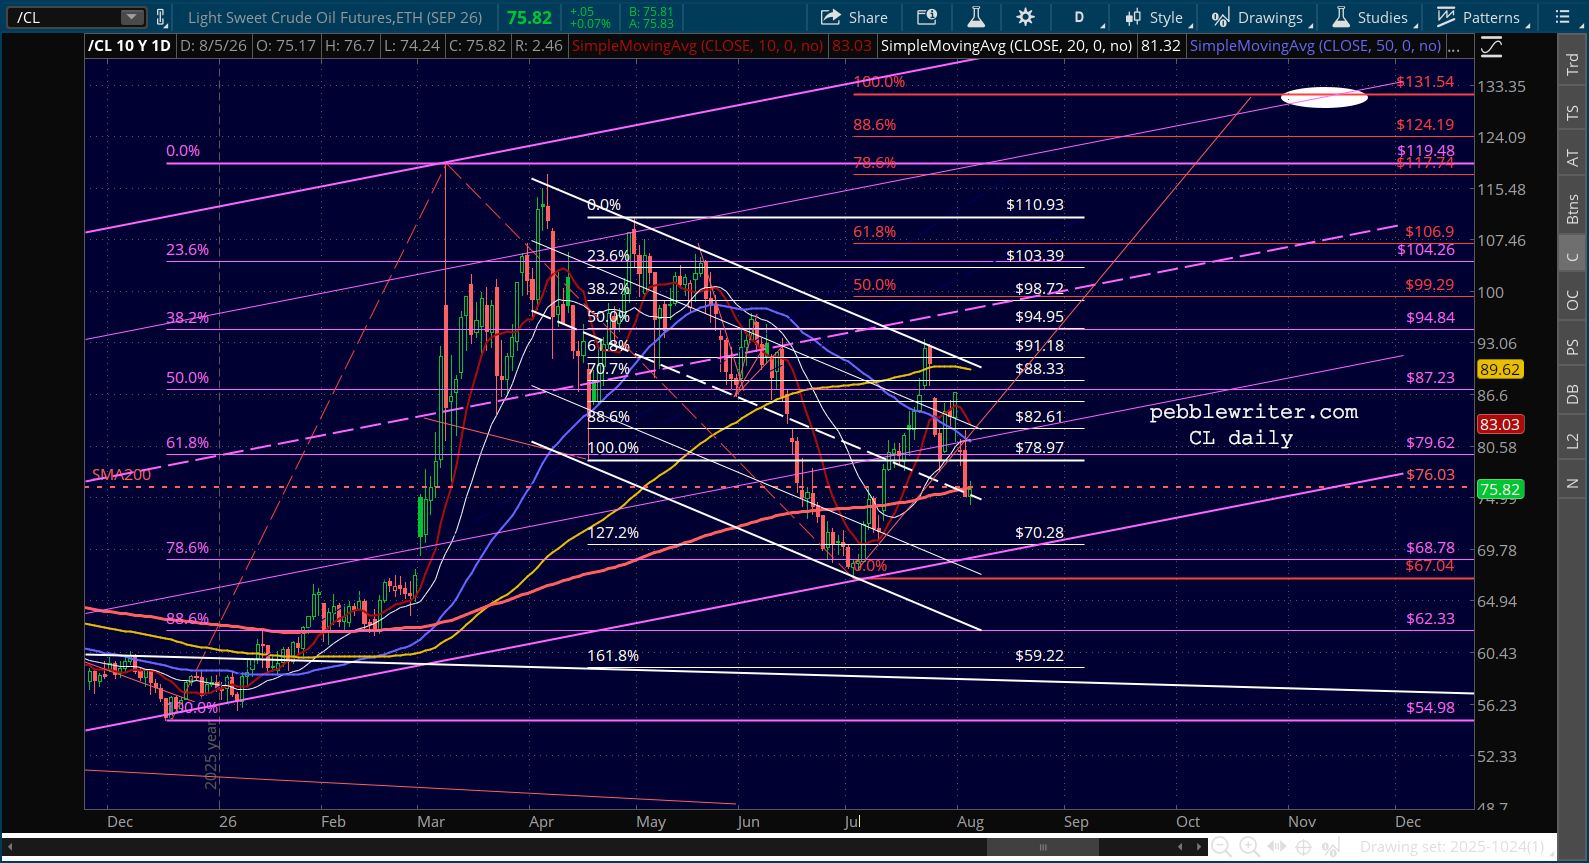
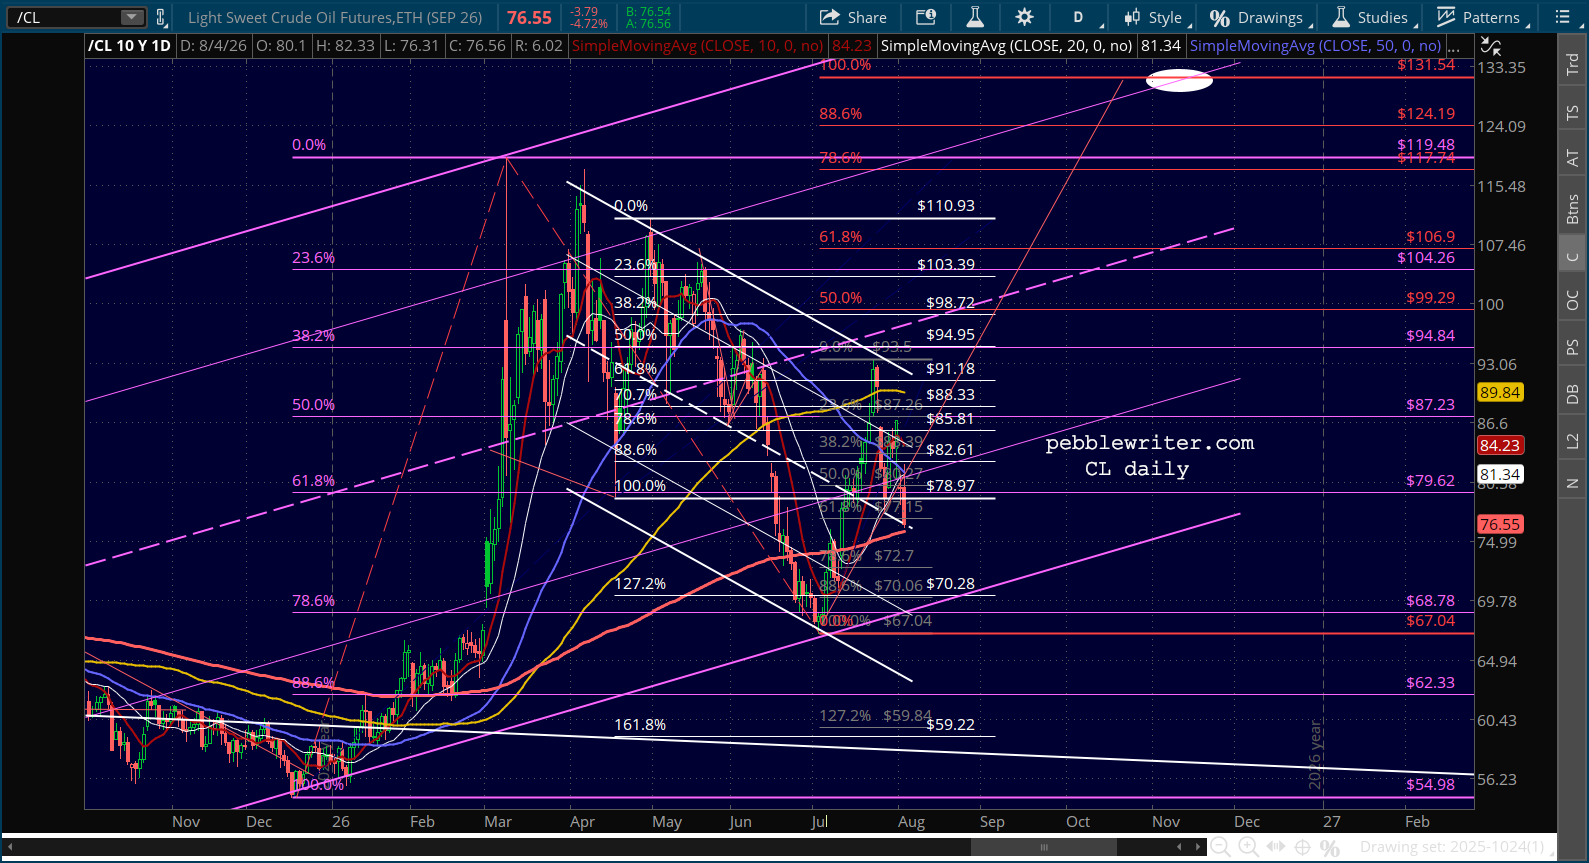
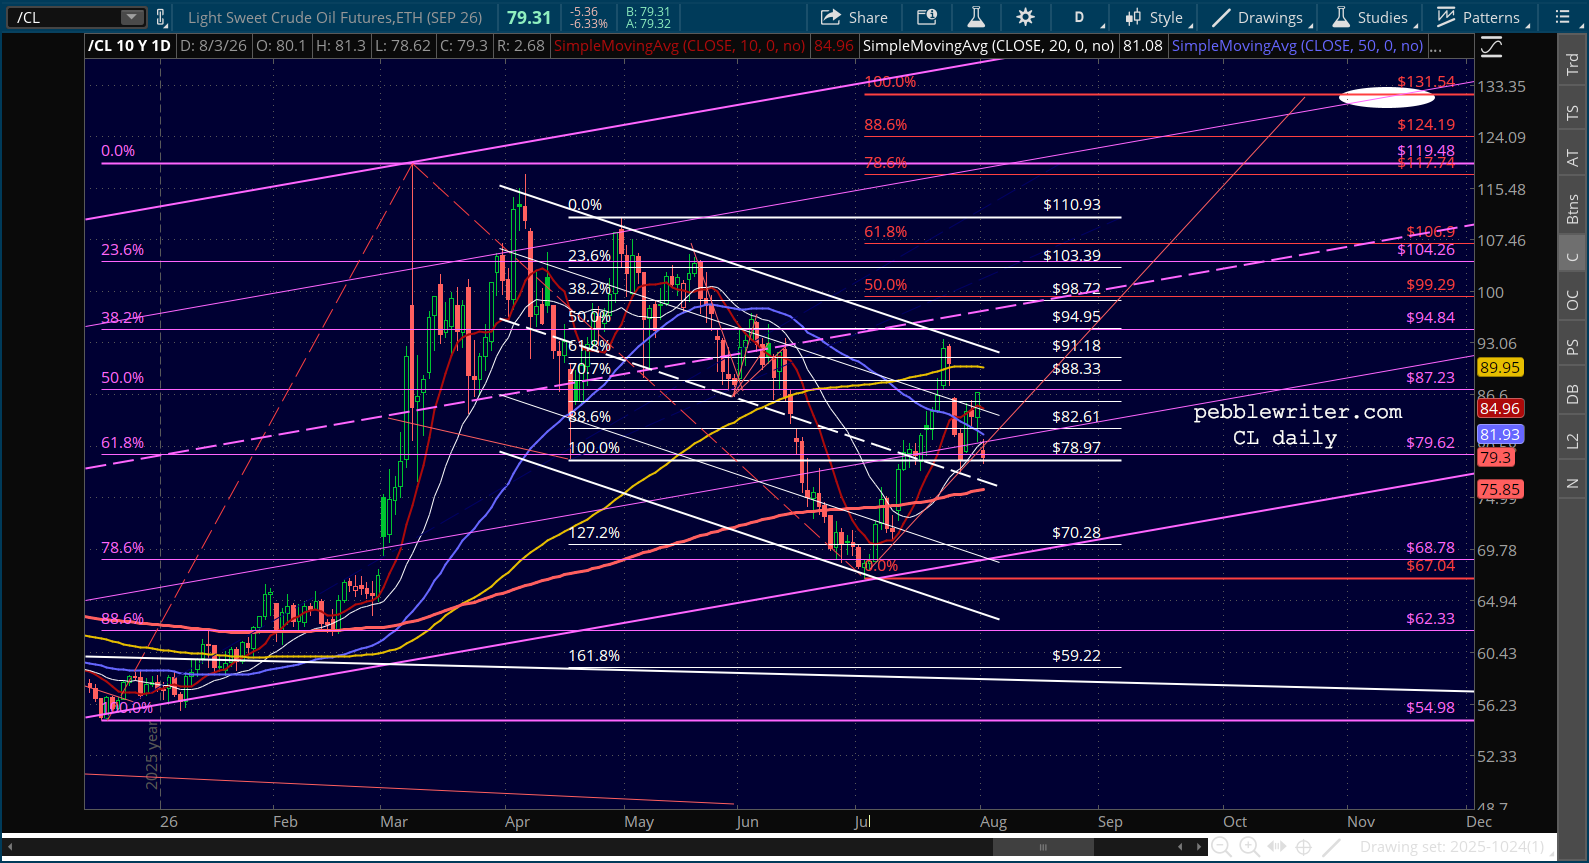
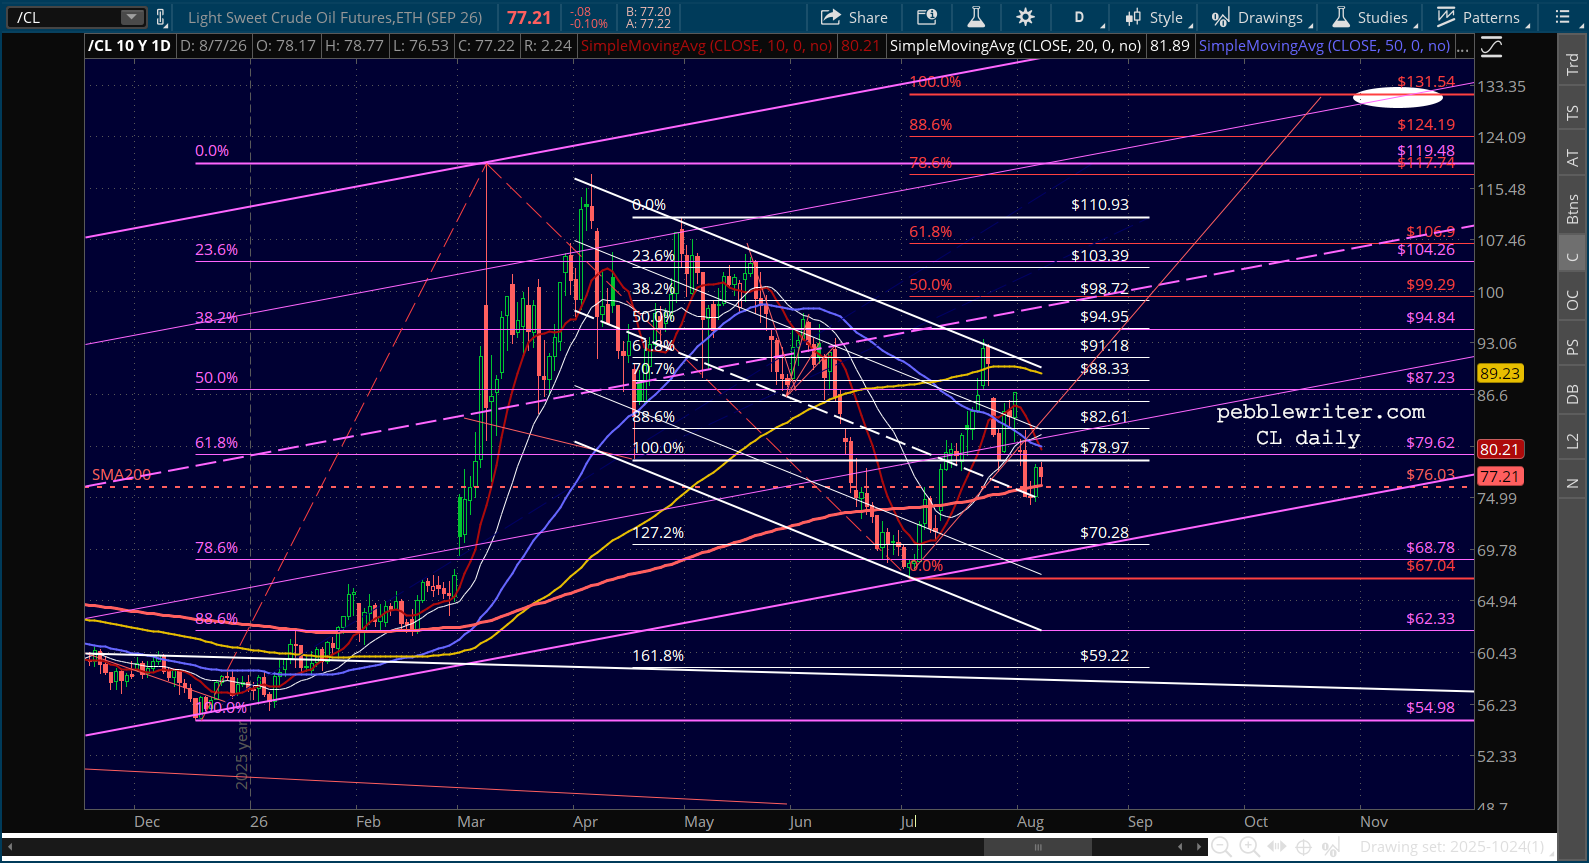
    CL appears to be hung up on its SMA200, though this is a tool that the administration has not hesitated to use in the past. The flag pattern is quite clear, suggesting an upside breakout. Again, will the Iranians acquiesce or will they continue to politically punish the Donald? I suspect the latter, though it’s a losing bet at the moment.

    Then there’s VIX and the usual games being played with breakdowns of trendlines and the SMA200.  FWIW, it’s up over 4% this morning even though ES is up 0.50%.

    In watching the financial news this morning, it’s almost impossible to find anyone who’s bearish. This alone is reason to be cautious.

    Stay tuned.

  • Charts I’m Watching: Aug 4, 2026

    Futures are in a position to put SPX at new highs, even as ES itself is still a a little over 1% shy.

    We have new lows on VIX – no surprise.

    But, the potential trap for equity traders is that CL’s significant drop — thanks entirely to Trump’s and Bessent’s jawboning — is running into a channel midline AND SMA200. It is fairly likely to bounce here, which would put those new equity highs at risk.

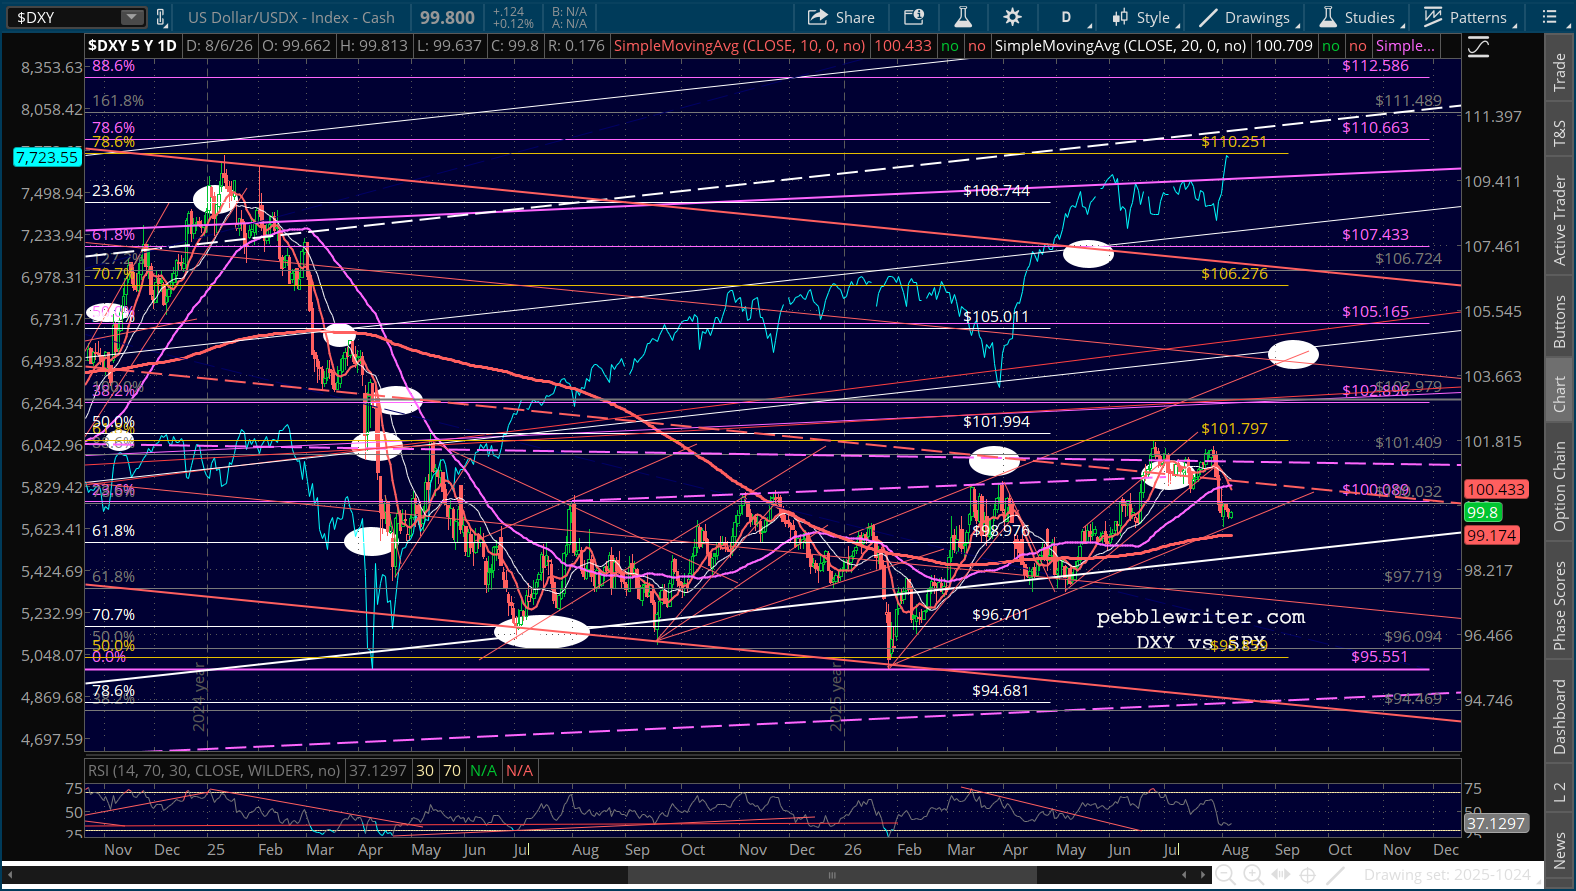
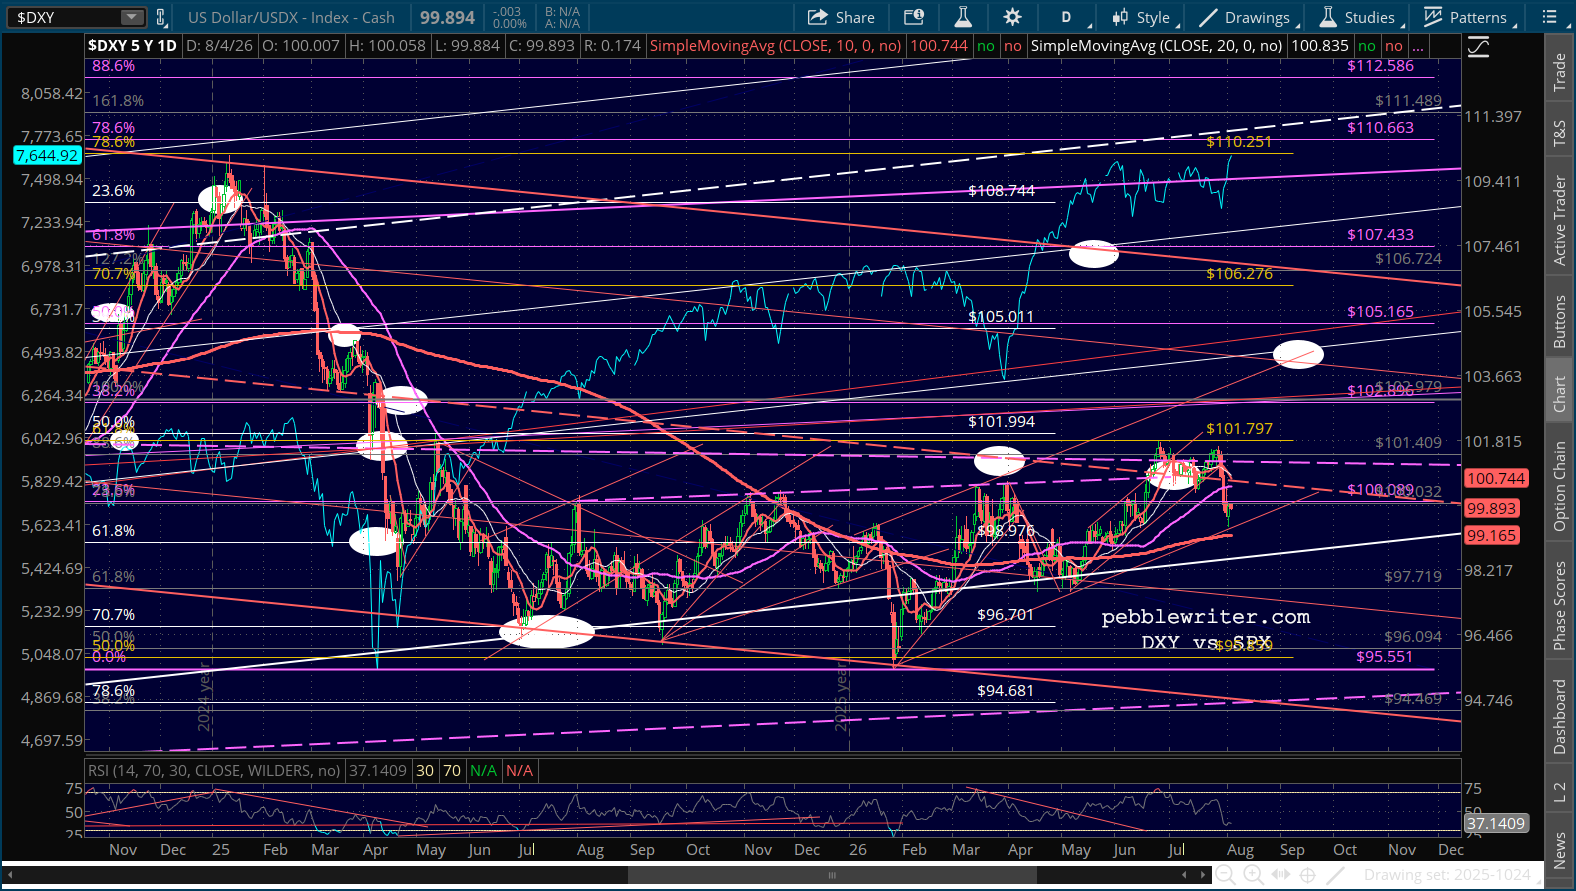
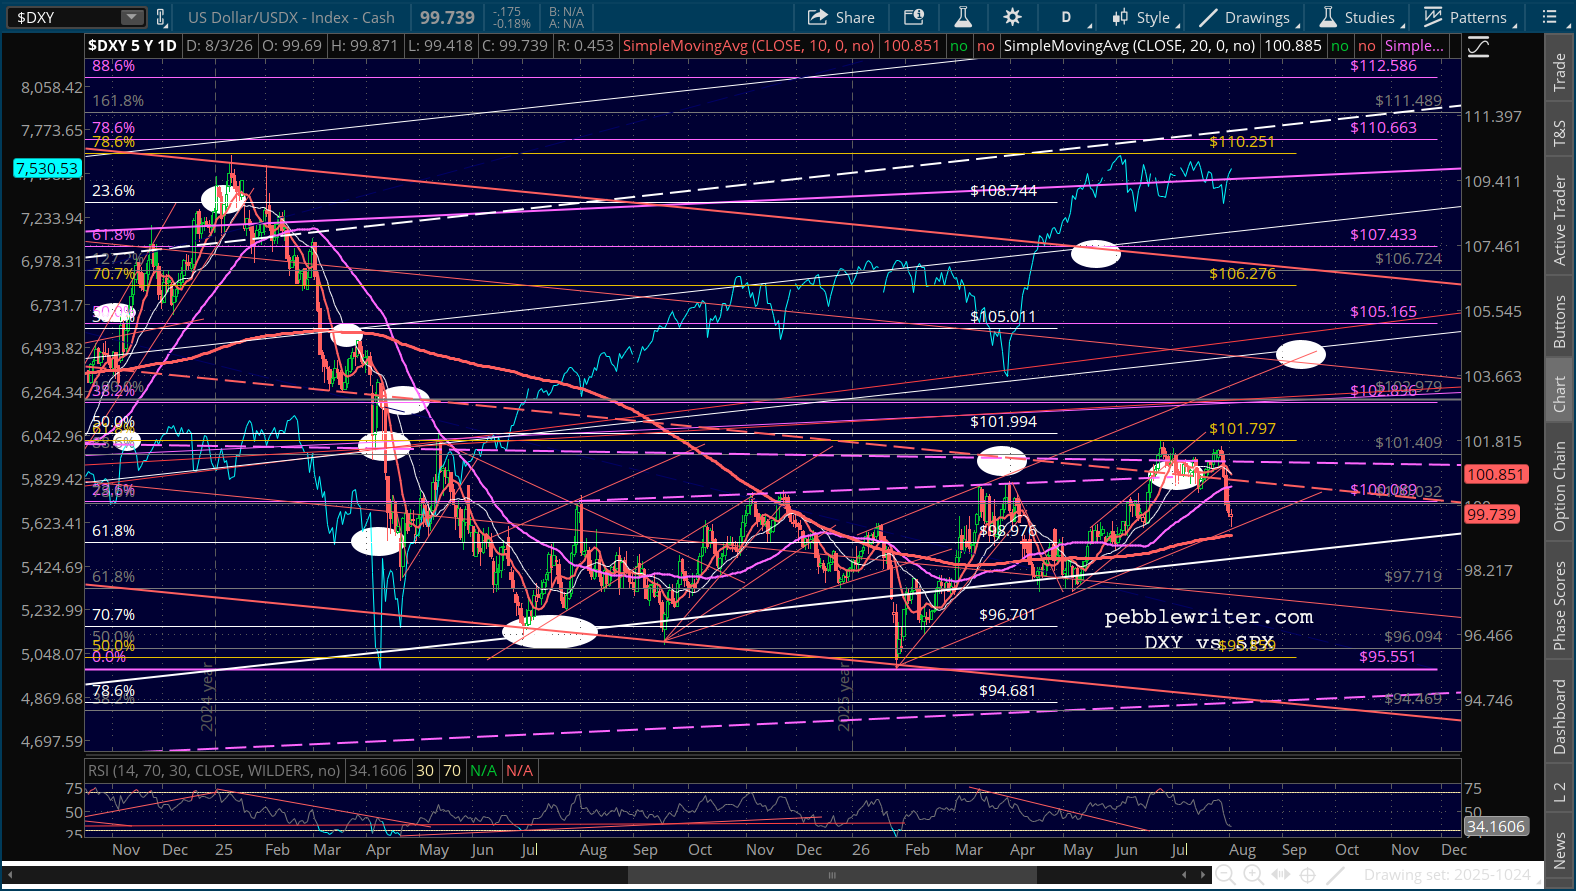
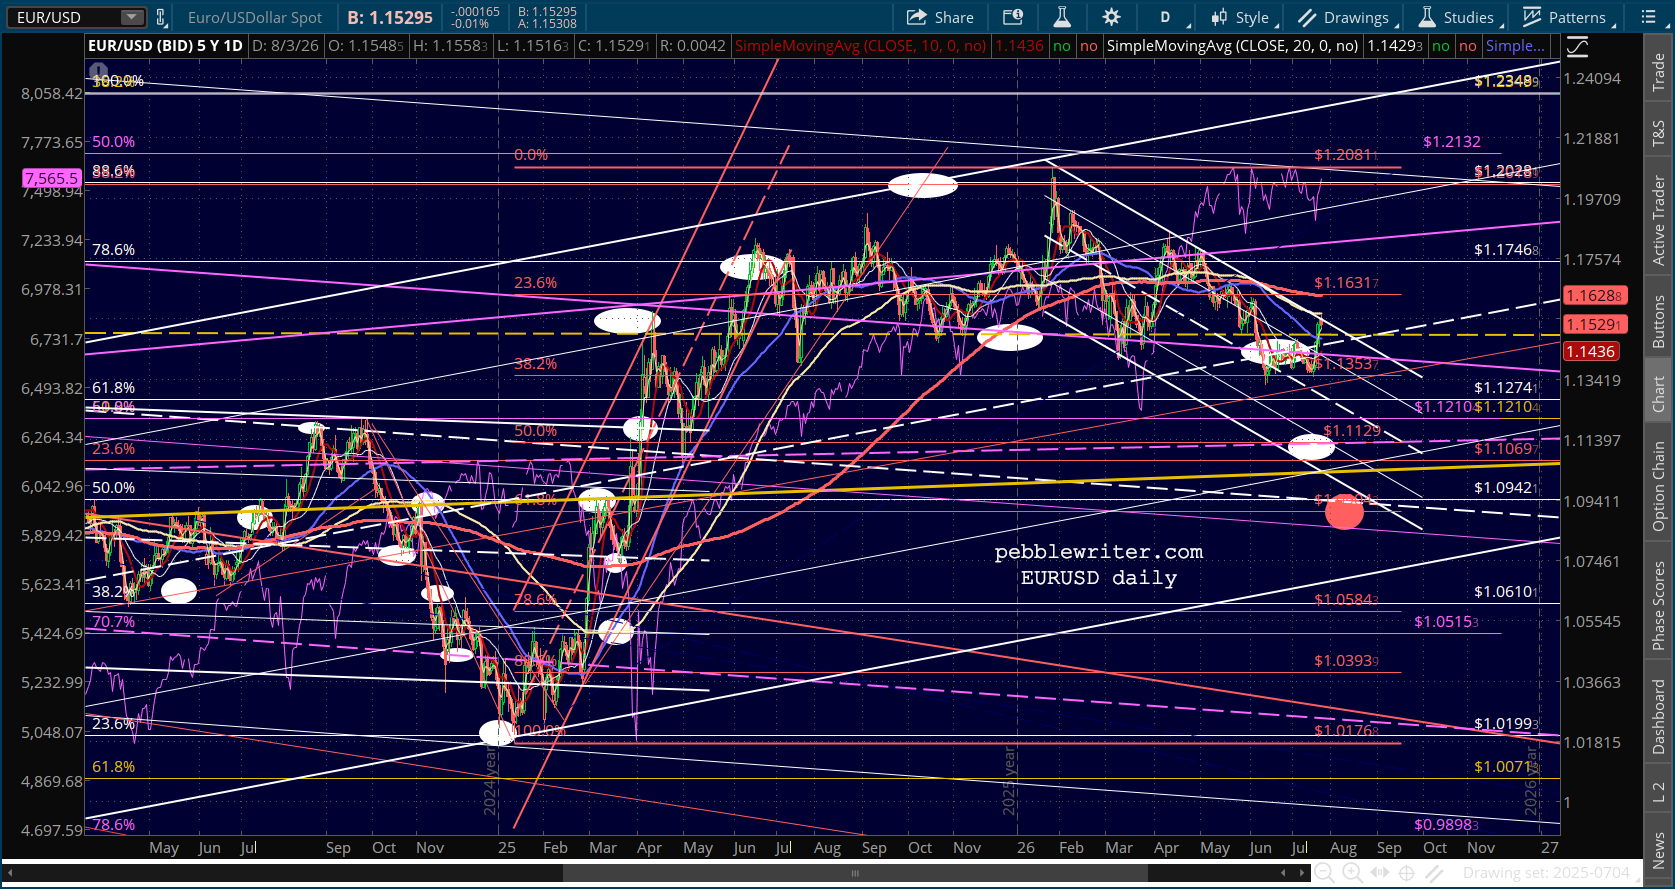
    And, DXY is only slightly above strong support.

    All of these issues could be allayed by more of the same kind of manipulation that got stocks to where they are. But, the risk is real, and will remain so until we get a bullish 10/20 cross.

    Stay tuned.

  • Charts I’m Watching: Aug 3, 2026

    Moment of truth, thanks to another unsupported social media declaration…

    …that sent CL tumbling by over 6%.

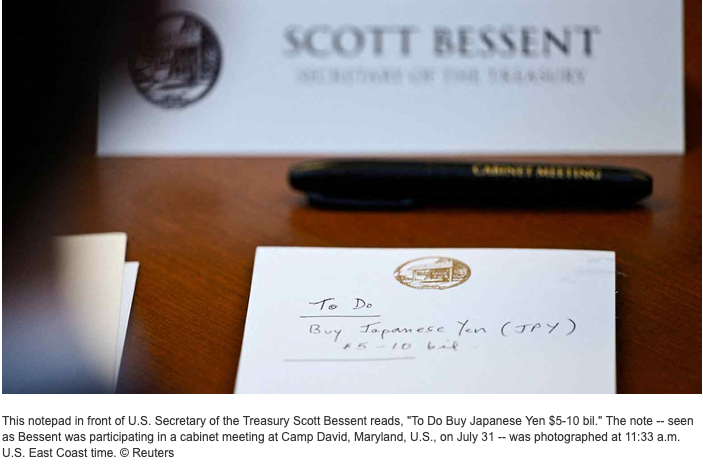
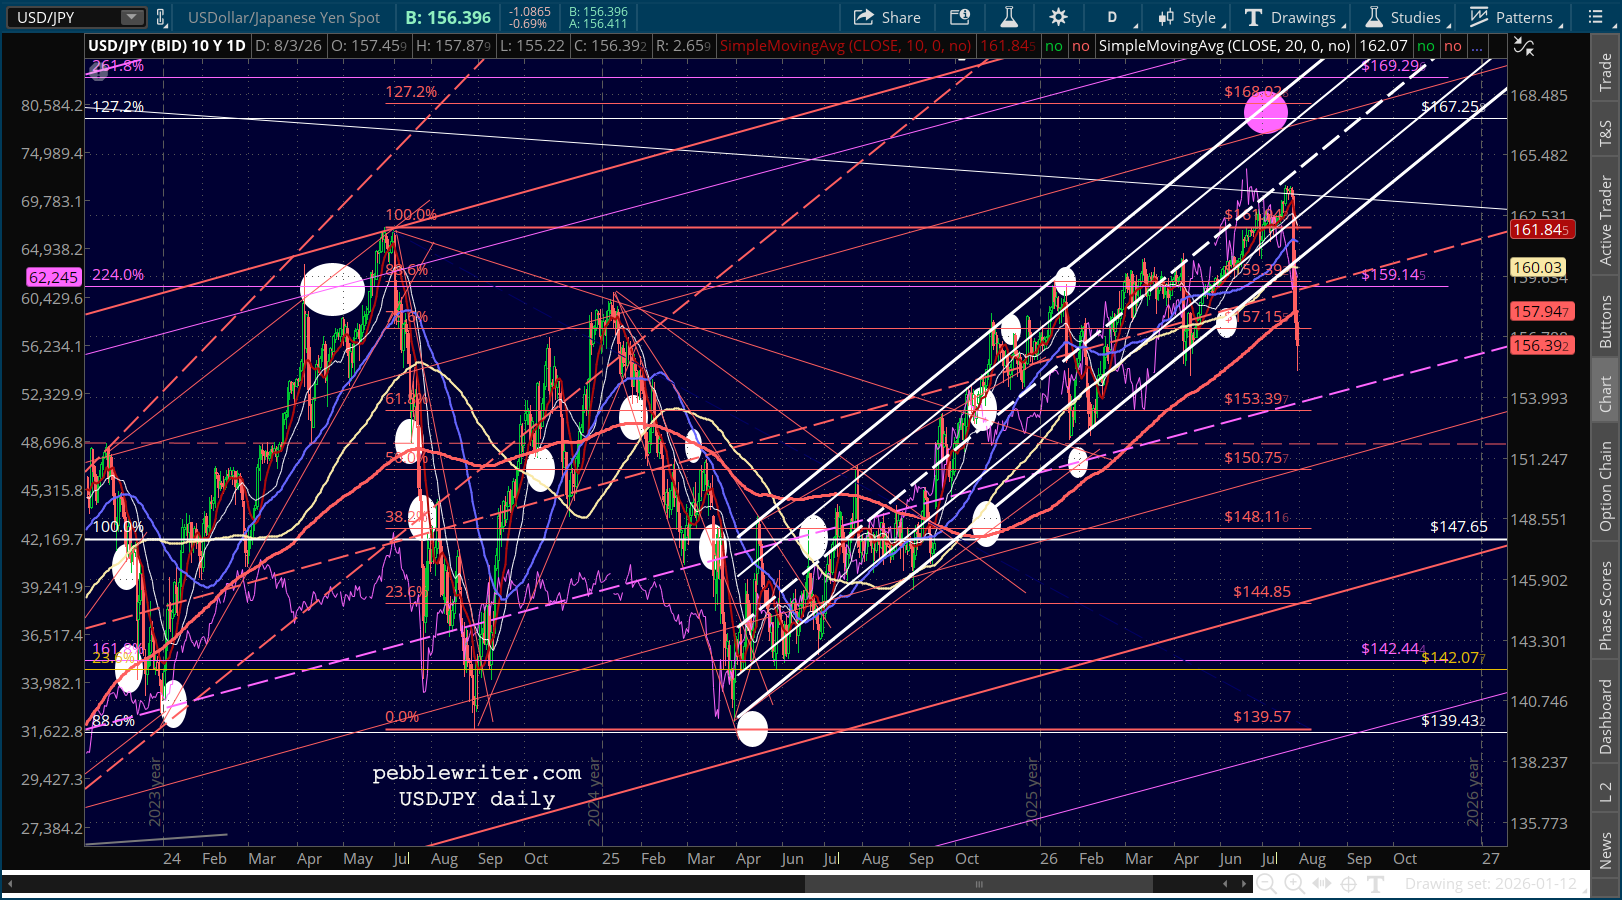
    Perhaps the bigger development is the extraordinary intervention in the Japanese yen. Reuters captured this snapshot of Scott Bessent’s To-Do list at Camp David the other day:


    There is some confusion as to how the purchase was financed – with dollars or euros. And, there’s plenty of doubt as to whether the yen strength will last given Japan’s negative real interest rates. But, the USDJPY’s breakdown…

    …was mirrored by a breakdown in the DXY. Such declines have been beneficial to stocks of late.