Year: 2014

  • Charts I’m Watching: Oct 13, 2014

    My cynicism was well-founded, as SPX did fade into the close Friday, nearly tagging the SMA200 (1906.25 v 1905.22.)  Will the market erase the Sunday ramp job and finish the job, or was that close enough?  Not sure, but it appears things are oriented toward a sizable bounce.  Just be cautious for a dip on the opening to trigger the stops and justify the MA bounce.

    USDJPY tagged not only the .7886 but the .886 as well.

    2014-10-13-USDJPY daily 0624

  • Charts I’m Watching: Oct 10, 2014

    Futures have been all over the map overnight, nearly tagging the ES .786 at 1910.75, which might represent a reversal as suggested yesterday by VIX’s completion of a Gartley Pattern.  The key remains USDJPY, which has vacillated just shy of completing its own Gartley Pattern.  In any case, it remains below the channel that took it from 101 to 110 in less than 3 months.   The BOJ might let it linger in this 107.50 – 108.10 range — which could set up a repeat of the early months of 2014 — with the pair providing occasional lifts for stocks during the trading sessions, and resetting overnight.  We’ll see.  All I know is it’ll be difficult for stocks to rally meaningfully without the carry trade’s participation.  And, any doubt as to whether it’ll hold its value might create even more uncertainty for stocks.
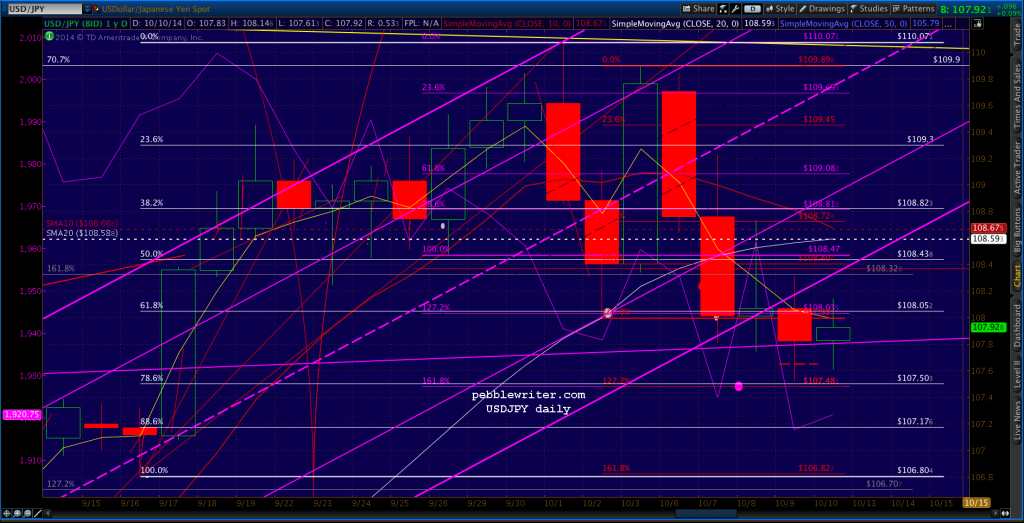
    2014-10-09-usdjpy daily 0500

    SPX still has the potential to drop down and tag the .886 at 1917.83, though I have mostly favored a tag later in the month when it will offer a test of the SMA200 — currently 1904.86 (which is finally up above the Aug 7 low.)  But, I certainly can’t rule out a test of both as early as today. Any move below 1925 is probably headed for 1917, so it might pay to just wait and see.

    Double bottoms are always a killer for chart guys, and the amount of whipsawing this market has done is certainly in keeping with that kind of move.
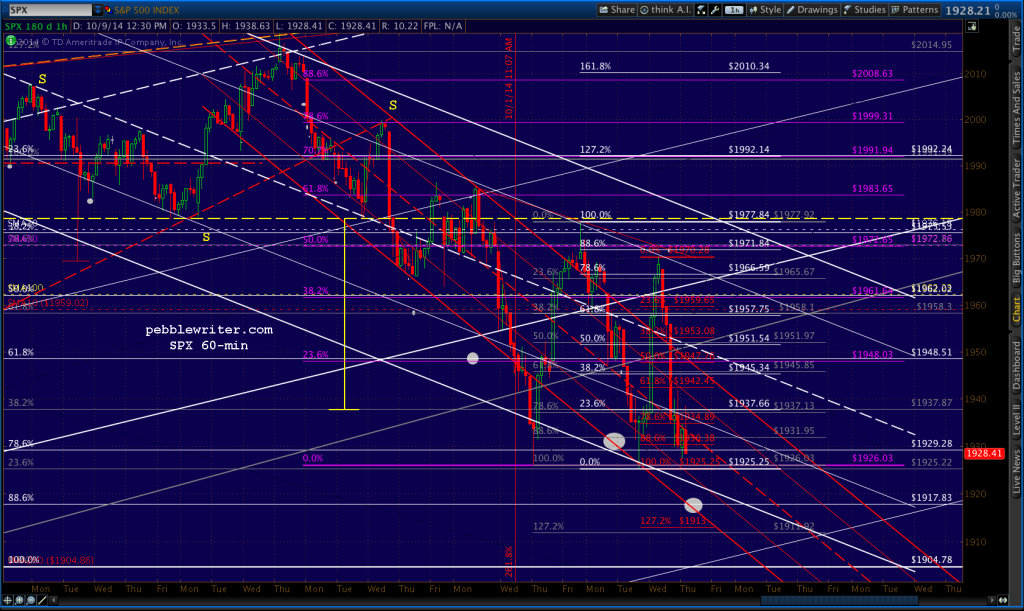
    2014-10-10-SPX 60- 0500

    On the flip side, any sustained rally should still seek out the purple .618 at 1983.65.

    UPDATE:  11:20 AM

    SPX tagged the .886 — after a 15-pt wild goose chase after the open.  From here, it’s anyone’s guess whether we’ve seen the low for the day or whether we’ll take a run at the SMA200.  The cynic in me suspects a close right at the SMA200 — or maybe even a tick or two below — going into the weekend.  In any case, I think it’ll be a lot of chop for the rest of the day.  And, my back continues to give me fits.  So, it’s back to bed for your humble host.  GLTA.
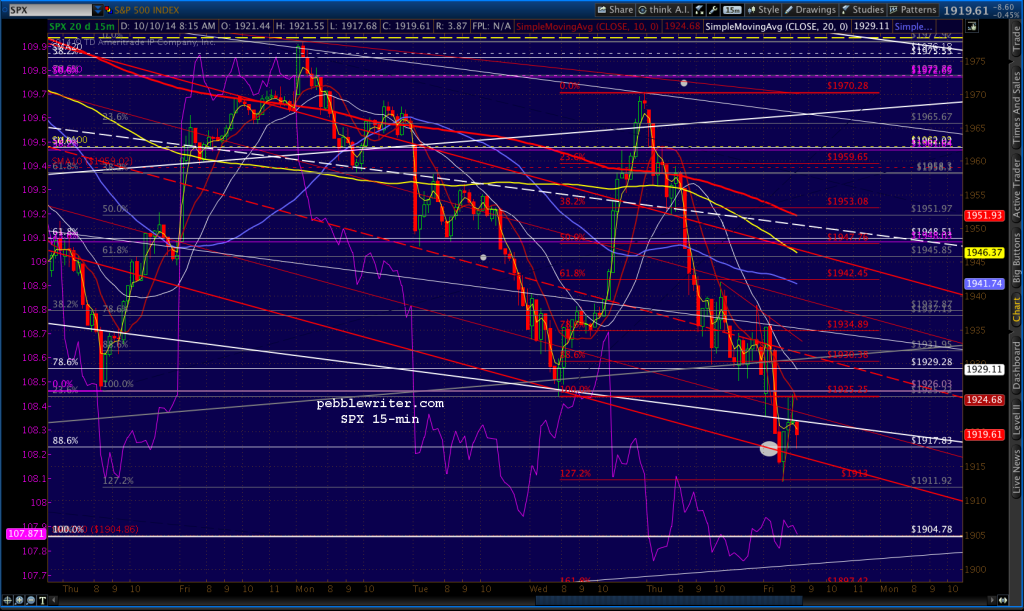
    2014-10-10-SPX 15 0824

  • Charts I’m Watching: Oct 9, 2014

    USDJPY took advantage of yesterday’s FOMC minutes algo melt-up to tag our 107.50 target.  That is, almost tag it — coming up 2 pennies shy.  Maybe it was a meaningless coincidence, or maybe there’s going to be a little shake and bake this morning.  Ditto with 10-yr notes futures, which at 126’285 came up just shy of the 126’310 target.  Caution is warranted.

    2014-10-08 USDJPY 60-min 0720

    SPX stopped just shy of the .886 of its drop from 1977 that began Tuesday — smack dab in the middle of the moving averages.

    2014-10-09-SPX daily 0500

    The circumstances continue to remind me of Feb 5, 2014.  Though it’s hard to ignore the resemblance to the algo-rally on Oct 3.  IMO, this is a wait and see kind of day.  I’ll be taking my cues from VIX and USDJPY.


    UPDATE: EOD

    VIX tagged our .786/channel top combo target, which suggests stocks might have bottomed for now.

    2014-10-09-VIX 60 1300

  • Update on Bonds: Oct 9, 2014

    We are nearing potential resistance on the 10-yr: the .886 of the drop from May to September, 2013.

    The big picture…

    2014-10-09-ZN daily big 0500

    Closer up:

    2014-10-09-ZN daily big 0500

    An intra-day reversal at 126’310ish could be beneficial to stocks.

    2014-10-09-ZN daily ECU 0500

    From a yield perspective, we popped through a channel midline and an .886.  It could be an aberration occasioned by the FOMC algo bonanza yesterday.

    2014-10-09-TNX daily ECU 0500

    But, if TPTB somehow loses their grip, it fits with the much lower potential.

    2014-10-09-TNX daily big 0500


  • Charts I’m Watching: Oct 8, 2014

    SPX just tagged our 1931.95 target.  We should see a reversal here.  As always, keep an eye on USDJPY, which should rejoin the rising purple channel shortly.  Where it goes from there will, of course, determine SPX’s course after the reversal.  I imagine we’ll see a lot of chop, given the FOMC minutes coming out later today.

    2014-10-08 SPX 15-min 0706

    As to USDJPY, the .786 Fib at 107.50 remains an attractive target for any selloff.  Note it’s also the purple 1.618 and red 1.272.

    2014-10-08 USDJPY 60-min 0720

    I’m enjoying an irritating bout of sciatica this morning, so I’ll sign off for now and go find a bottle of muscle relaxers.  No changes to yesterday’s analysis.  A bounce here might or might not last.  GLTA.

  • Charts I’m Watching: Oct 7, 2014

    As we mentioned yesterday, the key was and remains the USDJPY — which definitely did not play along as was necessary in order for SPX to break through the SMA50.  It has since retraced .786 of its rise from 107.997 and is backtesting a broken TL of support.  It might be done, or it might be heading lower to flesh out the rising purple channel at the .886 or a double bottom(my preferred view) .  The sentiment is quite negative at present, and stocks shouldn’t rally meaningfully without it.

    2014-10-06-USDJPY 15-min 0600

    If it can reverse strongly, then our upside targets are good to go.  Otherwise, not so much.


    UPDATE:  4:30 PM

    USDJPY did, indeed, tag the bottom of the purple channel – overshooting a double bottom just a bit.

    2014-10-06-USDJPY 60 1300

    In so doing, it demonstrated just how difficult it will be for stocks to rally without the yen carry trade’s cooperation.  It’s anyone’s guess when/whether USDJPY reaches our 107.50 target, but I think there’s an excellent chance of doing so when we tag SPX 1931 (the bullish case) or our next lower target.

    continued for members(more…)

  • Charts I’m Watching: Oct 6, 2014

    The key remains the USDJPY, which slid overnight after retracing to the .886 but has recovered in the past hour.

    2014-10-06-USDJPY 60 0600

    It will get SPX up over the white channel midline, and might provide it the opportunity to test some of the higher resistance such as the H&S neckline (1978)– assuming it can blow through the SMA50 at 1975.

    continued for members… (more…)

  • Charts I’m Watching: Oct 3, 2014

    As we discussed yesterday, the key to SPX’s path forward was USDJPY — which nailed our .618 intermediate target yesterday before reversing. It retraced a whopping 78.6% of its drop from 110, and now sits at the .786 channel line where it should at least take a pause or, more likely, reverse here at 109.63.

    2014-10-03-USDJPY 60 0600

    Stocks also behaved as expected.

    Though the charts would clearly indicate further downside to the white .786 or even .886, I wouldn’t rule out a 2/5/14 type reversal here — particularly if bonds and the yen are monkey-hammered into submission  .If so, it would likely see a quick decline to the .786 at 1929.28 and reversal to backtest the SMA100.

    SPX reversed strongly at the .786 a la Feb 5 and closed in the green.  Thanks to the overnight ramp job, SPX should open at around the SMA100 (1958.78.)

    2014-10-03-SPX daily 0600

    No doubt, many investors will rush in at this point, which might be a risky move. There’s definitely pop and drop potential today.

    continued for subscribers(more…)

  • Charts I’m Watching: Oct 2, 2014

    SPX hit both of our next downside targets yesterday: the SMA100 and the .618 at 1948.51.  The key continues to be the USDJPY, which — along with NKD — had its most significant sell-off in months yesterday.  It moved below the acceleration channel midline, and could fall to the white .786 before the channel is in danger.

    2014-10-02-USDJPY 60 0600

    The close-up shows the immediate target of the .618 at the SMA20 9108.05) and the bottom of the channel at 107.50.

    2014-10-02-USDJPY 60 0601

    If the pair is allowed to settle further, there is easily more downside potential in SPX.  It closed well below the SMA100 and just below the .618 — ending up at a TL connecting the 6/24/13 and 2/5/14 lows. The 2/5/14 low was, IMO, an aberration — reversing before it should have thanks to a similarly (seemingly) unimportant TL.  Though the charts would clearly indicate further downside to the white .786 or even .886, I wouldn’t rule out a 2/5/14 type reversal here — particularly if bonds and the yen are monkey-hammered into submission.

    continued for members(more…)

  • 100-day Moving Average?

    Thanks to multiple interventions related to quarter-end window dressing, the S&P 500 has been prevented over and again from reaching the SMA100.  Today is lining up to finally be the day, but keep an eye on USDJPY and NKD — as another stick save is always a good possibility.  Just above the SMA100 is the .500 Fib at 1962 and below it is the .618 at 1948.  Either would make a good target, depending on when it happens.

    The “market” continues to be highly managed.  So, it’s not so much a matter of what panicky investors might do, but what TPTB have in mind.

    2014-10-01-SPX 60-0530

    GLTA.

