Month: November 2014

  • Update on VIX: Nov 18, 2014

    VIX continues to hold its own since completing the Bat Pattern (in purple) following Bullard’s mid-October smackdown.

    2014-11-18-VIX daily 0844Since tagging the purple .886 on Nov 10, VIX has climbed steadily — following the Fib Fan lines fairly faithfully.  If today’s low holds, I can easily see a backtest of the falling purple channel midline in the next day or two.

    2014-11-18-VIX 15 0844Whether it exceeds that level is hard to tell, as the daily equities melt-up smacks of continued intervention at every turn.  In other words, the yen carry trade is alive and well until TPTB decide to let a little air out.

    And, should it fail, shorting the VIX is the next most favorite central planning tool.


  • Charts I’m Watching: Nov 18, 2014

    USDJPY has gone sideways for the last few days, always careful to reacquire the rising wedge lower bound whenever SPX starts to falter.  The Japanese consumption tax increase is almost certain to be postponed, now.  That, and the snap election, are already priced into the “market.”

    2014-11-18-USDJPY 15 0600

    NKD is consolidating in the 16,900 to 17,600 range, still with no signs of any meaningful retracement of the Oct 31 rally.

    2014-11-18-NKD 15 0600ES is flat after bouncing around, taking out stops all night.  SPX’s 10-day moving average finished at 2033.55 yesterday, so that is our new downside target for the day — only 1 point below yesterday’s low.

    2014-11-18-SPX 30 0600So, in the end, SPX never did dip to the SMA10; the SMA10 is rising to meet SPX.  It’s another clear sign of the degree of manipulation of this “market”, when not even a simple backtest of a bullish support is permitted.

    Because, of all the squiggles on the above chart, the only one that really matters is the thin purple line marking the USDJPY, which remains only too happy to rally any time stocks start to lose their footing.

    UPDATE:  11:15 AM

    Case in point…note the leap higher for both USDJPY and NKD when the cash markets opened at 9:30 (6:30 on the charts, shown with white circle.)  The futures had been slightly negative in the minutes leading up to the open, and needed to spark to continue the melt-up into the session.

    2014-11-18-JPY&NKD 5 0811

    SPX is nearing the interim upside target — the 1.272 at 2050.46.  Prices should ebb here to 2044-45 or so (ideally, 2044.39 at 12:30.)  If not, the next upside target remains 2055.91.

    2014-11-18-SPX 5 0811

    UPDATE:  3:15 PM

    SPX just reached our 2055.91 target (the white 1.618) and has tagged the rising red TL. ES is just a point shy of its 1.618 extension (2055.17).  In addition, USDJPY is at the .886 retracement of its drop from earlier this morning, and VIX has backtested the falling white channel and recovered to above the bottom fan line.  Equities should reverse here.

    2014-11-18-SPX 5 1212


  • Charts I’m Watching: Nov 17, 2014

    In news that shouldn’t have surprised any of our readers, Japan has officially dipped back into a recession.  The Nikkei 225 futures plunged 680 points (3.8%), but is still treating the yellow .886 as support.

    2014-11-17-NKD 15 0600

    USDJPY dropped from 117.04 to 115.44 (1.4%.)   The e-minis responded by dropping as many as 14 points from Friday’s close before the BOJ jammed the USDJPY back into the rising wedge it has been in since Nov 9, and presto! ES is back to a more acceptable 5-point drop.

    2014-11-17-USDJPY 15 0600Otherwise, nothing much has changed over the weekend.  The US dollar stopped just shy of the .886 we’ve been watching: 88.365 v 88.477.  And, the SMA10 for SPX is a tad higher post Friday: 2031.20.  I think there is an excellent chance SPX will dip down and tag it today in order to quell the (quite accurate) criticism that the market is behaving irrationally.

    In fact, I wouldn’t be surprised to see it dip at least a little lower, perhaps 2028.  This will complete a H&S pattern (the red neckline) and, since it will produce a lower low, will also run quite a few stops.

    2014-11-17-SPX 60 0600

    GLTA.

  • Charts I’m Watching: Nov 14, 2014

    DX is almost to the .886 we’ve been watching…

    2014-11-14 DX daily 0615
    While USDJPY is running into TL resistance and might digest the week’s gains ahead of next week’s tax break news…

    2014-11-14 USDJPY 30 0615

    And, SPX is due a reaction at the red .618 if nothing else.  SMA10 is up to 2029 now and also marks the spot of a H&S neckline (red, dashed) that would target 2014.  I’m not expecting it to play out, but TPTB could pick any day to quiet the criticism of the never-ending rally.  Today is as good as any.

    2014-11-14 SPX 30 0615

  • Update on Oil: Nov 13, 2014

    Last time we updated the oil charts was about a month ago [see: Oct 14 update], at which time it looked like crude light was heading for the .618 Fib at 64.38, with a potential bounce at the .500 at 74.02.  Well… today, CL reached 74.07.

    2014-11-13 CL daily 1300Now that the market is closed, and the news is that Halliburton is purchasing Baker Hughes, that bounce is looking like a good possibility.

    However, the better target remains the .618 at 64.38, as the chart below shows.

    2014-11-13 CL weekly 1300

  • Charts I’m Watching: Nov 13, 2014

    More overnight ramping on USDJPY and NKD, but softness in the past few hours.  As we expected, NKD held the yellow .886 and is treating it as a backtest.2014-11-13 NKD 60 0610 2014-11-13 USDJPY 0610USDJPY is nearing two key Fib levels: the purple .886 at 118.59 and the white .618 at 120.11. 2014-11-13-USDJPY daily 0730ES and SPX each completed a small IH&S indicating further gains.  While, the best choice for any significant pullback remains the former highs.

    2014-11-13 ES 60 0610SPX shows the dashed red TL that has connected all recent highs could be an impediment to the IH&S playing out in the immediate future.  The solution?  New highs in USDJPY and NKD courtesy of the scuttled Japanese tax hike being heavily rumored.

    2014-11-13 SPX 0645A better look at the TL:

    2014-11-13 SPX TL 0645UPDATE:  10:25 AM

    IH&S almost complete, getting big boosts from VIX, NKD and USDJPY.  Note: for many months now, SPX has frequently stopped just short of pattern objectives, leaving an argument for further upside on the following day.  As always, keep an eye on the real drivers of this market: USDJPY and NKD.

    Because, in those instances when SPX doesn’t stop short, USDJPY/NKD are usually smashed higher in an effort to leapfrog natural points of resistance (e.g. Oct 31.)

    2014-11-13 SPX 5 0730

    UPDATE:  1:05 PM

    The IH&S stopped short as we suspected it would. Now, we’re seeing the reversal, that should complete a traditional H&S that points to the SMA10.

    2014-11-13 SPX 5 1015

    UPDATE:  2:00

    SPX got most of the way there.  We should see another leg down to either today’s SMA10 (2028.25) or yesterday’s (2024.25.)  A reminder: the previous high we’ve been targeting is at 2019.26.  It would make for a good intraday overshoot.

    2014-11-13 SPX 5 1100UPDATE:  3:20 PM

    USDJPY to the rescue.  Note that USDJPY (thin purple line) reversed off a TL (the red arrow) at the same time SPX was vacillating between continuing to fall within or breaking out of the narrow red channel.  VIX was monkey-hammered at the same time, and that was that.

    2014-11-13 SPX 5 1222

    SPX is back above the neckline, where it is likely to close unless VIX can get a good bounce off 13.80 (top of falling white channel.)  ES VWAP is at 2036.75, so we’re likely to finish there unless there’s a power outage in algo-land.

    Update EOD:

    ES closed @ 2036.50.  Nice job, guys.  Thank goodness the market isn’t rigged.

  • Charts I’m Watching: Nov 12, 2014

    USDJPY reached the 2.618 Fib yesterday and has since settled back to the 1.618.  There is support at 114.20, and the upside potential remains the yellow .886 at 118.59.2014-11-12-USDJPY 60 0610ES broke a week-old rising wedge overnight, so I believe yesterday’s call for a revisit of the previous high (and SMA10) of 2019.26 remains the most likely downside case, with 1996.62 as the next major support.  As to the upside, I still have my eye on 2138 — the 1.618 extension of the drop from 1576 to 666 between 2007 and 2009.

    2014-11-12-SPX 60 0610Keep an eye on NKD, which overshot our upside target just enough to make a new high last night.  It has since retraced to the .886, suggesting it will treat this strong Fib resistance as support going forward.

    2014-11-12-NKD 60 0610

    GLTA.

  • Charts I’m Watching: Nov 11, 2014

    SPX is coming up on the trend line connecting the index’s previous highs.  This TL has been respected in the past, but there is also a tradition of important TL’s being leapfrogged on low-volume holidays.  Today should be very low volume.

    2014-11-11-SPX daily 0600The daily chart shows the abject lack of meaningful pullbacks since the 1820 lows — particularly since USDJPY’s moon shot higher. The SMA10 should reach the Sep 19 2019 high tomorrow — perhaps time for a token pullback?

    As we expected, the US dollar’s reaction to the red 1.618 extension appears to be yielding to a run for the larger scale purple .886.  2014-11-11-DX 60 0600

    DX and SPX don’t always march in lock step, but lately they have.  So, a reaction at the .886 should incite a reaction for SPX as well.  If TPTB don’t use today as an opportunity to hop the TL discussed above, perhaps we’ll see the two events in sync.

    2014-11-11-DX daily 0600USDJPY continues to race higher, topping 116 with the .886 just ahead at 118.59.  Reuters re-published an article from this weekend speculating that Abe planned to delay the sales tax increase slated for next October.

    2014-11-11-USDJPY daily 0600

    The big picture:

    2014-11-11-USDJPY weekly 0600

    Needless to say, this enabled the Nikkei to reach our upside target range posted on Nov 6.  As is often the case, the rally was halted just short of the .886, meaning there is room for another spurt higher while still respecting the yellow .886 retracement (of the drop from 18,700 in Jul 07 to 7,325 in Oct 08.)

    2014-11-11-NKD 60 0708Should the Nikkei’s .886, the USDJPY’s .886, the DX’s .886 and SPX/ES TL all function as they normally have, we should get a meaningful downturn in the next 24 hours or so.  But, of course, the S.S. Normal sailed a long, long time ago.

    GLTA.

  • Gold’s Line in the Sand

    Few financial assets engender as much debate as gold.  Depending on whom you believe, gold is either about to double in price or drop by half.  Many believe the price has been highly manipulated — an argument I wouldn’t even begin to dispute.  Given the influence central banks and their proxies have exerted over other financial assets, I’d be shocked to learn that gold was, somehow, left out of the mix.

    With that caveat, I still think it’s instructive to check in on the charts once in a while.  If for no other reason, they can provide some hints as to the plans of The Powers That Be — assuming they have a plan and aren’t just winging it.

    Those with a better memory than mine might remember we first talked in April 2013 [see: Apr 15, 2013 Update] about the 1155 target should the red channel bottom fail to hold.It didn’t.  We went with the broader, alternate rising channel shown below in white and saw three pronounced bounces at horizontal support just above 1180 in June 2013, December 2013 and Oct 2014. That support finally broke down on Oct 31.
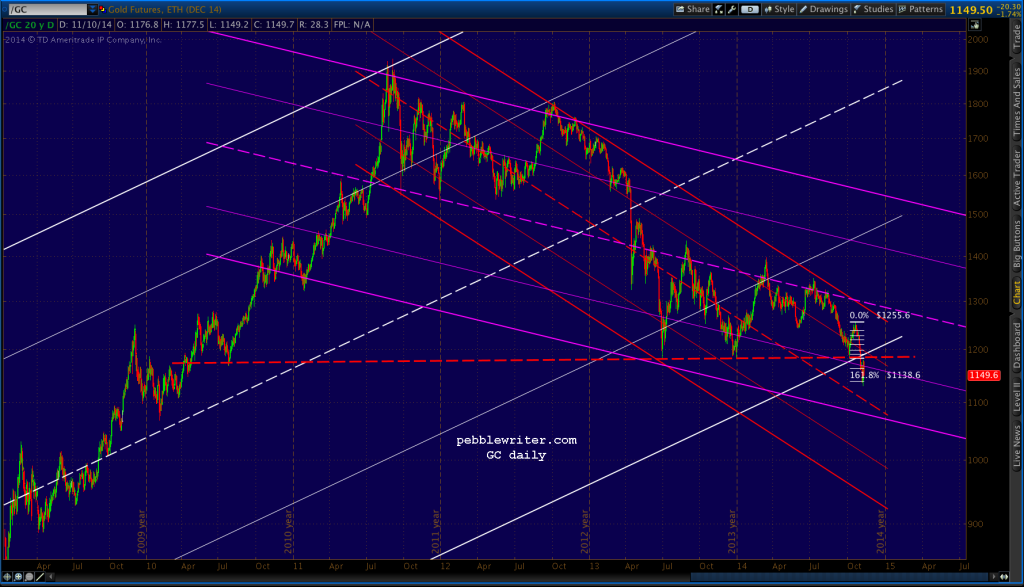
    2014-11-10-GC daily 1200 GC dropped below the red, dashed trend line of support, and is currently in the process of backtesting it.
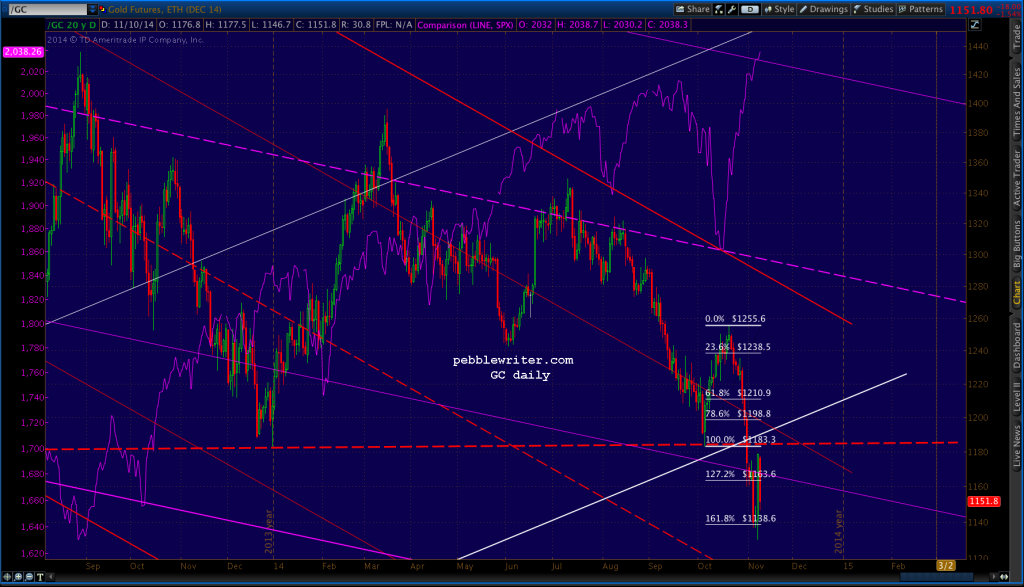
    2014-11-10-GC daily CU 1200 As stocks have repeatedly demonstrated, losing important, long-term support isn’t necessarily the kiss of death.  A timely aside by a Fed president can work wonders.  But, ordinarily, a failure to retake the broken TL would indicate lower prices to come.

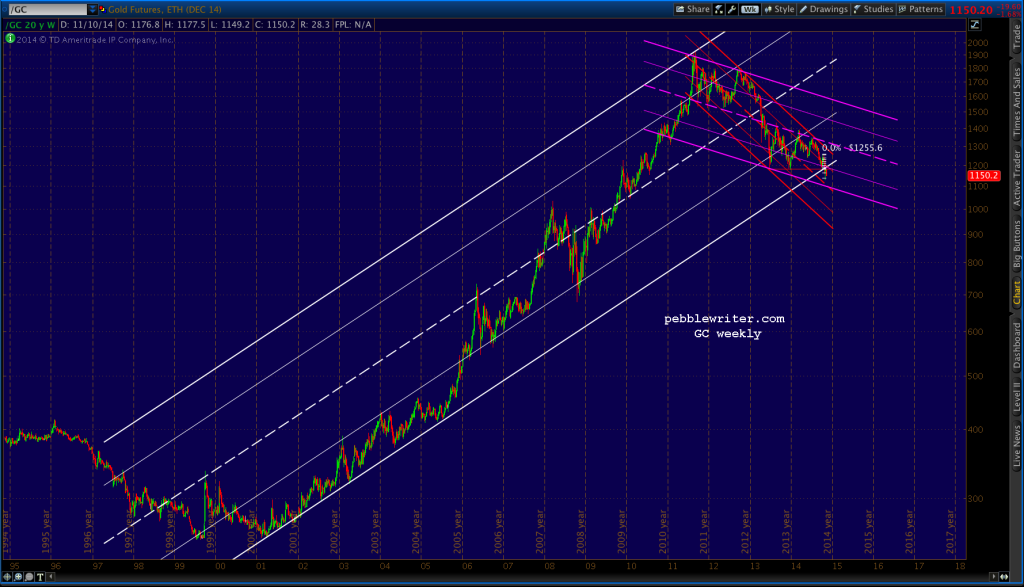
    So, I was surprised to see that Merrill Lynch’s McNeil Curry just called a bottom on gold.  Setting aside Curry’s arguments that the wave count, candle pattern and open interest are bulIish, I would readily admit that the extent of fiat creation supports the idea of a inflation-driven reversal — as does the long-term channel (I also like the idea of our 1155 Fib holding.)

    Channels like this can tricky.  A slight tilt one way or the other can make a world of difference in a chart that dates back 15+ years.  In this case, I’ll give more credence to the upside if/when the red trend line of support (now resistance) is breached.
    2014-11-10-GC weekly 1200Regarding inflation, the Fed’s all-you-can-eat approach to economic stability has spiked the money supply — but not velocity.  Prevailing wisdom is that all that cash is going to banks and corporate coffers where it is bedding down for the long, cold winters to come.

    Screen Shot 2014-11-10 at 1.46.13 PM

    If deflation is more of a threat than inflation at this point, the impetus for increasing prices would most likely be a rise in political/military conflicts, an inflationary shock (e.g. oil) or a financial development precipitating a flight to safety.

    IMO, these risks are as significant as ever.  Though, lately, stock prices have brushed them aside in a seemingly boundless central bank and algorithm-fueled melt-up.  So, should we expect gold to be any more susceptible?

    If TPTB meant gold prices to rebound from 1180 yet again, one would think they would have left the net in place at that level.  Simply put, it’s a lot more work to overcome resistance than to observe support.

    In addition, gold and equity prices have been negatively correlated lately.  If stocks are to continue rising (as central bankers everywhere are clearly hoping inciting), we should expect continued weakness in gold.  If for no other reason, they can point to it as justification for more inflation-stoking QE.

    Bottom line: if you’re burying bullion in the back yard, you probably couldn’t care less about the day-to-day swings in the financial markets.  But, if you’re a trader, keep an eye on that trend line around 1180 — gold’s line in the sand.

    If 1155 holds and gold can push through 1180, then it has significant upside to 1300 or so — the .786 Fib and a TL off the highs dating back to May 2013.  If not, the next real support doesn’t come in until 947.

  • Charts I’m Watching: Nov 10, 2014

    Should be a low-volume day, today.  USDJPY is resetting, with no knock-on effect on ES.

    2014-11-10-USDJPY 60 0600

    While, the Nikkei has completed a descending triangle — normally a bullish setup pattern.

    2014-11-10-NDX 60 0600It’ll be telling to see if it acts as such here, as NKD is technically still reacting to the yellow .886 Fib.  NKD is one of the most heavily manipulated indices (I know, it’s redundant) around.  So, any kind of drop here would offer some hints as to the script for the markets going forward.

    2014-11-10-NDX weekly 0600One development worth watching: the US dollar.  DX reacted at a smaller scale 1.618 Fib extension.

    2014-11-10-DX daily 0600

    But, it didn’t quite reach the much larger scale .886.  So, another surge isn’t off the table.  And, such surges have been bullish for stocks lately.  To further complicate matters, DX popped up through the falling red dashed trend line connecting the ’04, ’09 and ’10 tops — but not the rising purple TL connecting the ’11 and ’12 tops.

    2014-11-10-DX daily big 0600I’ll be watching DX and NKD especially closely today.

    GLTA.
