Month: April 2014

  • Heads Bulls Win, Tails Bears Lose

    Yet another display of the brokenness of the “market.”  After the 0.1% GDP Q1 GDP print, the S&P 500 futures plunged all of 4.75 points for an entire minute.

    2014-04-28-ES  1 min 0600
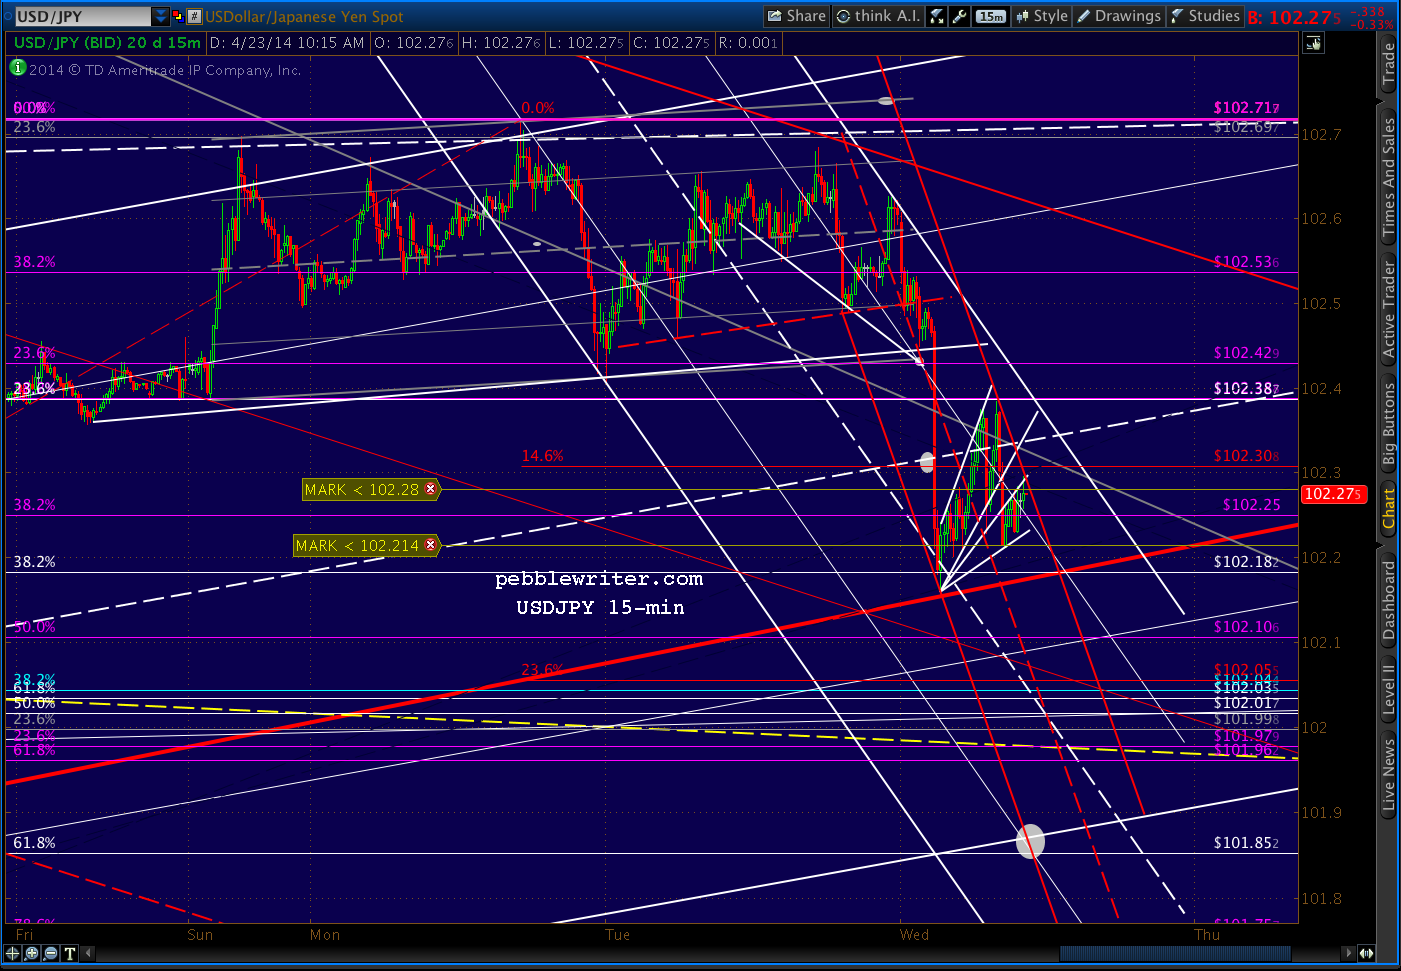
This, on the back of the ludicrousness of ignoring the plunge in the USDJPY and Nikkei overnight after the BOJ declined to increase Japan’s QQE.

    2014-04-28-ES v JPY  15 min 0600
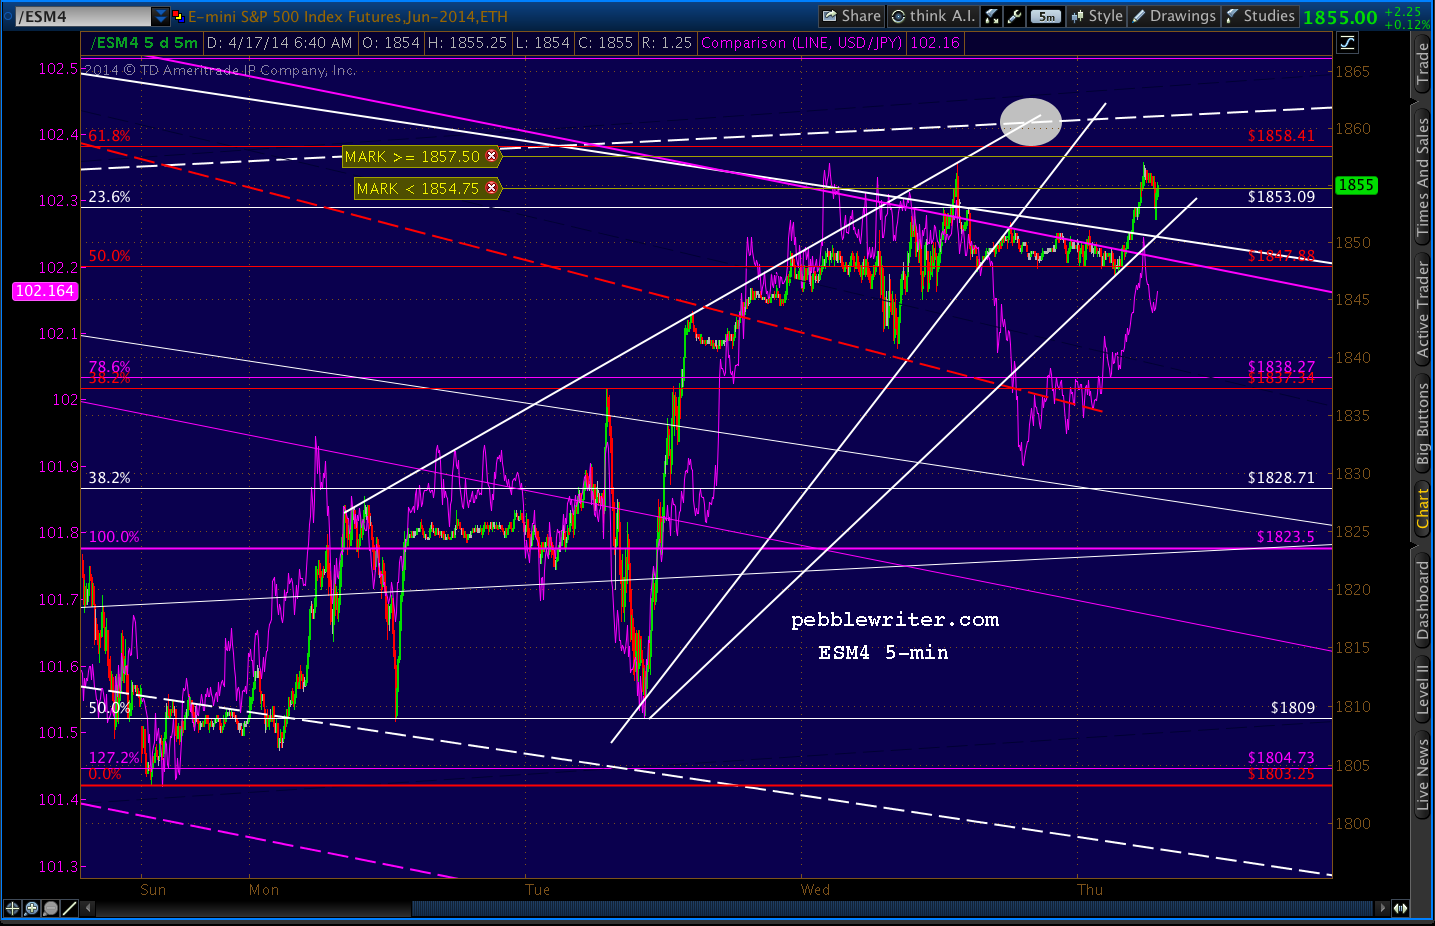
The yen carry trade is alive and well.  The correlation between ES/SPX and USDJPY is clear.  When the yen plunges (USDJPY soars), stocks soar too because the cost of repaying the 0% yen borrowing just went down.

    Conversely, when the yen rises, as it has since year-end, stocks take it on the chin — unless it’s in the after-hours when reality is suspended.  That’s why the technical patterns playing out in USDJPY and the Nikkei are increasingly completing in the after-hours, when the bots protect US stock futures from any declines.

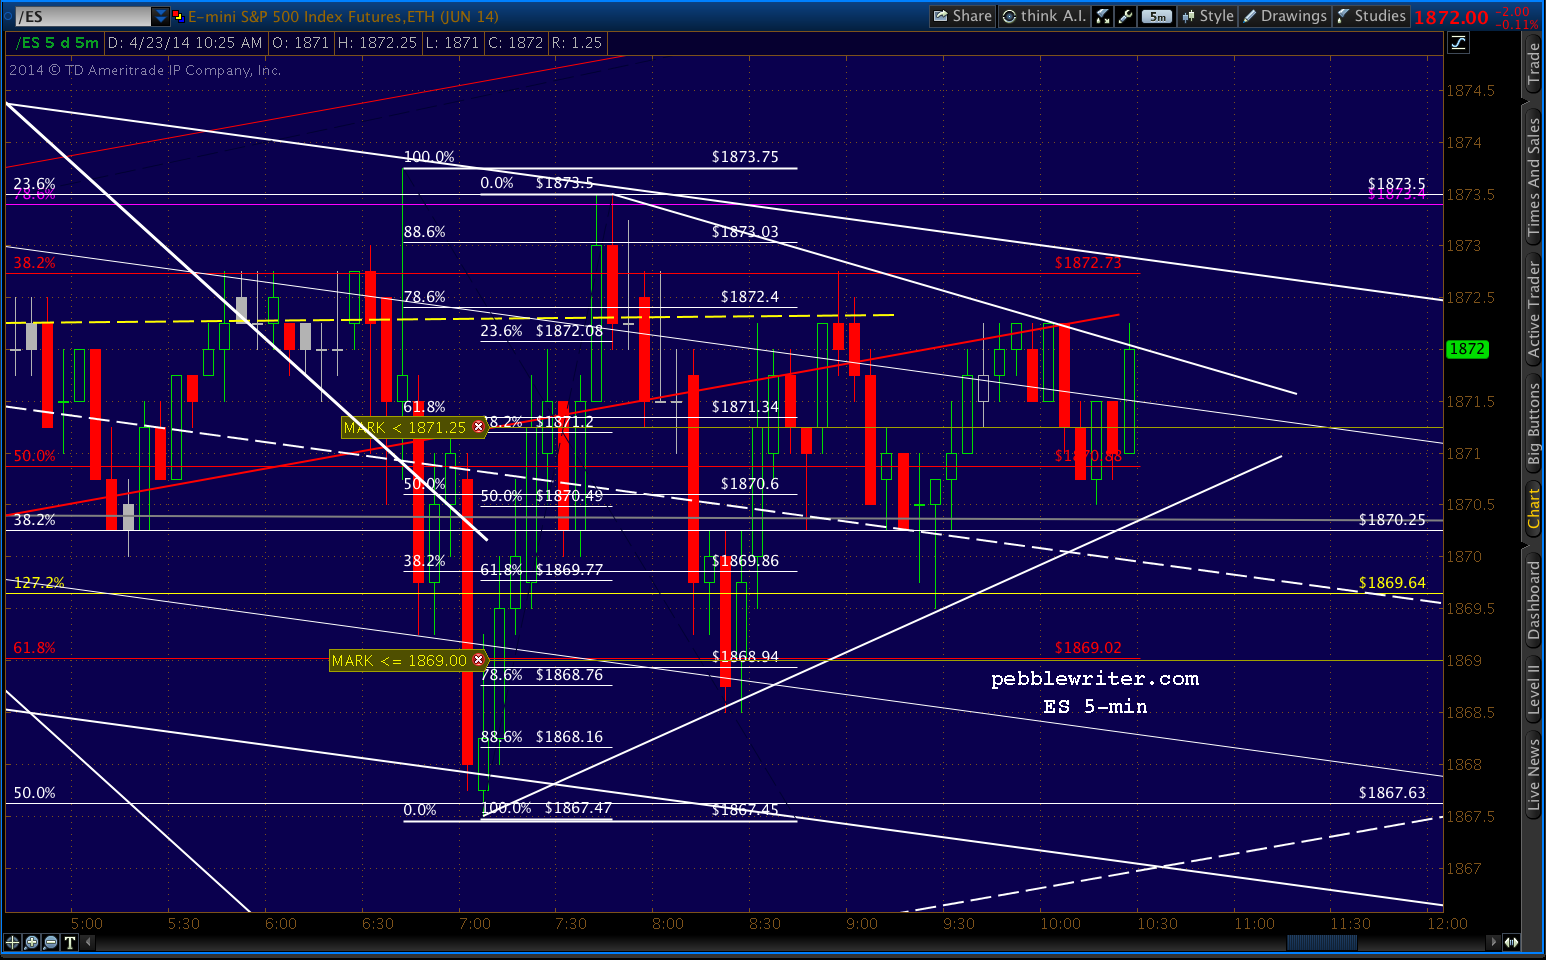
    What’s the point of all this?  How else could ES maintain a ridiculous rising channel such as the one below through the end of the month — thus printing a positive April after a positive first quarter?  BTW, on March 31 SPX closed at 1872.34.

    2014-04-28-ES v JPY  60 min 0600With US stock prices joined at the hip to a currency (the yen) which is openly being managed by the BOJ, there is no market anymore — just the reaction of traders to the intra-day whims of central bankers.

    Here’s the rub: the BOJ has discovered that QQE isn’t working.  Sure, it juiced their stock market, just like the Fed has juiced ours.  And, it’s arguably produced some inflation — though the latest 1.5% print was largely the result of the new higher sales tax.

    But, exports still suck — even with the cheaper yen.  And, the spiking price of imported food and fuel is killing Mrs Watanabe’s budget, already stretched by the increased sales tax and no real wage growth for years.

    The BOJ might like to discontinue injecting $680 billion per annum into the money supply (well, their banks’ trading portfolios), but who else is going to buy the $400 billion in new debt Japan plans to issue in 2014 to cover their gaping budget deficit?

    These are questions the Fed would do well to consider.

    UPDATE:  2:50 PM

    Post Fed announcement…same insanity.  Quick dip on ES to just below the morning lows to stop out the bulls, then — unless I miss my guess — a rally to SPX 1884.89+ to stop out the bears.    Don’t count on it going all the way to SPX 1887.83, as that would complete a Bat Pattern (the Apr 4 to Apr 11 drop) during market hours — very bad for the market, as the reversal would suggest the Apr 4 high was the end of the rally.

    The e-minis have already retraced .886 of their Apr 4 highs, so not a lot of help there.

    GLTA.

  • If It’s Tuesday…

    It’s Tuesday and it’s the end of the month — with averages needing a bit of a boost to report monthly gains.  Oh, and the Fed is kicking in a couple billion just because.

    The Nikkei futures look to be aiming for the white .618 (14,525) at the SMA20 (14,531) — also the top of the falling channels.

    2014-04-28-NKD 15 min 0613After yesterday’s reality check, USDJPY has been guided back above the red channel bottom and is backtesting the white channel midline and red IH&S neckline.  103 looks like a safe bet.  Note that the 10, 20 and 50 day SMAs are all down around the red channel bottom (102.4 – 102.46), so a backtest would be completely within reason.

    2014-04-28-USDJPY 15 min 0613SPX is still positioned to complete an IH&S, though as we noted yesterday there is stillthe gap down at 1844 to close.  And, just a reminder, the original conventional H&S is still in play — at least until the head is topped at 1897.

    2014-04-28-SPX 60 min 0620The only issue is SPX has heavy resistance at 1880.98… meaning it might have to wait until the after-hours to get over the hump.

    GLTA.

  • Charts I’m Watching: Apr 28, 2014

    SPX is working on the possible IH&S we talked about last week.  The purple channel is not set in stone; so, equities will have some decisions to make very soon.

    2014-04-28-SPX 60 0730Likewise, though the right shoulder is low enough to be roughly symmetrical to the left (relative to the neckline), there’s a gap left open down around the white .618 (1844 on Apr 15) that suggests a more complex right shoulder could play out.

    The Nikkei continues to drive the USDJPY, which continues to drive SPX/ES.  And, unfortunately, NKD is a mess since it last bounced off the neckline of a large H&S Pattern.  It will likely continue to consolidate in a narrowing triangle — which probaby means more chop.

    2014-04-28-NKD 4hr 0834

  • Big Picture: Apr 25, 2014

    Lots of charts to post this morning — commentary later as there’s time.  The news came out yesterday that Japan has exceeded its inflation targets. No more deflation, no more need to inflate the economy through QQE.

    Though corporations have benefited from a lower yen (though you couldn’t tell from their stock market lately), the people are feeling the pinch from more expensive imports — particularly food and oil.

    The BOJ sounds like they probably will give QQE a rest, meaning the yen will rise and the carry trade will unwind — very bad for risk assets everywhere.  Note, this doesn’t mean they will give up manipulating the currency and equity markets through strategic purchases as they have been.  But, the effect shouldn’t be as great — and, investor expectations of a 105 USDJPY anytime soon should finally be laid to rest.

    The USDJPY fell to our latest target, as did the Nikkei.  ES is off a bit, but right to channel support.  If the channels and yesterdays’ lows hold, we should see the beginnings of a nice rebound.  If they break — and, especially if the USDJPY plunges below the yellow channel midline — we should see a quick drop to 1850ish.

    First, USDJPY is backtesting the falling yellow channel midline.  Bulls need a push back above the rising red channel bottom and falling grey channel top.  By letting the pair drop in the after-hours, they avoided the whoosh that might have accompanied a plunge with heavy equities volume.

    2014-04-25-USDJPY daily CU 0615

    2014-04-25-USDJPY daily 0615

    2014-04-25-USDJPY 60 0615

    2014-04-25-ES 15 0615

    2014-04-25-ES daily CU

    2014-04-25-ES chnls only CU

    2014-04-25-ES chnls only medThe channels from the 2009 lows… Note that neither the purple nor the red are currently in align.

    2014-04-25-ES chnls only bigFibonacci levels only…

    2014-04-25-ES fibs onlyUPDATE:  10:30 AM

    I’m watching the dashed purple TLs on both SPX and ES — very close to the small 1.272’s and perfectly in sync with a similar setup on USDJPY.

    2014-04-25-SPX 15 0727 2014-04-25-ES 15 0727 2014-04-25-USDJPy 15 0724The big difference is that ES and SPX have retraced just a small fraction of its rise from Apr 15, while USDJPY has retraced .618.

    A stop at the red 1.272 isn’t justified, as the correct target Fib should be the 1.618.  But, that hasn’t stopped the bulls before.

    As we noted several times lately, this decline feels very tightly controlled — letting the air out, buying heavily with any sense that things are starting to get out of control. And they likely will if USDJPY goes tapioca during market hours.

    If these purple TLs and 1.272s break, watch the red 1.618’s and then the idealized IHS right shoulders marked above.

    SPX presents an interesting choice of right shoulder targets depending on which of the falling red or purple channel is correct.  If red, this is a backtest.  If purple, the midline is down at 1833, also the bottom of the rising red channel.

    2014-04-25-SPX 60 0753GLTA.

  • Charts I’m Watching: Apr 24, 2014

    The red channel broke down intra-day, but is back in business.

    2014-04-24-ES 60 0610The close-up shows the 4:01 rally that screwed cash market traders who shorted the red channel breakdown.  The overnight ramp job on up to the .886 was the salt in the wound.  Just to be clear, this is not a market.

    2014-04-24-ES 15 0610After tagging the red channel bottom for the second time in a week, USDJPY has put in a strong A-B-C move to a TL (red, dashed) off the Apr 21 and Apr 22 highs.

    2014-04-24-USDJPY 15 0610Note that each day’s push beyond the falling grey channel boundary has failed. This one represents the first higher high in the past week, so it’s a more strenuous effort to break the trend.

    Whether or not it can is not terribly relevant, as SPX/ES don’t require new highs on USDJPY (thin purple line below) to play the carry trade game.  Rehashing the same old highs seems to work just fine.

    2014-04-24-ES v JPY 60 0629UPDATE:  10:29 AM

    USDJPY saw an impressive reaction off that TL — took it all the way back to the red channel bottom and back inside the grey channel top.

    2014-04-24-USDJPY 5 0728There’s another TL here that might offer support at a .500 Fib level, but 101.96 would be stronger support at the .618 and yellow channel midline.

    2014-04-24-USDJPY daily 0735The bulls need a push back above the red channel bottom muy pronto, but a bounce at 101.96 would make for a stronger move.

  • Charts I’m Watching: Apr 23, 2014

    No more QQE.  That’s the upshot of the news out of Japan last night.  According to BOJ’s Kuroda, inflation may already be running a little higher than desired — a fact we noticed a couple of months ago [see: Sayonara Abenomics.]

    Screen Shot 2014-04-23 at 6.04.51 AMNeedless to say, USDJPY fell out of bed at the news.  It zipped down and tagged our red channel bottom — the second precision landing in a week.

    2014-04-22 USDJPY 60 0528While the red channel bottom held the latest drop, a dip to the white channel bottom would make for a nicer fit.

    2014-04-22 USDJPY 15 0532It took ES a while, but it finally got with the program.  Note the small red channel within the rising white channel.

    2014-04-22 ES 15 0536ES could continue tracking within the red channel, or it might take the opportunity to expand its horizons with a tag of the white .886 at 1864.80.  A break out of the falling white channel and above the purple .786 at 1873 would likely signal the .886 at 1882.

    2014-04-22 ES 15 0536 CUNew home sales come out at 10AM.

    UPDATE:  1:15 PM

    Another day of very sloppy, misshapen chart patterns.  The guys pulling the strings are so eager to prevent a sell-off that they’re making a pathetic mess of things.  USDJPY hasn’t broken the red channel bottom yet.

    The fans on the bottom could count as a continuation pattern targeting 101.85.  It would look better if it were a flag or pennant.  But, honestly, it’s anyone’s guess.  The bears would benefit if the grey channel line were able to stop any further advances.

    2014-04-22 USDJPY 15 min 1016Likewise, ES has formed a triangle — a classic sign of indecision — where it makes absolutely no sense to have one.

    2014-04-22 ES 5 1028I guess the intent is to keep ES close enough to the .786 (1873) to take a run at the .886 (1882) and the former high in the final hour of trading. The white channel top could serve as the neckline of an IH&S.

    But, technically, the broken red channel is just being back-tested — with four attempts to retake it having failed so far.

    The time involved in getting to this point has made getting down to the red .886 at 1864 problematic, with the red .786 at 1866 now more likely.  But, even that will take some doing.

    Every tick higher on USDJPY gets amplified in ES/SPX.  While, every tick lower is ignored.  The result is a divergence between the two that will be resolved one way or the other.

    2014-04-22 ES v USDJPY 15 1047

  • Charts I’m Watching: Apr 22, 2013

    Very sloppy pattern in ES…

    2014-04-22-ES 15 0615…especially when seen from a distance and compared to USDJPY (thin purple line.)

    2014-04-22-ES 60 0620It’s trying to ramp up through the purple midline, but Japan isn’t helping much.  The Nikkei tumbled overnight after tagging the purple .618, but found support in the rising white channel.

    2014-04-22-NKD 60 0620And, USDJPY is being constrained by two falling channels and the rising white channel top, not to mention the .500 Fib.

    2014-04-22-USDJPY 60 0620This would be an opportune time for the bulls to engineer a 35-pt dip in SPX to set up an IH&S.  But, that would require allowing stocks to actually decline (and, a little imagination — not a strong suit for the bots.) The .786 is up at 1879.45.

    2014-04-22-SPX 60 0635UPDATE:  12:35 PM

    More melt-up nonsense.  ES and SPX barely paused at their .786s, pressing ahead on no volume.   Seem to be targeting the top of the acceleration channels, but the .886s are coming into view at 1882.33 and 1887.74.

    DJIA should tag its .886 any minute thanks to the preposterous channel below (not even the pretense of reality.)  Will it even matter?  NKD is aiming for 14540 and USDJPY for 102.64 (initially, 102.68-70 if it breaks through.)

    2014-04-22 DJI 30 0945

  • Charts I’m Watching: Apr 21, 2014

    I hope everyone had a happy Easter holiday.  We’ve had a relatively quiet Sunday and early Monday in the markets — with the futures up only slightly despite a strong rally in the USDJPY.

    2014-04-21-ES 60 0620

    Could be that investors don’t really see the currency pair going anywhere — as the Nikkei’s price action doesn’t support it.

    2014-04-21-NKD 60 0620 2014-04-21-USDJPY 60 0620We have leading economic indicators coming out at 10AM, and today’s POMO purchases are scheduled at $3.25-4.0 billion.  Lots of earnings are also due out this week — 150 of the S&P 500.

    Last Wednesday and Thursday had all the hallmarks of a breakout, but on very weak holiday style volume.  In addition, VIX fell to only the .886 of its latest rally and 10-year notes rose only to well-defined resistance.

    2014-04-21-TNX daily 0635

    In other words, the breakout wasn’t as believable as it could have been.  Trade safe.

  • Charts I’m Watching: Apr 17, 2014

    The SPX target — the .618/.886 combo at 1865 — is pretty clear.

    2014-04-14-SPX 60 0620Two minutes before the opening bell, however, ES was hit by some large sell orders in order to shake out the weak bulls.  This was precipitated by a sell-off in USDJPY — shown in purple.

    2014-04-14-ESM4 5 0640It obviously caught some traders off-guard, especially considering how effectively they propped up ES in the face of USJPY’s huge losses overnight.

    It’s a good reminder of a subject I’ve been meaning to bring up.  Along with all the usual overnight manipulation, market makers have lately taken up the practice of aborting rallies just short of an obvious turning point such as a key Fib level.

    Consider yesterday’s improbable rally after Janet Yellen repeated, for the nth time, what she’s been saying for the past several months.  ES rallied 16.25 points into the cash close, only to put the brakes on at 1857, 1.41 points shy of a major .618.

    It had been a low-volume ramp job designed to reinforce the importance of continued Fed assistance, so a little more go-juice would have been required little effort.  But, turning points reached during market hours can attract a lot of sellers with big volume.  And, TPTB don’t want those guys getting into the picture when they can do serious harm.

    I’ve seen this happen countless times over the past few months.  Often, a target is tagged and we get a reversal in the dead of night, leaving traders with a choice between leaving profits on the table or staying up all night.

    Other times, the ramp job runs prices through the turning point, rendering it moot.  This is especially common on weekends and holidays, when there’s a longer gap between sessions and market normalcy is in exceptionally short supply.  It wouldn’t surprise me to see it happen again this weekend.

    The latest example is SPX’s most recently completed Head & Shoulders Pattern, the neckline of which was broken during Wednesday night’s ramp job.  A normally reliable pattern, the H&S has lately become an almost certain bear trap.

    2014-04-14-SPX HS 0730Either way, it’s an example of just how dangerous and difficult the “markets” have become, when seemingly every move is scripted to keep day traders and swing traders off balance (note the number of breakouts and breakdowns without any follow-through in the past few months.)  As the regular rules break down, it begins to make scalping more appealing than swing trading.


  • Charts I’m Watching: Apr 16, 2014

    Still on the road today.  Here are the key charts to watch.

    The yen carry trade continues to drive the equity “markets”, as investors are zeroing in on the BOJ’s next meeting at the end of the month — certain that more QQE is on the way.  We’ll see…

    The USDJPY had a late session ramp, erasing the earlier losses and taking the pair back above the red channel bottom yet again.

    2014-04-14-USDJPY 60 0620We should see some follow-through today if the rising white channel below is correct.  It’s a flag pattern, of course, so the implication is a continuation of the downward trend — perhaps at the red .618?

    2014-04-14-USDJPY 60 0620 CULike many days, lately, the overnight ramp took a very logical channel that didn’t happen to agree with the bullish scenario and, basically, trashed it.  Note the action on the Nikkei — which is a major determinant of USDJPY.

    2014-04-14-NKD 60 0634The falling purple channel, having backtested the midline, should have returned to the .236 and eventually the bottom of the purple channel.  But, that would have meant the multiple H&S Patterns playing out — and another 100+ points to the downside.

    Solution?  Trash the falling red channel by ramping up the NKD overnight, bust the purple midline, and throw everything into disarray.  The NKD is now in no man’s land, and completely undecided about what happens next.  It’s not unusual when bulls are defending a neckline.

    The same thing happened to ES, of course, with similar results.  In a normal market, prices would have already declined to the white .618 at 1789.

    2014-04-14-ESM 60 0812Of course, in this case “the bulls” are led by the BOJ, which buys equity ETFs along with the billions in debt.  Other investors are willing to go along for the ride; but, it’s very hot money that will flee the scene if the yen should continue to strengthen.

    Just a reminder: on April 8, BOJ’s Kuroda dismissed the need for additional stimulus — and, the market promptly tanked.  Numerous Fed governors are speaking today, and their comments will no doubt determine the market’s direction.

    And, that’s essentially what the market has become lately: a tug of war between the carry trade-oriented banks funded by the Fed with no-cost billions and those who don’t, for one minute, believe the MSM hype and see deep-rooted problems in the fundamental picture.

    The Fed, the ECB and the BOJ are doing their best — through both direct and indirect intervention — to prop up the markets for their banking overlords, even though it has created more bubbles to replace the ones that burst so spectacularly in 2007-2008.

    They will allow occasional small declines in the markets in order to let the air out and deflect criticism that the markets are rigged (they are.)  Notice how managed this “correction” has felt?  But, otherwise, nothing bad will ever happen…right?

    The problem is that they simply can’t control everything.  As the BOJ has learned, the costs of QQE are beginning to grossly outweigh the benefits.  Sure, Toyota is selling more Camrys. But, fresh food is soaring in price (as in most corners of the world) and fuel has become so expensive that they’re turning their nukes back on.

    And, what happens if the markets really stumble, and all that hot money comes flooding back into the yen?  There are enough hot spots around the world that sooner or later, something will spiral out of control.  And, overnight ramp jobs and cheerleading from the Fed won’t be enough to stop the bleeding.

    UPDATE:  12:30 PM

    The market hasn’t exactly spiked after Yellen’s speech was released.  ES tagged the SMA20 and retreated a little, but I assume it will make a run for the red .618 at 1858.

    2014-04-14-ESM daily 0920GLTA.