Month: November 2013

  • Happy Thanksgiving!

    I hope everyone is enjoying a relaxing holiday weekend.   Equity markets close at 1PM EST today.

    Most of the indices and currencies we watch have been coiling — tracing out triangle or flag patterns this past week.  A break out is now imminent, but it will be a trap.

     continued for members(more…)

  • Breaking Up is Hard to Do

    Do you love this rally?  Are you ready to throw caution to the wind and plow every last cent into stocks?  If your answer is “no”, you’re in good company.

    Triangles are all about indecision.  And, we’ve got plenty of that.  Jumping in at all-time highs feels just plain insane — despite the cheerleading from the boob tube crew.

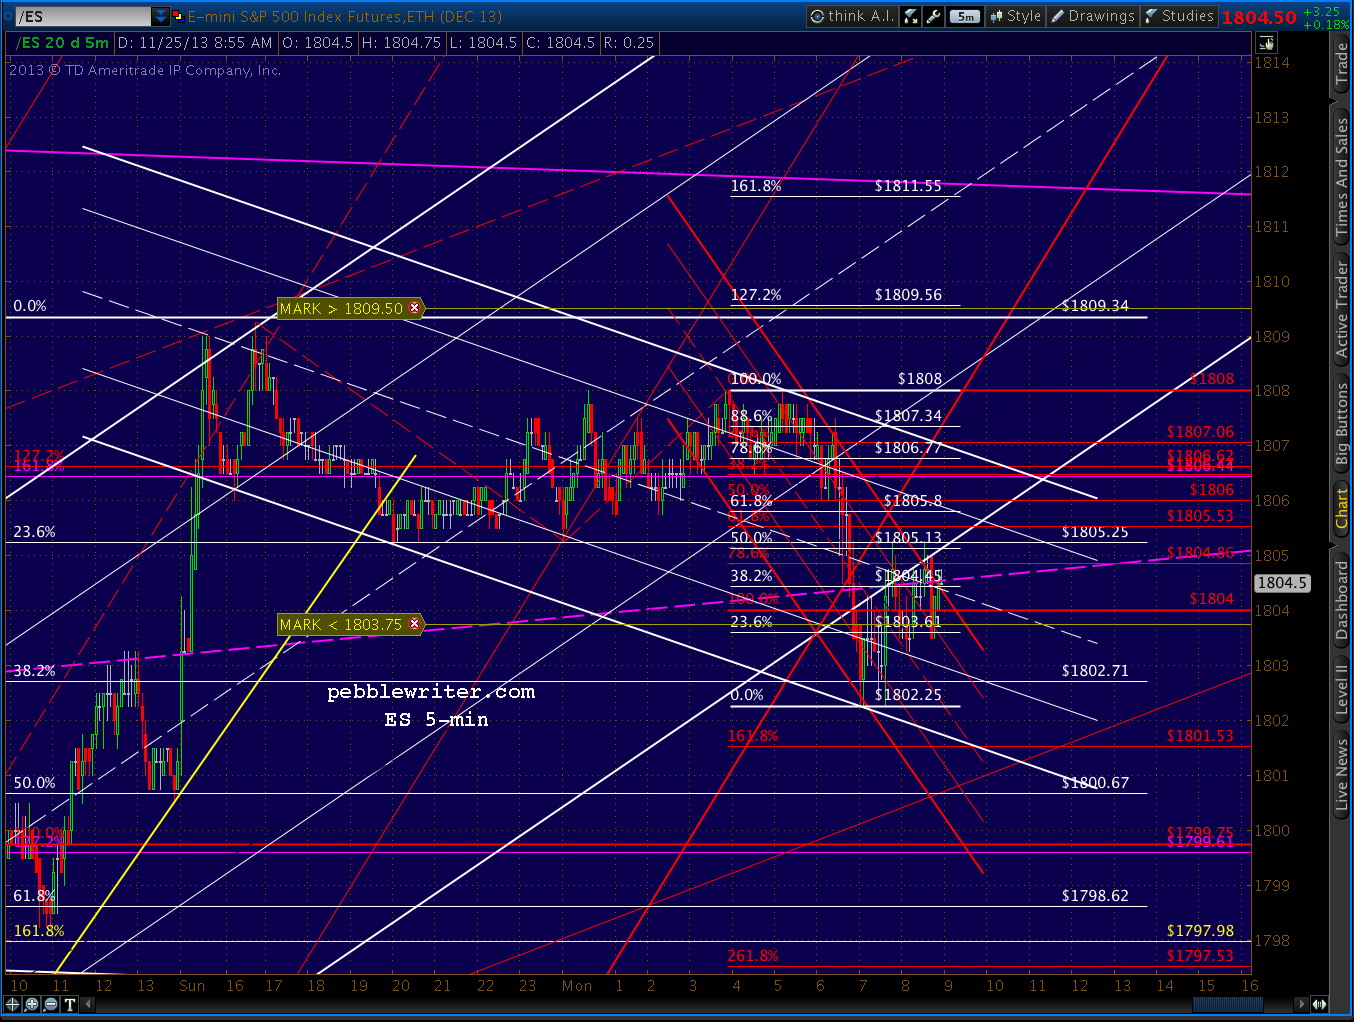
    Yet, there’s a little more upside left — or, so say the harmonics.  We just need to break up through this triangle…and then navigate the mine field of harmonic and channel resistance that awaits.

    The important patterns at the moment are:

    • breaking 1807 and putting the purple pattern out of business
    • breaking through the purple channel midline
    • getting past the light blue .886 at 1808
    • topping 1809.25.

    Since the .886 and purple midline are both around 1808, we’ll keep a close eye on things there.

    The dollar’s harmonics suggest a sizable drop to 80.06 or so.  But, there’s the possibility that this counter wave will extend a little further to the channel top before selling commences.

    UPDATE:  11:40 AM

    ES broke up through the triangle top, reached 1807.50, and is currently back-testing. One word of caution: what happened yesterday with the break above the IH&S neckline could happen again.

    The 1798 level has attracted a tag twice now.  A third tag at the white channel bottom later today (the purple circle) would make for a well-formed flag pattern… and, flush out all the weak bulls sitting in traffic or on a tarmac on the way to Grandma’s, secure in the knowledge that their stops will protect them.

    UPDATE:  12:00 PM

    DX just tagged a TL connecting the last two tops and the purple channel midline. And, the red .618 is just above at 80.819.  A reversal should be close at hand.

    UPDATE:  12:25 PM

    Interim target?

  • Charts I’m Watching: Nov 26, 2013

    Another day, another case of whiplash.  The dollar is indicative of the volatility — a downtrend to the white .886 that reversed back up to the .382 before heading lower, right?  After retracing about 101% of Sunday’s low, it reversed and regained the white channel — only to abandon it again this morning.

    The EURUSD has been almost as schizophrenic, reversing after completing a Bat Pattern — but failing to break out after the catch at the white .500.

    The USDJPY broke out of a very well-formed channel (in white below) a few days ago with an even better-looking channel (in purple), only to put in a backtest that’s a full-on nail biter.

    The close-up:

    Then, there’s the equities markets…we’ve got dueling H&S Patterns (both bullish and bearish), violated Harmonic Patterns and violated channels coming at us right and left.

    This morning’s post-consumer confidence plunge (completing an H&S Pattern) probably had more than a few bulls reaching for the sell button.  But, it stopped .25 shy of yesterday’s low and recovered the neckline in a matter of minutes.

    What does it all mean? (continued for members)

    (more…)

  • The End Game

    Things are on track for the big Butterfly pattern to complete very soon — even as soon as later this morning. For those who have been following this website for any length of time, this is a major milestone we’ve been anticipating since Mar 29, 2012 — shortly after this website was launched [see: All the Pretty Butterflies.]

    The S&P 500 is one of many major indices approaching or reaching important Fibonacci reversal levels, as we discussed last week [see: Around the World.]

    To recap the current state of affairs…

    • The Nikkei reached 15,597 this past Friday.
    • The NYA already came within 13 points of our 10,239 target.
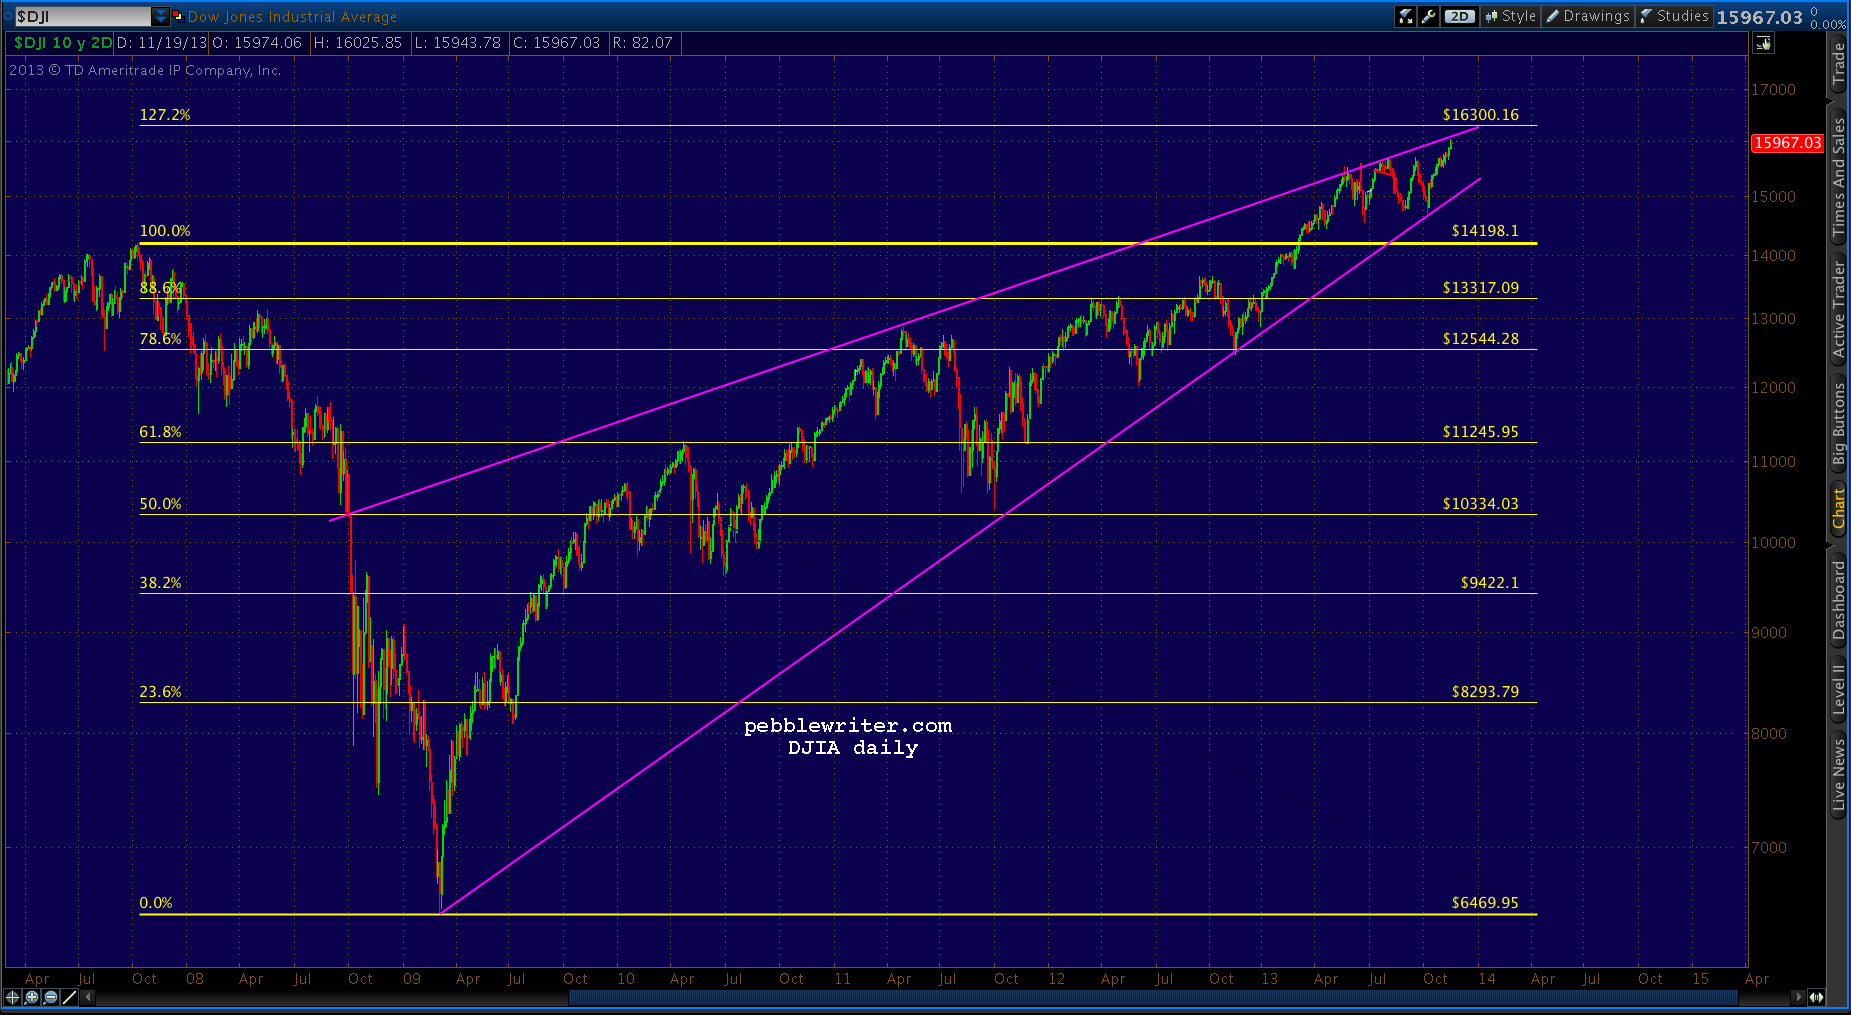
    • The DJIA is only 200 points from our 16,300 target.
    • The FTSE 100 is only 6 points away from our 677 target.
    • And, SPX is only 15 points away from the 1823 target.

    It bears repeating that these harmonic targets — being so large and from such a long time ago — rarely provide on the nose reversals.  The April 2010 reversal, after climbing from 666 to 1219, came up 9 points short of the .618 Fib level.

    The May 2011 Gartley Pattern completion came up 11 points shy of the .786.  The September 2012 Bat Pattern completion, on the other hand, overshot the target by a couple of points.

    Bottom line, when you’re within 1% of a target after a 1,142 point move (from 666 to 1808) it’s hard to predict exactly where things will turn.  It also bears repeating that these patterns, though not known to all, are known to many large institutions that — with relatively little money — could decide to blow them out of the water if it suits them.

    These are the same institutions which have a very strong vested interest in a market that never, ever declines.  They peddle mutual funds, underwrite stocks and bonds, facilitate M&A transactions, and have huge trading books of their own (not to mention trillions in derivatives.)

    With the Fed throwing free money at them, how hard would it really be to run prices up past a key resistance level?  We’ve seen it happen many times in the past year alone.

    As always, trade safe.  Volatility will be elevated this week.

    UPDATE:  9:40 AM

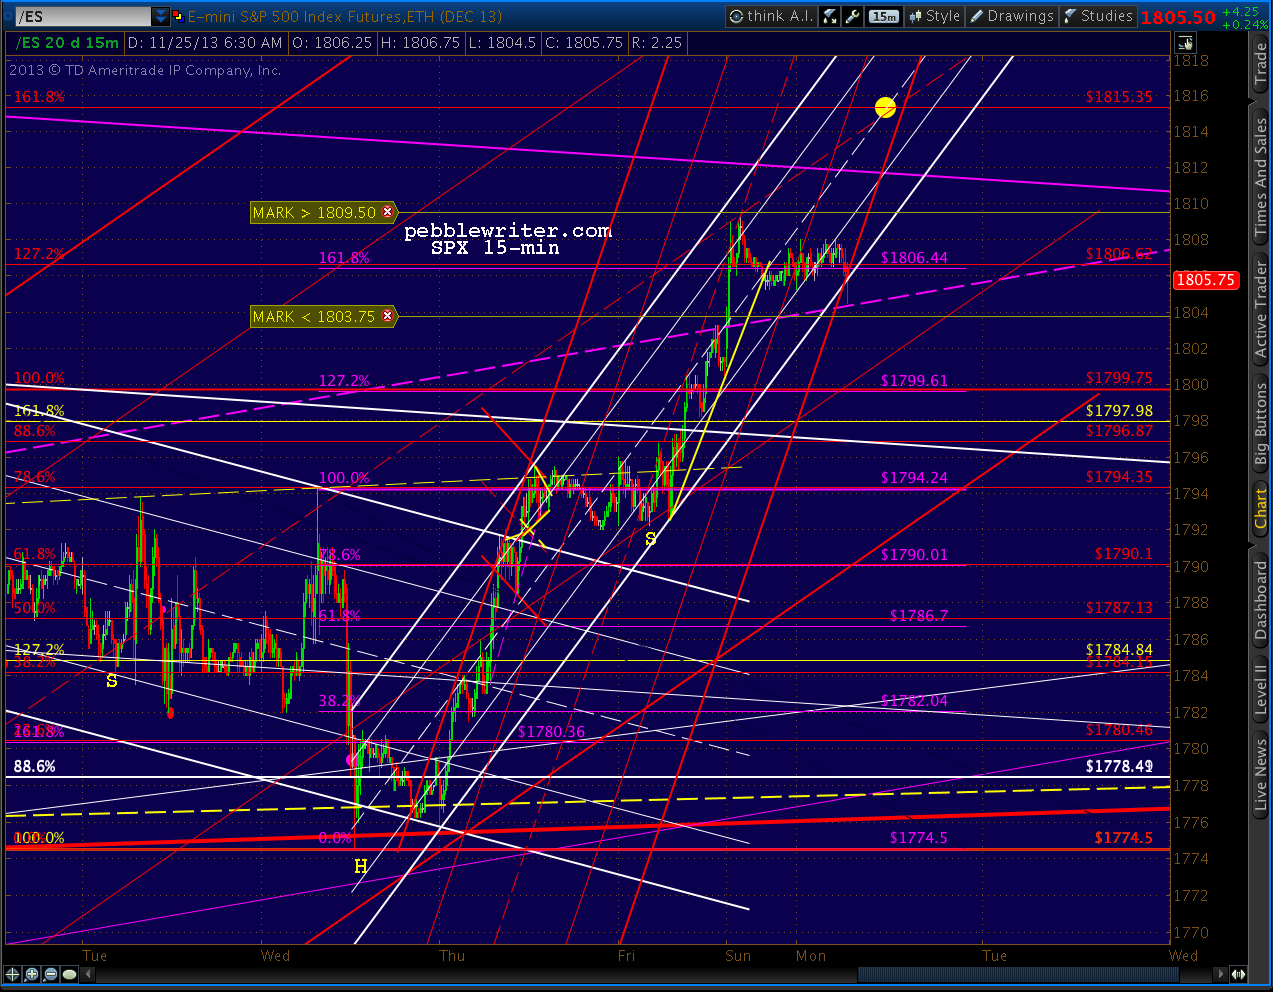
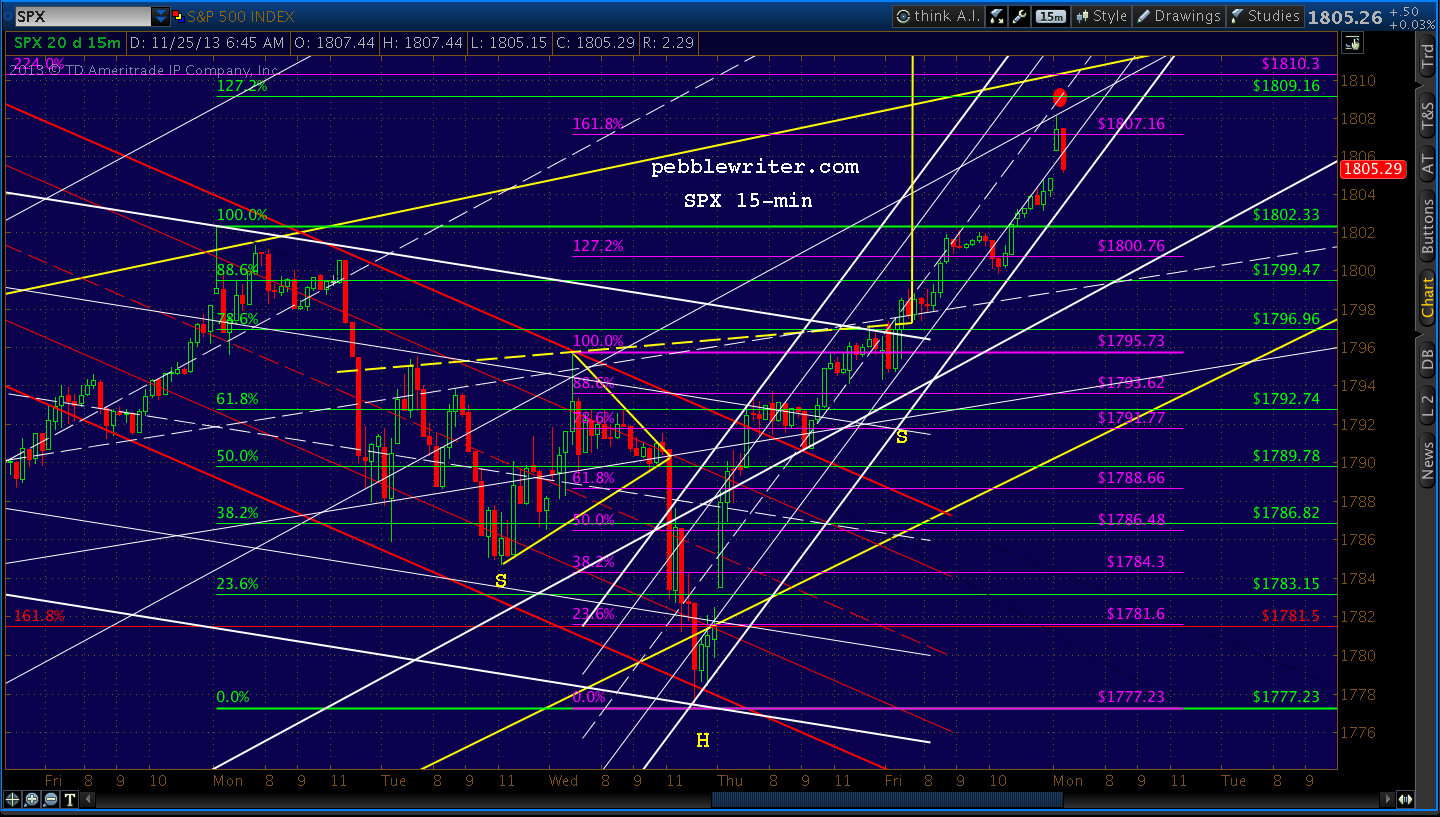
    ES just backtested the purple channel midline and should be headed for the red 1.618 at 1815.35 as soon as SPX fills this morning’s gap (1804.84.)

    UPDATE:  10:00 AM

    SPX gap almost filled, should flesh out the rising white channel.

    UPDATE:  11:55 AM

    ES and SPX are a little out of sync.  ES overshot the purple midline, and has been straddling it ever since — hinting at a backtest of the last minor top at 1800ish or the white .500 at 1800.67.

    UPDATE:  3:10 PM

    ES just reached 1800.50, which should offer decent support.  As mentioned earlier, we should see a reversal here.  If it slips any lower, the next support is at 1798.59.

  • Moment of Truth

    With markets approaching potential reversal targets in numbers, next week should be the moment of truth for the Fed’s experiment in wealth creation.

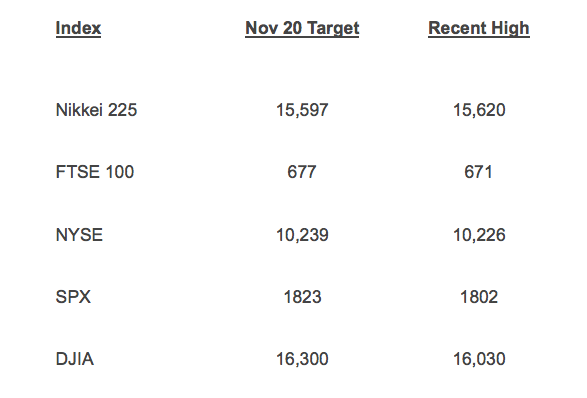
    Targets from two days ago [see: Around the World] versus yesterday’s close:

    Index Nov 20 Target Recent High
    Nikkei 225 15,597 15,620
    FTSE 100 677 671
    NYSE 10,239 10,226
    SPX 1823 1802
    DJIA 16,300 16,030


    The dollar is holding on to a well-developed channel after reaching and backing off our upside target.  The falling purple channel is pure conjecture at this point, having not even left the station.

    One possibility for the E-mini’s:

    UPDATE:  11:30 AM

    If it seems like ES has been stuck in the mud all morning, blame SPX.

    It’s just now finally reaching the .886 Fib level that the E-minis reached at 10am.  In the meantime, ES completed a nice little Crab Pattern that should help kickstart a proper right shoulder for the IH&S we talked about yesterday.

    I can’t say exactly how far, but a 10-pt drop would fit the channels quite nicely: ES1788 and SPX 1789.

    UPDATE:  12:00 PM

    Or…not.  The tiny H&S is kaput, hard to say about the IH&S.  The existing RS is only 1/3 the size of the left.  It’s not a deal killer, but it’s not ideal.  If the breakout is to hold, we should get no more than a backtest of the neckline.

    On the other hand, the trajectory is pretty darned steep.  Maybe it’s decided it doesn’t need the IH&S.  Maybe it’s going for a neckline at the double top.

    Maybe TPTB decided it was too risky from a harmonic standpoint to leave the 1799.75 high out there (it would leave open the possibility of a bearish pattern.)  It’s what I would do if I were in charge of ensuring ES 1837 by 3:30AM Monday morning.

    The same thing just happened to DJIA, with a break above the previous high in an obvious IH&S situation.

    But, the rising wedge is still very much intact; so, it’s not necessarily over — despite breaking the neckline.

    We’ll see if it can break out past 16,036.22.

    UPDATE:  3:40 PM

    Breakouts all over the place.  ES has topped 1803 again and is heading for 1806.44, with the next resistance at 1815.35 and then the big kahuna at 1837.26.  For SPX, it’s 1807.16, 1817.84 and 1823.42.  As discussed Wednesday, the futures could top out as early as Sunday night.

    Downside target should be in the 1700 range; but, I have a lot more work to do on it.  And, don’t take this to the bank, folks.  Just because it’s worked on the .618, .786 and .886, there’s no guarantee it’ll work at the 1.272.  There are a lot of vested interests out there who will work to prevent any downturn at all.

    And, that’s the key to Harmonic-based trading.  The Fib levels clearly point out where reversals might occur. It’s up to the nimble trader to figure out whether or not a reversal will occur.

    If the überbulls are right and we’re about to experience a 90’s style market, 1823/1837 could slip past with nary a whimper.  As always, use stops and trade safe.

    Have a great weekend, everyone.

  • Reset or Retreat?

    Every once in a while the market needs a little reset.  The bullish sentiment gets too high, and they need to let just a little air out in order to prevent the balloon from bursting.  But, funny thing about these resets: they can get out of hand.  Yesterday’s came very close to doing so, and it will take a very strong performance these next couple of days for the bulls to be firmly back in charge.

    The E-mini fell through several levels of support, finally bottoming out where it needed to: 1774.50.  As it rebounds today, the first real test should come around 1790 where it runs into a couple of channel lines as well as the red .618 and the purple .786.

    continued for members(more…)

  • Around the World

    Today’s the biggest economic data day we’ve had in a while:

    Just in case that’s not enough to move the market, many global markets are nearing important potential turning points.

    Japan’s Nikkei is nearing its .886 retrace of its drop from May 22 at 15,997.

    The FTSE 100 is nearing an .886 at 677.84.  But, more importantly, it’s already completed a triple top (6875 in June versus 6950 in 1999 and 6754 in 2007.)

    The NYSE just completed a couple of Crab Patterns and has another one just above current levels at 10,239.

    SPX completes a huge Butterfly Pattern (of the 2007-2009 crash) at 1823.

    Ditto for the Dow at 16,300.

    Should be an interesting day…

    UPDATE:  8:35 AM

    Retail sales came in slightly higher than expected, but below expectations ex-cars.  CPI fell 0.1% thanks to falling gas prices — the first drop since April.  NAR releases ficticious existing home sales at 10AM ET and the FOMC market forecast minutes come out at 2PM ET.

    This should be good for a little spurt in the markets.  Not sure it’s time to chase it just yet.  Charts in a few…

    UPDATE:  9:00 AM

    Should get a reversal here on ES at 1789.50 for a completed Bat Pattern.  The key will be remaining above the white channel top.  If not, look out 1780.

    UPDATE:  9:55 AM

    So far, so good.  Let’s take a look at the rest of the day.

    continued for members(more…)

  • Charts I’m Watching: Nov 19, 2013

    Welcome to Whipsaw City.  Population: dwindling.  This is the kind of market designed to shake out those who are easily spooked.

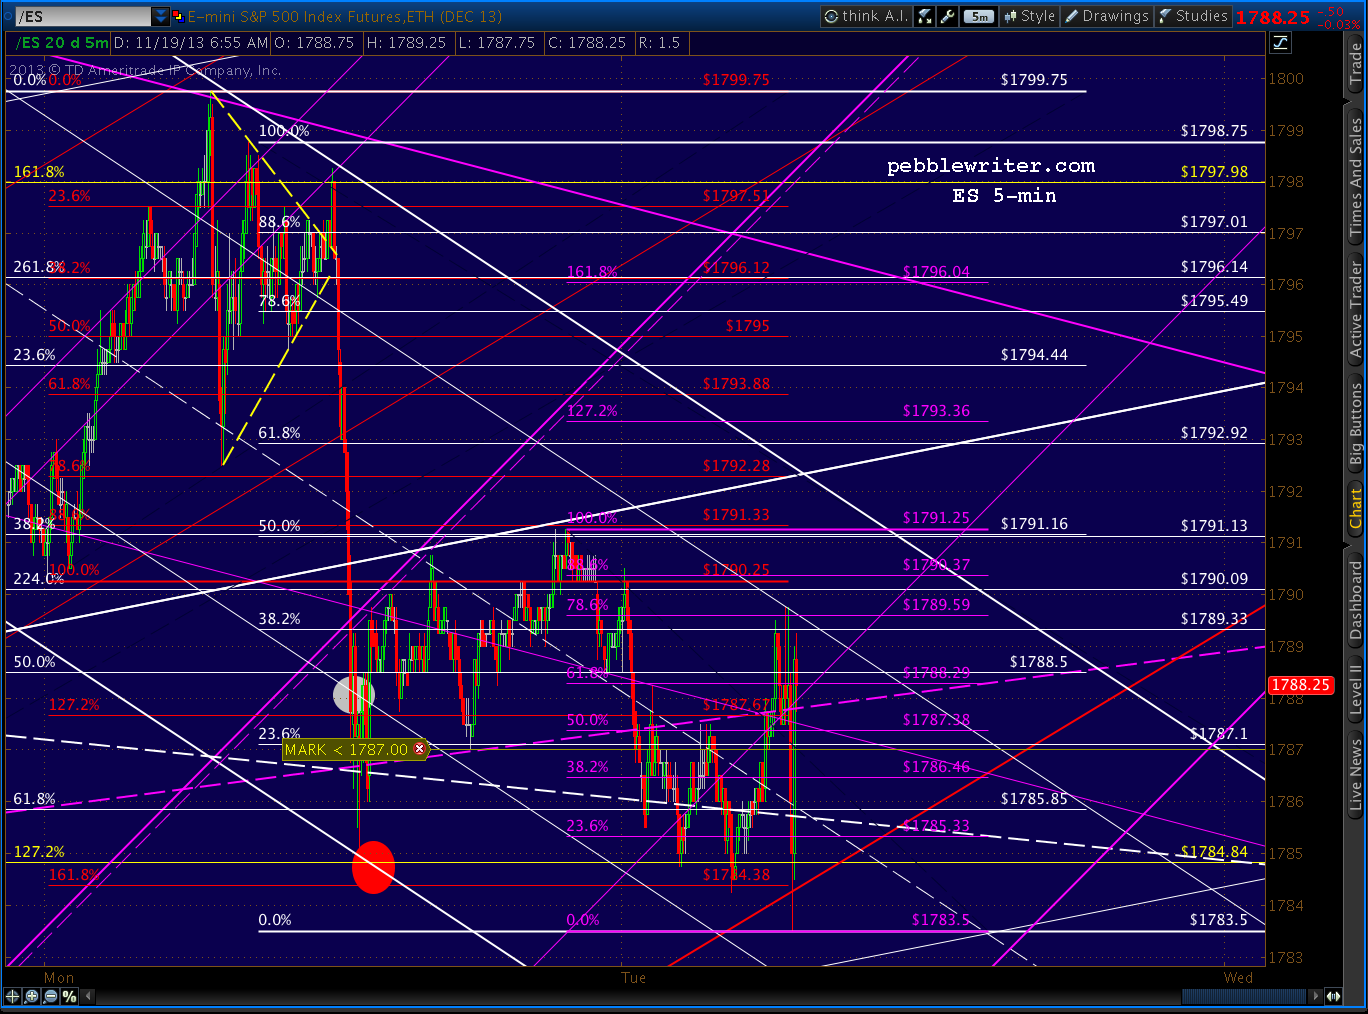
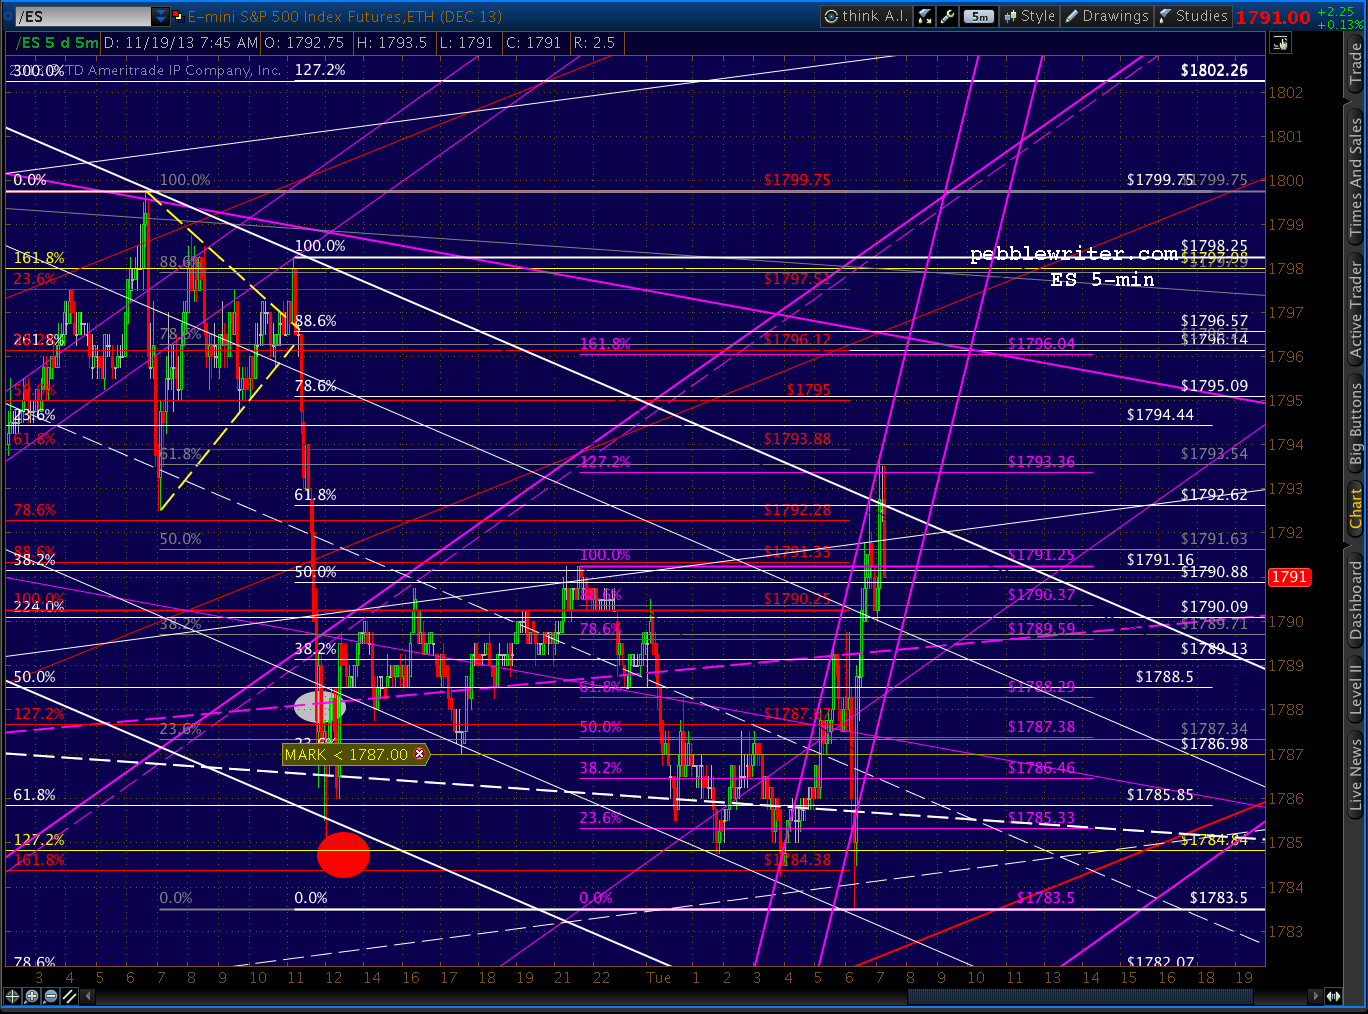
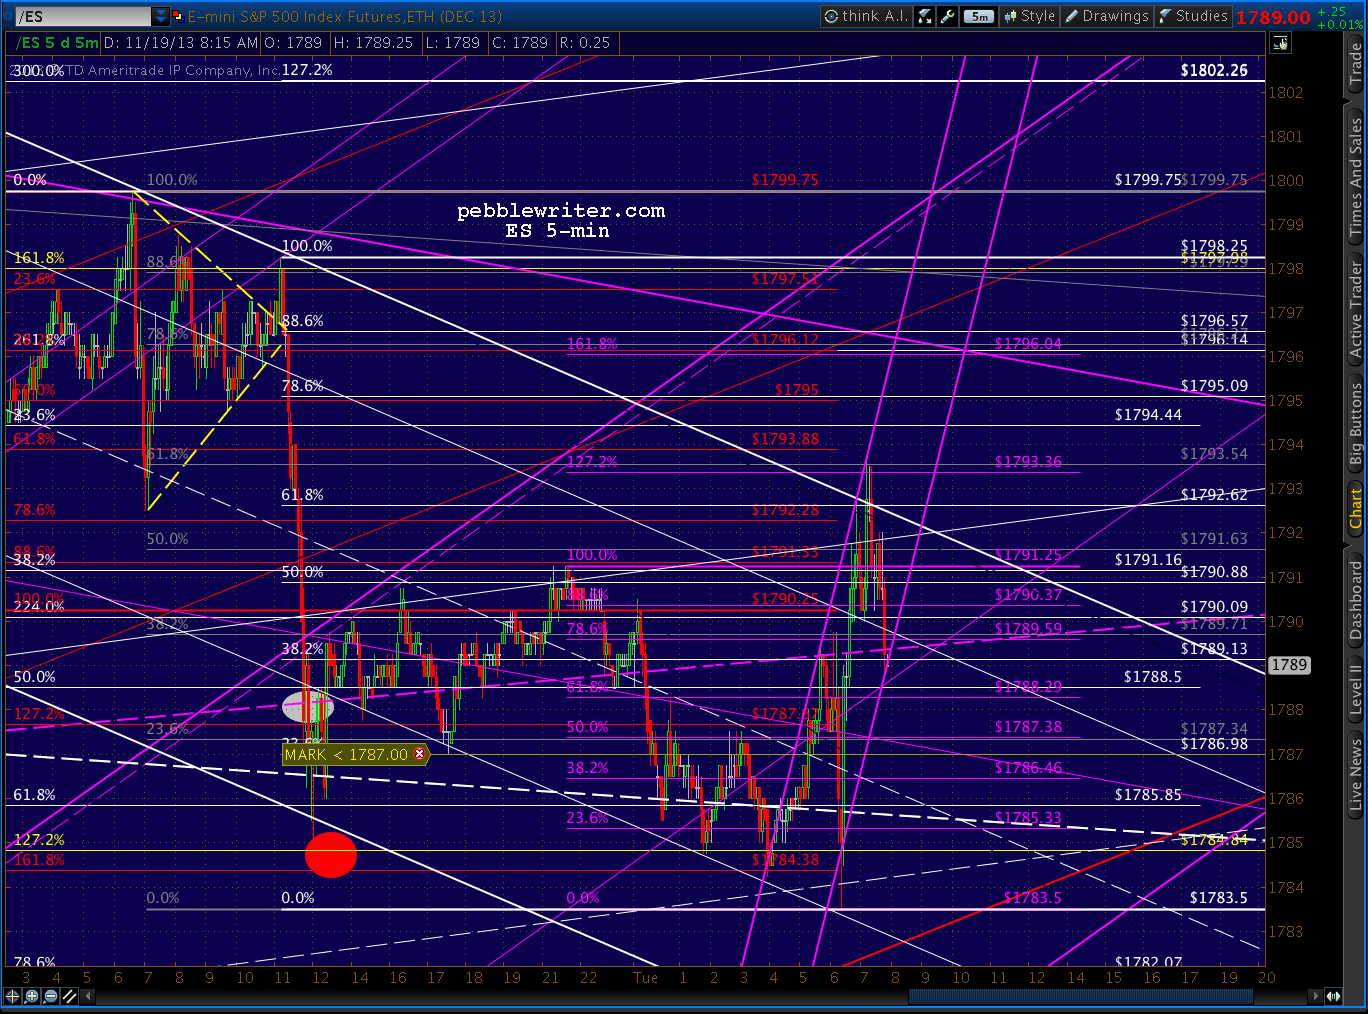
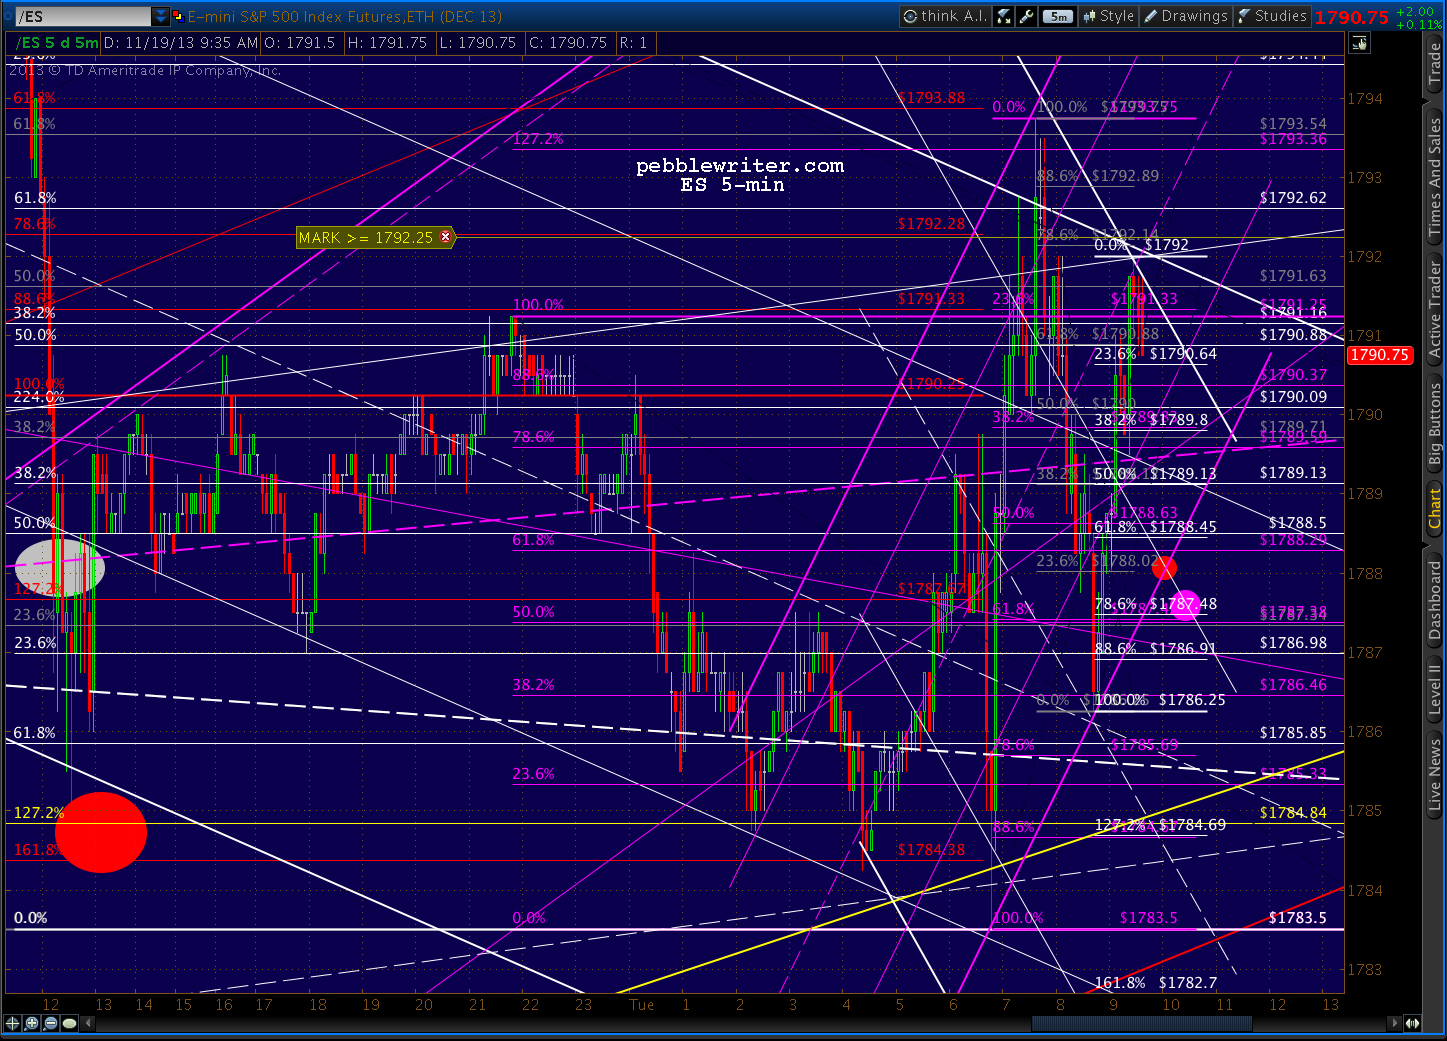
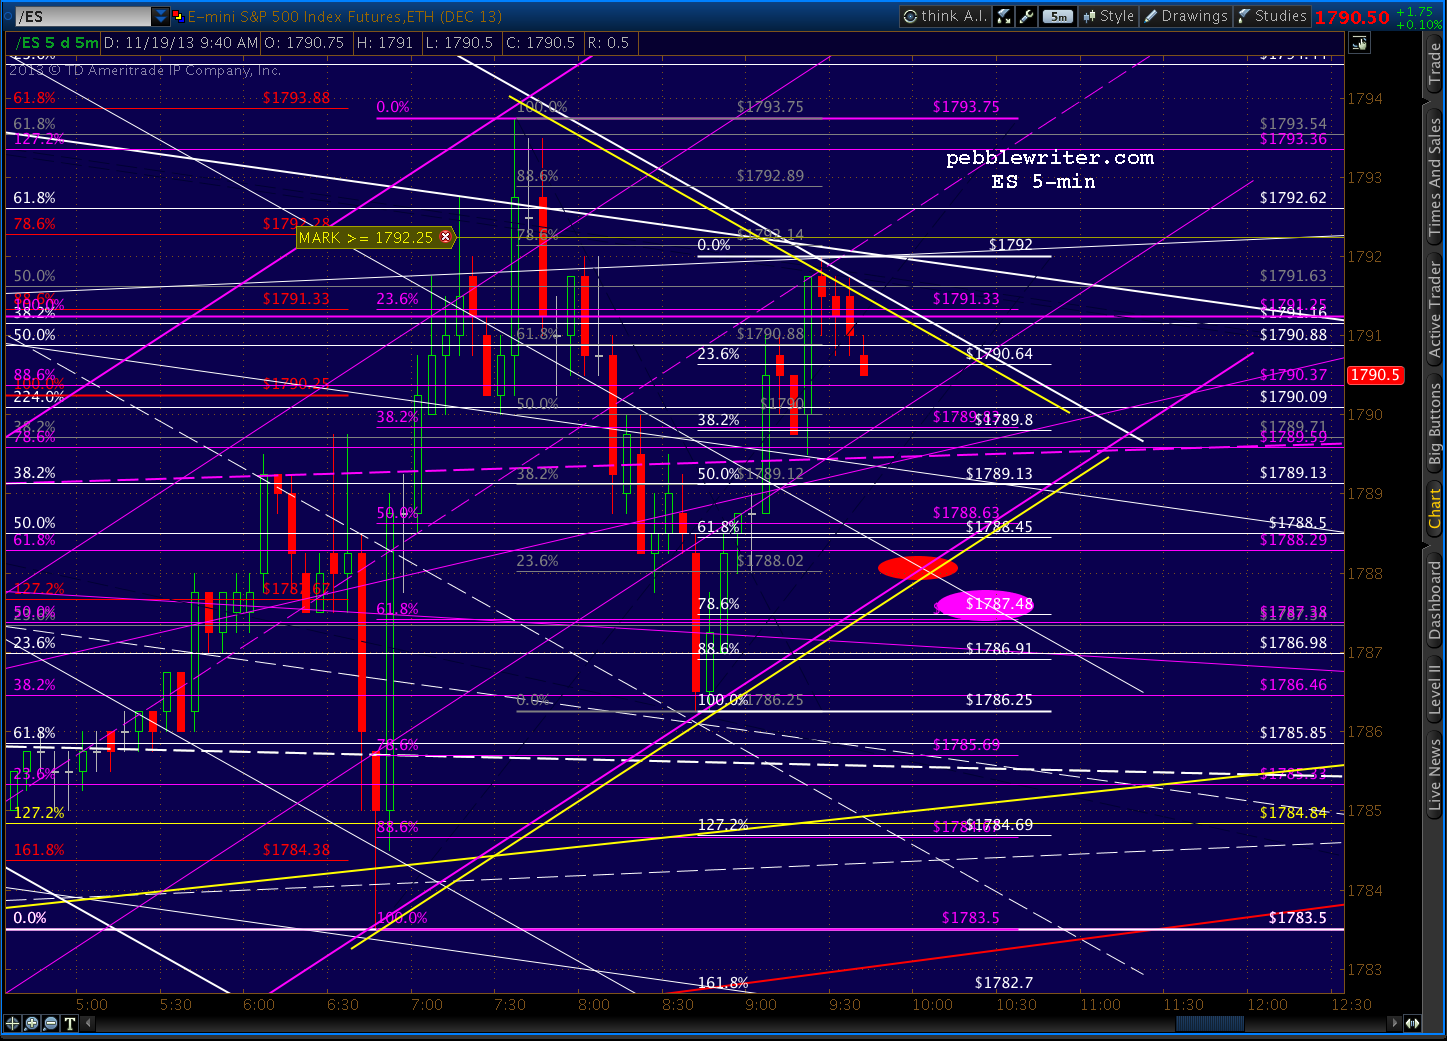
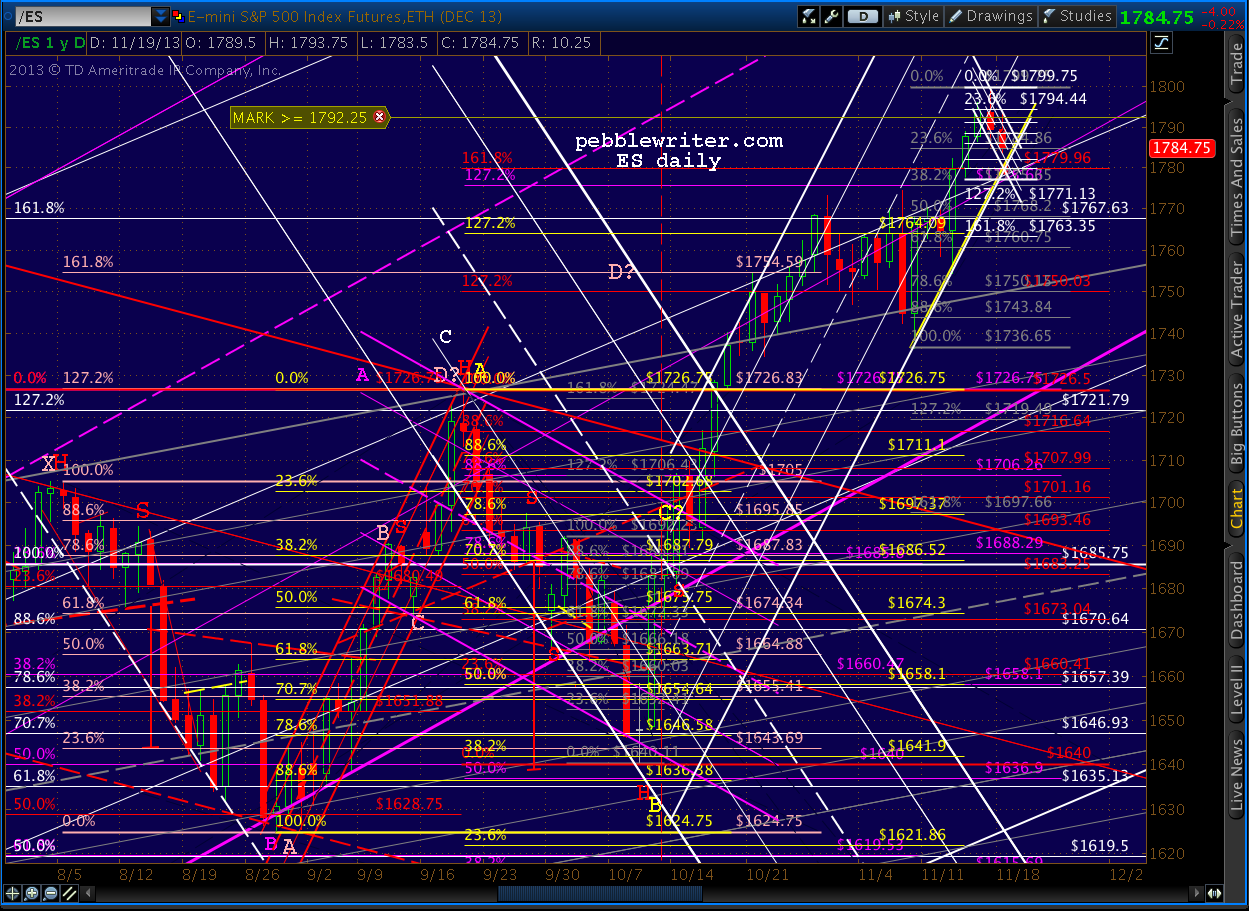
    The eminis made two new lows — with no follow through.  But, it fleshed out the rising red channel, so the 1783.50 low looks reasonably solid and needn’t stop out our 1784.75 long position.

    The key will be getting back above 1791.25.  Though we’re likely to see resistance at 1792.92.

    UPDATE:  10:30 AM

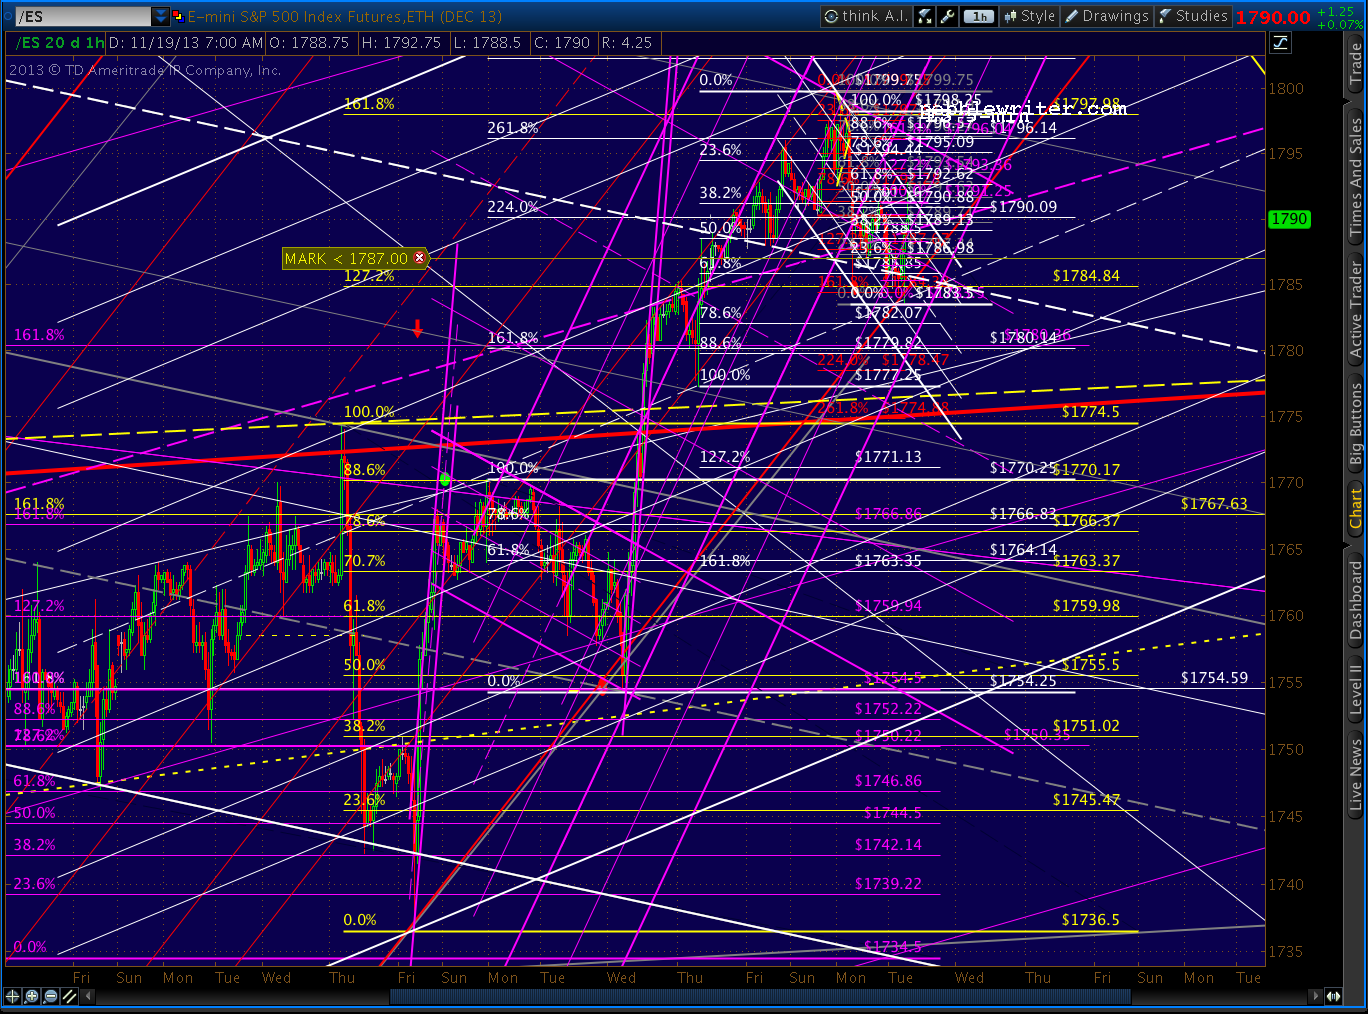
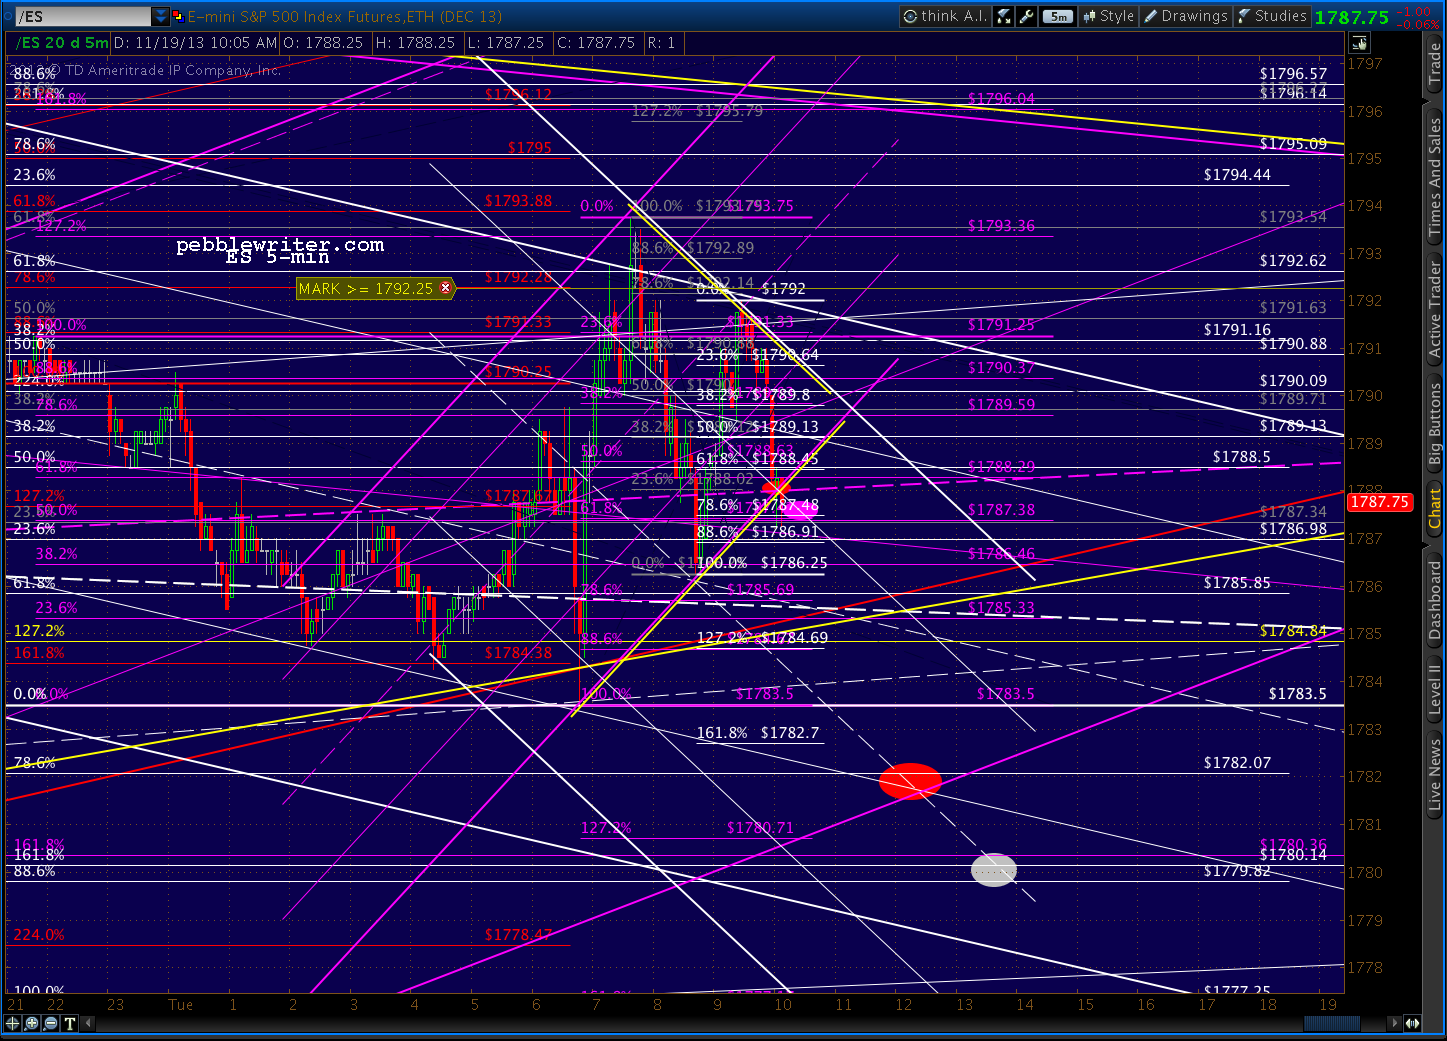
    Got the reversal at 1792.75 at the falling white channel top intersection with the rising white channel line. It’s the channel rising from left to right at a 40% angle in the spaghetti chart below.  Note that the white .618 is one potential .618; the other is the grey one at 1793.54 (from 1799.75 vs 1798.25.)

    I can’t help but wonder if the white .786 at 1782.07 might be in the cards.  It would satisfy the red channel (a little overshoot) better, and would also put in a better bottom due to it being a completed Gartley.  But, for the moment, this move feels rather impulsive.

    If the moon shot is to continue, we’d want to see the purple midline at 1789 hold.  I’m going to apply the official moonshot channel to this move and see what happens.

    UPDATE:  11:15 AM

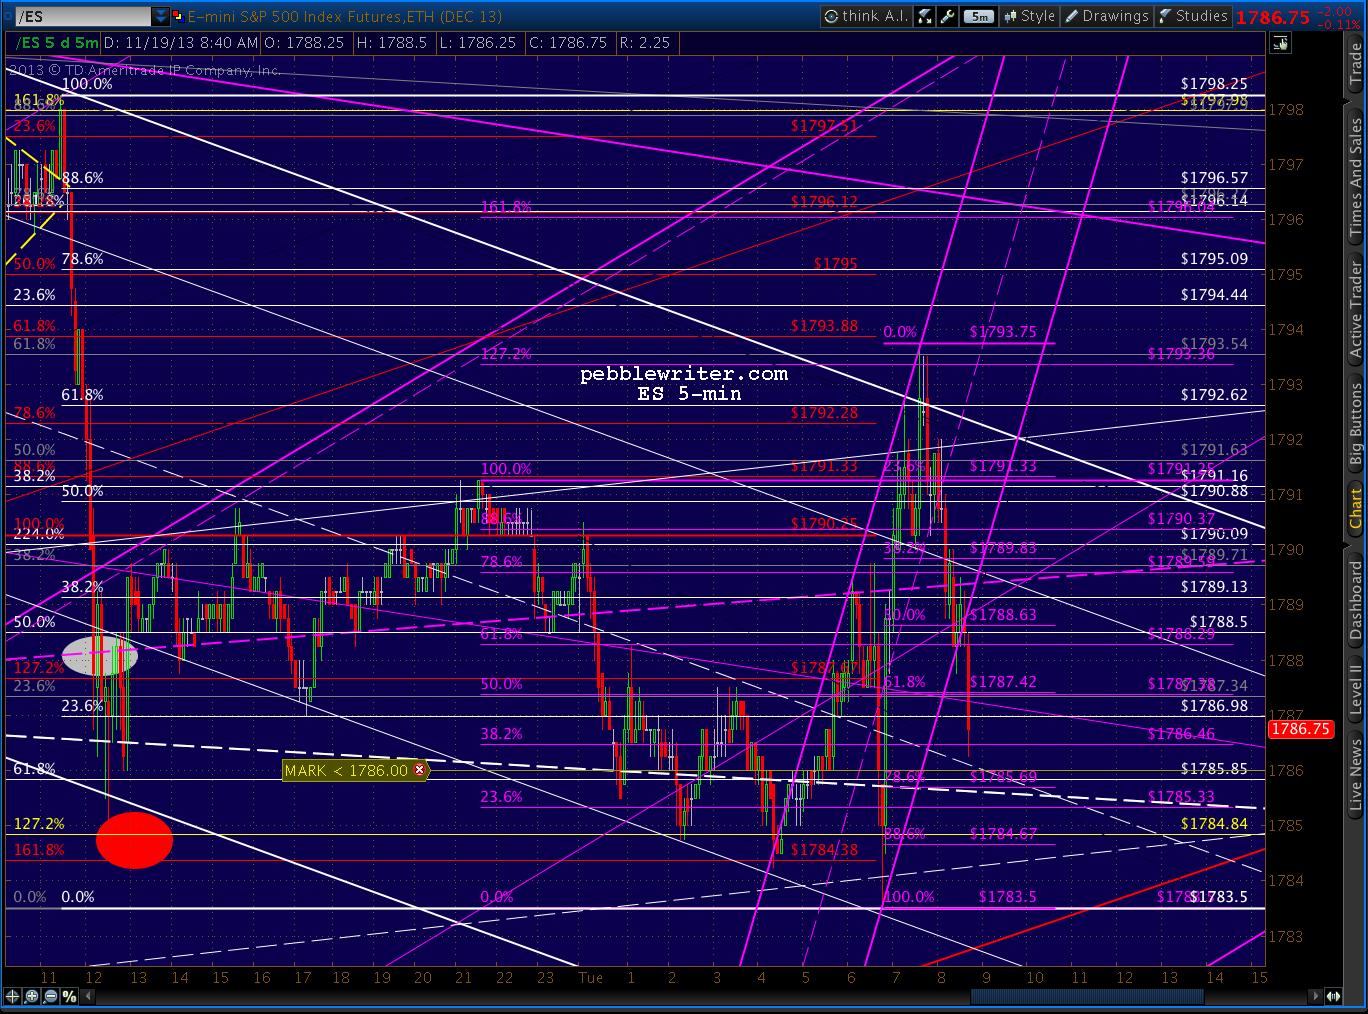
    1788.75 would be a good reversal spot if the moonshot channel is in effect — probably worth a try.  If it holds, next stop should be the grey .786 at 1796.27 (also the purple 1.618) or .886 at 1798.

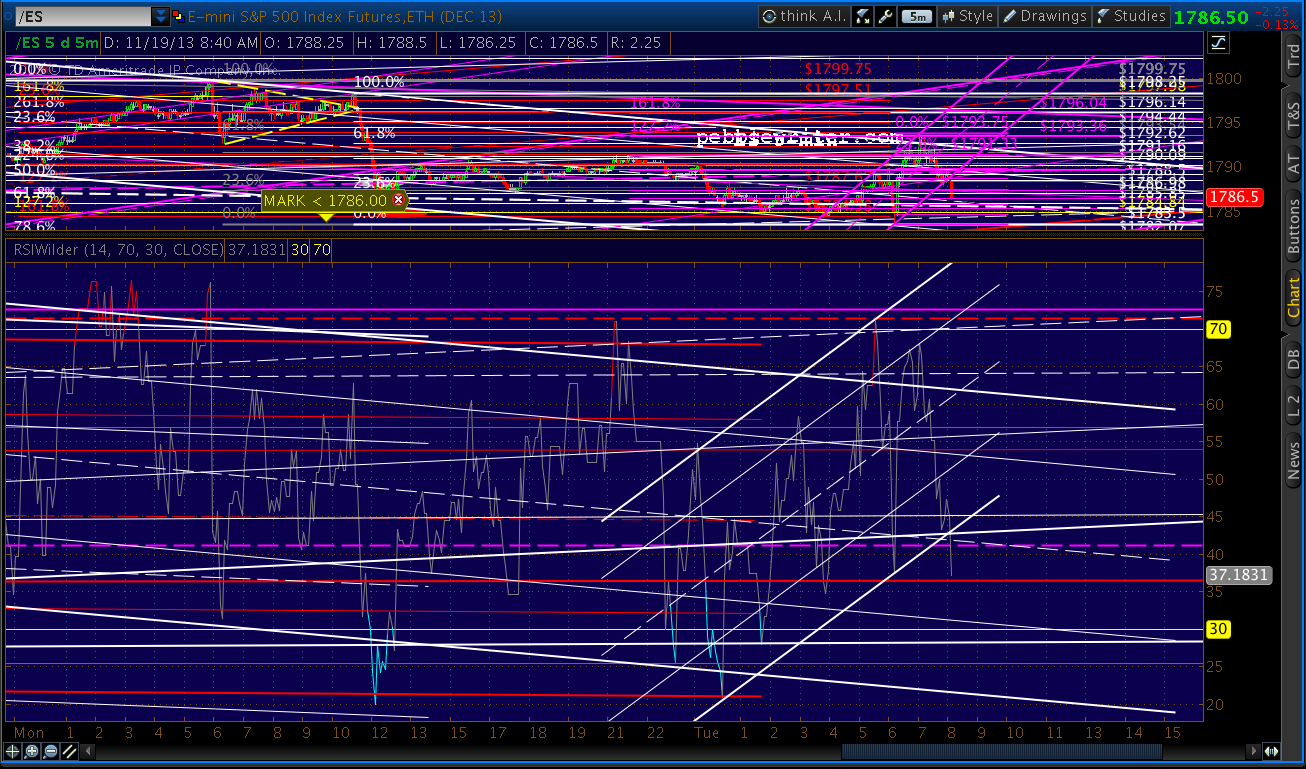
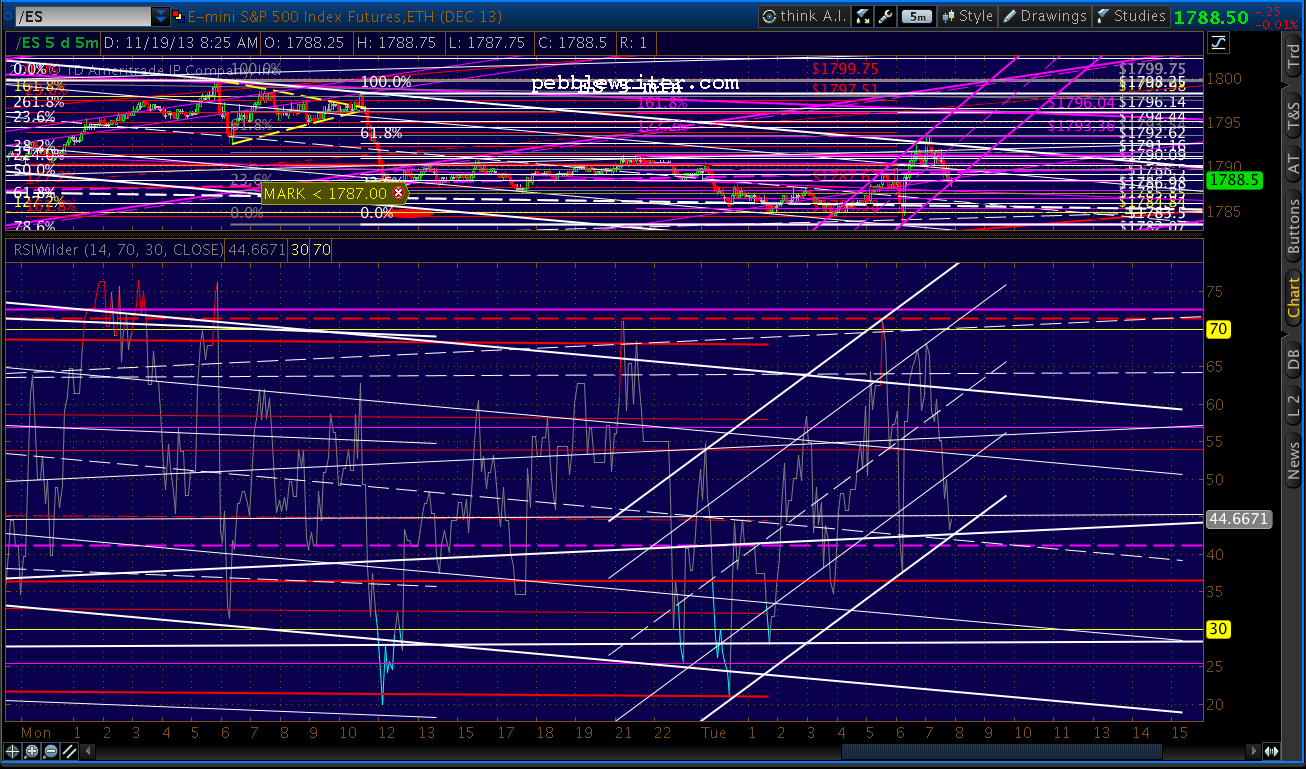
    The 5-min RSI is signalling a potential reversal.

    UPDATE:  11:45 AM

    Spoke too soon.  The 5 min RSI channel broke down, and it’s looking more like another white channel tag at the purple .786 (1785.69) is up next.

    The RSI.  Now we have to worry about a backtest and continued drop…

    UPDATE:  12:39 PM

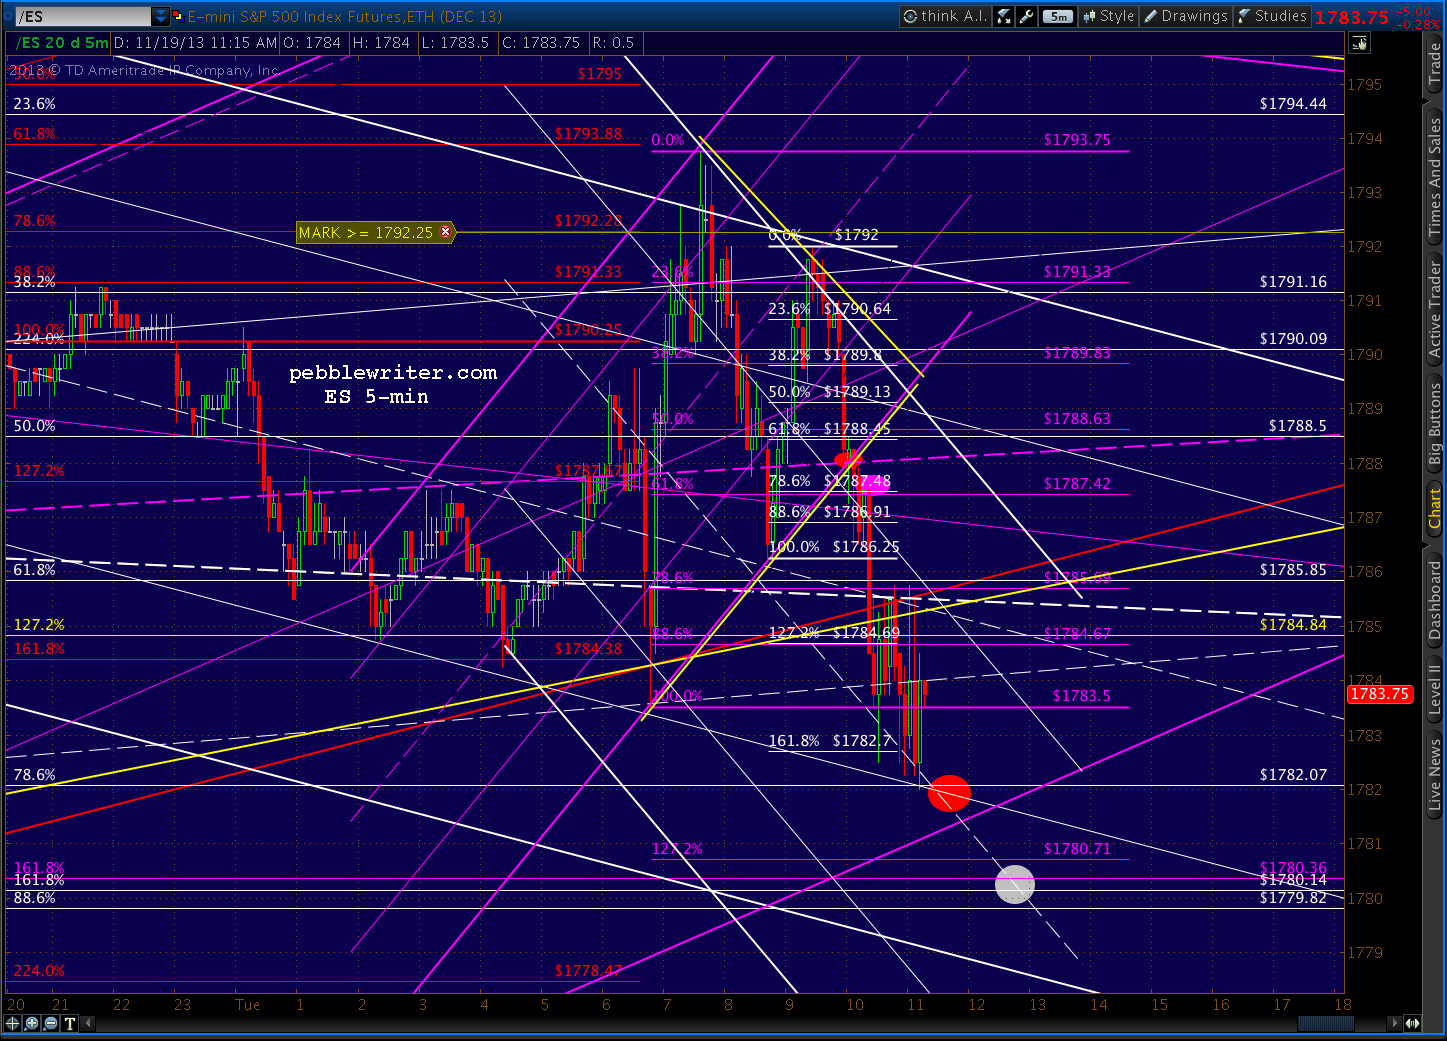
    Finally settling into a triangle pattern.  If the pattern holds, the next stop should be 1787-1788.  Remember, they break out and down.

    Here’s a closeup.  If it breaks down (my top case) it’s likely going for 1782 or 1780 (preferred.)  Note that 1780.36 is the 1.618 of 1726-1640 and 1780.14 is the 1.618 of 1770-1754. So, 1780 would make for good backtests on both.

    UPDATE:  1:08 PM

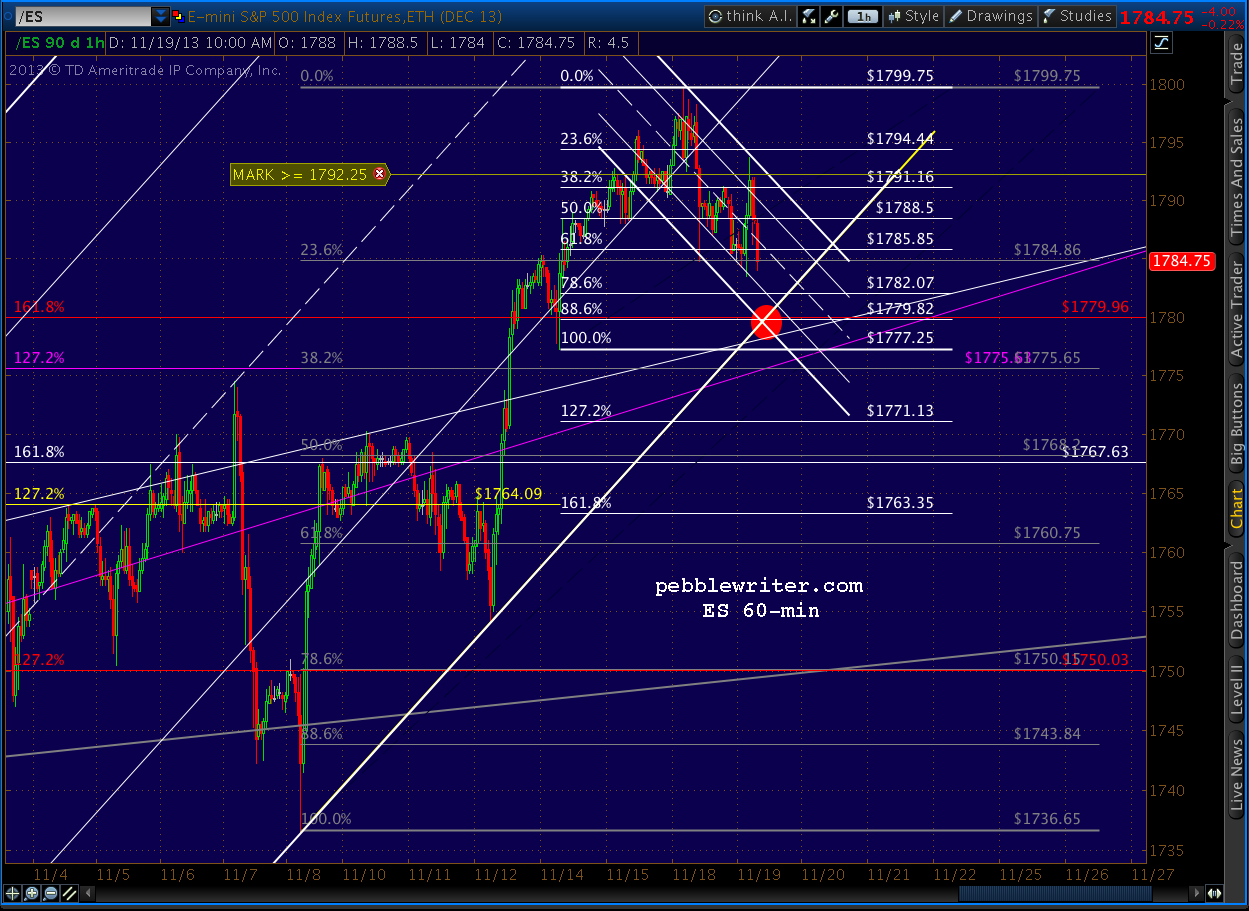
    Looks like a breakdown, so 1780-1782 it is.  These represent the .786 and .886 retracements of the 1777 – 1799 rally.

    The ES chart is getting a bit difficult to read.  Here’s a clearer picture: 1779.82 represents the white .886…

    … and, a backtest of the red 1.618 (1780.36.)

    UPDATE:  2:15 PM

    Tagged the .786 at 1782.  Should get a bounce here, followed by a potential drop to the .886 at around 4PM ET.

  • Why I Don’t Buy and Hold (and, you shouldn’t either)

    There are two factions on Wall Street vying for our money: those who get paid according the number of trades we place, and those who get paid based on how much of our money they manage.  They both play an important role, though I prefer the latter from an ideological standpoint.  If a manager makes me more money, I have no problem with him making more money.  Our interests are aligned.

    Unfortunately, that’s about as far as it goes with most investors.  At least once a week I get a call from someone who’s dissatisfied with their current manager.  But it’s usually it’s due to poor service.  Only once in a while does an investor sit down and compare his manager’s results to the S&P 500 or Russell 2000 and realize they’ve underperformed.

    It’s especially unusual in a rising market like we’ve had the past two years.  Most investors look at their statement when it comes in the mail and compare it to last month’s.  If the value has increased, they file it away and forget about it.  If it’s lower, the statement goes into a pile in the corner of their desk of “things to do something about one of these days.”  When this pile gets to be a few inches thick, they go shopping for a new manager.

    The reality is that over 3/4 of all managers underperform the market.  But, most of their clients don’t realize it.  As long as the statement shows monthly increases, they never question the results.  They’ve been sold on the idea of buying and holding, committing to a long-term investment approach.  If it’s good enough for Warren Buffett…

    IT’S NOT GOOD ENOUGH

    If you’re worth $60 billion and travel like Warren, I’d say leave well-enough alone.  The daily market swings probably won’t spoil your fun.  But, if you’re like the rest of us with big-ticket items on the horizon (weddings, college educations, vacation houses, retirement, etc.), Warren’s approach might not work for you.

    Anyone out there remember 2008?  Did that 60% plunge in the market put a dent in your plans?  Your money manager might have consoled you, encouraged you to take the “long view.”  He might even have outperformed the market and been down only 50%.  But, that probably wasn’t much solace to your daughter whose wedding reception had to be rebooked at the local Motel 6.

    THE BETTER APPROACH

    Not everyone believes in technical analysis.  Even fewer believe in market timing.   In business school, the CFA program, broker training…they teach you that it simply doesn’t work.  As a product of all those fine institutions, I firmly agreed — until 2011.

    I had lost a bundle in real estate (another market they tell you not to time.)  I turned to my pitiful and neglected stock portfolio and wondered if it could possibly pay the bills, let alone replace the money that had vaporized in the real estate crash.  I considered changing managers; but, seemingly everyone had lost money in the crash.  The traditional approach had failed.

    Purely by chance, I came across some articles on chart patterns and Harmonics and began to study.   The S&P 500 had dropped from 1576 in Oct 2007 to 666 in Mar 2009.  By April 2010, it had risen back (retraced) to within 9 points of 61.8% of the drop before plunging again.  According to Harmonics, the next big reversal would come at the 78.6% Fibonacci level (1381.50) to complete a Gartley Pattern.

    On May 2, 2011, I became convinced enough that a reversal was at hand that I wrote my first blog post on pebblewriter.blogspot.com: Charts for May 2, 2011.  Despite the dazzling graphs and compelling title, about 4 people read that post.  Not to be deterred, I followed up with even more dazzling graphs and a more sinister title: Collision Looming.

    That did the trick.  Readership almost doubled… to seven or eight, I don’t really remember.  In fact, I was looking for a rock to crawl back under when, lo and behold, May 2 proved to be the high for the month and the market tumbled by 8% over the next 6 weeks.  My confidence (and my readership) took a turn for the better.

    RESULTS

    By early June, I had discovered an analog that indicated a huge reversal at about SPX 1345 in late July.  I took a deep, calming breath and and started posting.  When the market plunged 18% from 1347 on July 23, I became a true believer in market timing — as did those readers who were able to protect themselves from the decline (not to mention those who profited from big bearish bets.)

    By the time the next big top approached in March 2012, I had set up pebblewriter.com and was working full-time on forecasting big market moves.  The downturn from the Butterfly Pattern that completed at 1421 [see: All the Pretty Butterflies] provided a great launch pad for the new site’s track record.

    One of the more interesting comments in that Mar 29, 2012 post was the following:

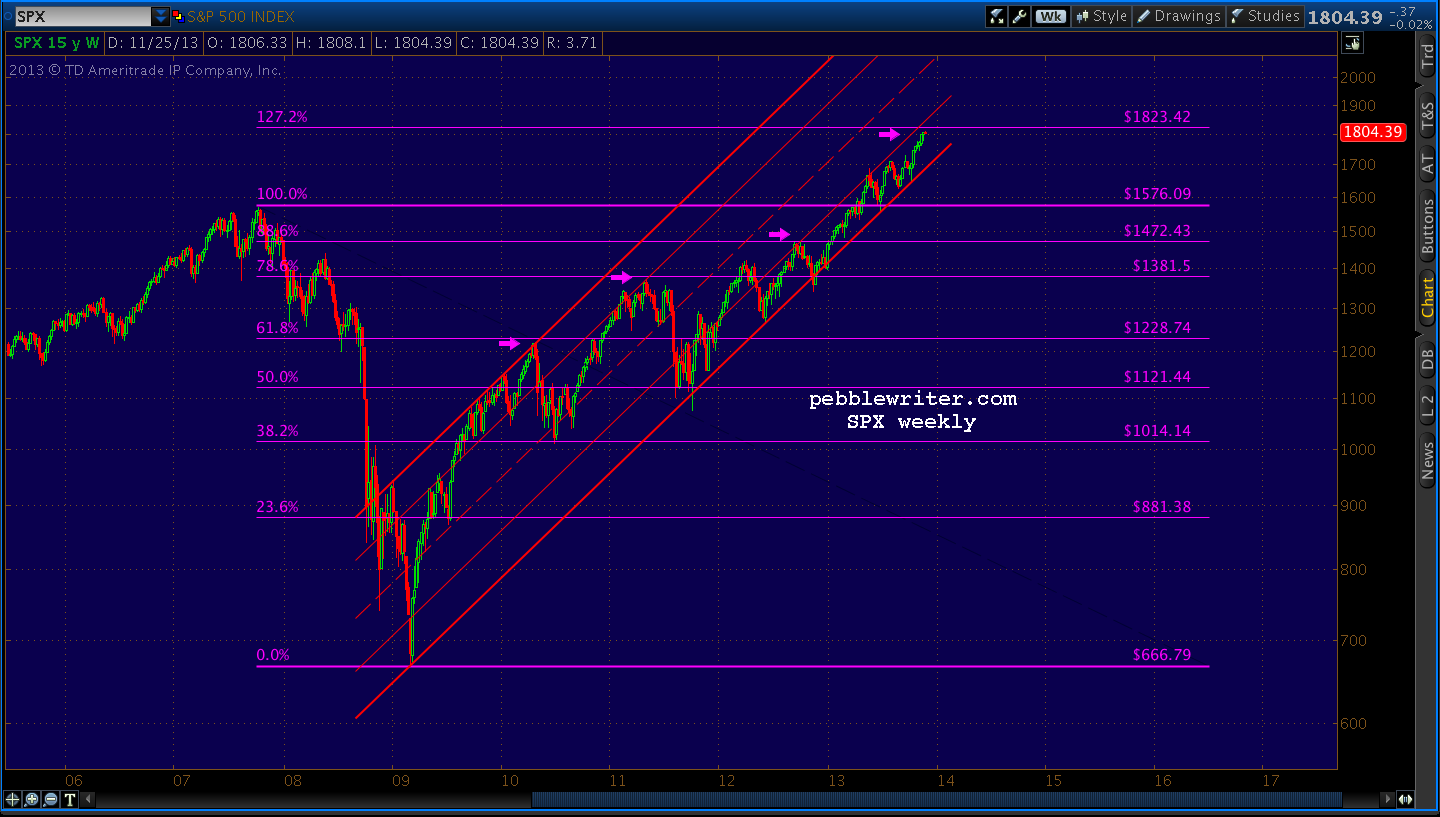
    If you’re an überbull, there’s a potential silver lining.  The May 2nd 1370 peak — a .786 retrace of the 2007-09 drop, could be the Point B of a much larger Butterfly pattern.  If it were, we’d have a 1.272 extension up around 1823 and a 1.618 at 2137.

    It was accompanied by this chart which shows the major Fibonacci levels between 1576 and 666 as well as the 1.272 extension.

    In fairness, I also mused at the time that reaching 1823 by the end of 2013 would probably mean $8 gas, 12% T-bills and $3,000 gold.  Although tongue in cheek, I was trying to make the point that such a market result would surely come at the expense of much higher inflation and a thoroughly debased US dollar.

    In fact, there were many who felt that the amount of QE necessary to goose the market another 28% — after having already doubled — would result in runaway inflation.  Didn’t happen.  But, look at what did happen — even though the economic forecasts were way off target.

    The S&P 500 is only a few FOMC Minutes (pardon the pun) away from reaching 1823. Today’s high missed it by 1.15% — very close to the margin of error for the past three Harmonic reversals (the .618, .786 and .886.)

    The 28% return is in the bag, even for those who bought and held from 1421 (the red arrow) on Mar 29, 2012.  But, the three previous Harmonic reversals ranged from 8.9 – 21.6%, with an average decline of 15.9%.  How much of that 28% will you get to keep?

    BTW, those of us who shorted at 1421, went long at 1288, shorted again at 1494, went long again at 1343, etc. did much better than 28% — earning an average of 12% per month since then [see: Pebblewriter Results.]  Most importantly, there were no negative months — or even weeks.  We didn’t always hit it out of the park.  But, we also never took a fast ball to the family jewels.

    THE CATCH

    It’s not automatic.  Harmonic Patterns, Chart Patterns and Analogs fail just often enough that you can’t really “set it and forget it.”  Nor is there an automated approach that works consistently enough for me to manage my portfolio from the helm of an Oyster 625 (though, I’d love to try some day.)

    Investing like this is a full-time job — especially if you’re trying to capture the moves within the moves.  I’m usually up by 4:30 AM and make my last check on global markets around 11PM.  If you enjoy sleeping, have any hobbies or want to wake up to someone other than this guy, you might want to consider using a professional manager.

    But, examine the manager’s performance during the corrections, not just the rallies.  See any drawdowns in there you’d have been uncomfortable with?  Get an explanation.  Is he using some goofy homegrown benchmark that doesn’t relate to your future liabilities?  Ask why.

    And, if he tells you that trying to time the market is dangerous, or not tax-efficient, or simply can’t be done — keep looking.  The management fees you spend every year entitle you to more than a glossy annual report and stale Fruit Cake.

    ALL TRUTHS…

    I have a little quote of Galileo’s that I like on pebblewriter.com (he’s never complained…)  I think it speaks well to investing in general, and buy and hold investing in particular.

    “All truths are easy to understand once they are discovered; the point is to discover them.”

    The past 13 years have seen two crashes of over 50%.  After inflation, the S&P 500 index isn’t even back to its March 24, 2000 high.  With markets at nominal all-time highs and approaching yet another potential turning point, maybe it’s time to focus on a different approach.




  • Charts I’m Watching: Nov 18, 2013

    We’re at another one of those interim Fib levels where we could see a pullback before the final assault on our target.  ES and SPX are both apparently intent on bagging 1800.
    The dollar has continued its drop as expected.  Watch for a potential backtest of the broken white channel midlines.

    USDJPY, after reacting as we expected at the .886, has found channel support.

    I suspect that, as the pair goes, equities will go with respect to the size of the pullback.  Note that the pair has backtested the rising wedge we’ve been watching.

    But, this is where wedges get tricky, as the time period one is charting, shadows, tails, etc. can influence the look of the wedge.

    TNX has reacted at the .618 retracement of the drop from 29.84 to 24.71.  Bonds should get a small bump (and rates drop) from whatever equities sell-off we get here.

    Downside targets coming up.

    continued for members

    (more…)